intelligent transport systems, public transport priority, microscopic modelling
Alica KALAŠOVÁ, Ľubomír ČERNICKÝ*, Jana KUPČULJAKOVÁ
University of Žilina, Faculty of Operation and Economics of Transport and Communications Department of Road and Urban Transport
Univerzitná 8215/1, 010 26 Žilina, Slovakia
*Corresponding author. E-mail: lubomir.cernicky@fpedas.uniza.sk
THE IMPACT OF PUBLIC TRANSPORT PRIORITY ON THE TRAFFIC IN
THE CHOSEN PART OF THE CITY OF ŽILINA
Summary. One of the main objectives of all larger cities is to ensure effective transportation of people. There are two ways; how this objective can be reached – building of new infrastructure and effective using of the existing one. Because of the narrow streets and density of existing buildings within the city, in most cases it is not possible to extend current infrastructure. Hence, the second way is the only possible solution for such cities. Well-functioning management system improves the flow of traffic, reduces road accidents, and improves the comfort during transportation. Public transport is able to satisfy the transport requirements of a much larger number of passengers and acts more favourably than private transport in urban areas. Therefore building a public transport system of high quality, which also means public transport priority on the signal controlled junctions, is the key part of reaching the objective of ensuring effective transportation of people. In 2011, there were reconstructed roads around the Aupark Shopping Centre in Žilina. The paper is focused on traffic situation of the street Veľká Okružná; which was also rebuilt during the reconstruction. Based on microscopic modelling and road accidents data this paper compares two variants: (1) current traffic situation of this street and (2) the traffic situation, when the public transport priority was implemented during the reconstruction.
WPŁYW PIERWSZEŃSTWA
TRANSPORTU PUBLICZNEGO NA RUCH
W WYBRANEJ CZĘŚCI MI
ASTA ŽILINA
ulicy Veľká Okružná, która również była przebudowana w czasie rekonstrukcji. Z wykorzystaniem modelowania mikroskopowego oraz danych o wypadkach drogowych praca porównuje dwa warianty: (1) obecną sytuację na drogach oraz (2) sytuację na drogach przy pierwszeństwie transportu publicznego wprowadzonego w trakcie rekonstrukcji.
1. INTRODUCTION
In Slovakia as well as in whole Europe, are being constantly constructed new and wider roads, highways, tunnels, and urban bypasses. However none of it is enough because the level of congestion and accrue of traffic accident in the morning peak is everywhere the same [1]. Strategic problems of transport development must be solved in every European country or a specific region [2].
A gradual decrease of transport performance is characteristic for public transport in several last years, which is caused by increase of individual transport which influences public transport in many cases [3].
The increase of individual transport which is more comfortable for its user especially in time of transport peak in the city with high intensity of traffic flow unfavourably influence on the quality of transport and the environment. The emergence of congestions, formation of exhausts and noise, decreasing of road safety, traffic slowing and delay of vehicles at the junctions, etc. - all of these negative effects of individual transport affect public transport significantly. Public transport becomes unattractive for its users, despite the fact that in many cases can provide comparable and sometimes better transport options.
From the point of long-term development of the number of passengers it is possible to see the annual decline of 3% - 10% [4].
One of the main criteria in choosing the means of transport is the transfer time. It is the time required for walking to the bus stop, waiting time for bus connection, and time spent in the vehicle, and time required for eventual transfer, and finally time to walk from the bus stop. It follows if the transfer time is shorter public transport become more attractive for passengers [3].
Character of movement of public transport vehicles is significantly different as movement of others vehicles. It is caused by stopping buses at bus stops between junctions and by embarking and disembarking passengers. It means that the speed of public transport vehicles is lower than the speed of passenger cars. Because of this, junction in coordination for individual transport vehicles can become “brakes” for public transport vehicles. Delays caused by traffic lights reach values at intervals 10-30% of the total delay [5].
Giving the priority to movement of vehicles on public transport can significantly reduce these restraint and increase quality of service [6].
There are various ways of public transport priority: physical measures (with-flow lanes, contra-flow lanes, bus gate, bus way), traffic signal priorities and integrated measures of urban public transport priority (e.g. with-flow bus lanes with the signalling measures).
The principles of the correct designing of the public transport priority are:
- to make public transport priority in the form of public transport lanes in the sections, where public transport vehicles share space with cars; this eliminates delays in the case of congestion,
- to enable barrier-free connection for cycling and pedestrian transport,
- to make priority in the form of regulation of individual transport in the case of no possibility of public transport priority lanes,
- to place bus stops so that road traffic doesn´t stop during stopping time of public transport vehicle [7].
At a signal, priority can be awarded to a transit vehicle in different ways and methods. Priority concepts are differentiated by how, when, and where transit signal priority is applied [9, 10].
Preference of urban public transport by light signalling means possibility of a preferred option and extension of the green signal for a vehicle, which come to a junction. It is desirable so that the vehicle can cross signal controlled junction as far as possible without stopping or at least with minimum delay [3].
By reducing delay time not only driving time is reduced but also speed is increased. It can even reduce the number of vehicles for the same intervals of timetable [5].
2. CHARACTERISTIC OF THE CHOSEN PART OF THE CITY OF ŽILINA
The Veľká Okružná Street with its length of about 1.5 km is one of the most important road communications in the city of Žilina. It starts at the junction of the street – Veľká Okružná and 1.Mája and ends at the Murgašova Street. In the past it was an important transport corridor, which led traffic from the Strečno (today´s road I/18) to Hálková Street and Rondel and fly-over which roads from Prievidza, Čadca and Bratislava were connected to.
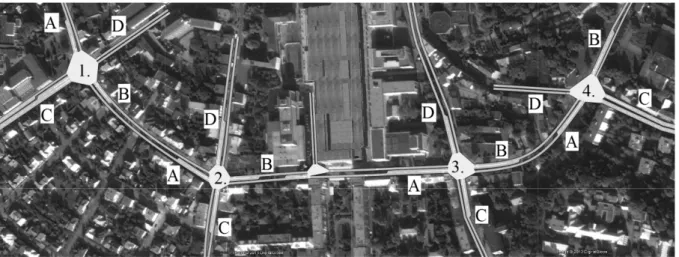
Currently Veľká Okružná Street consists of two-lane urban roads and junctions at grade. It is distributor road of the urban roads category B1 and together with the streets P.O.Hviezdoslava, 1.Mája, Hurbanova, Legionárska, and Kálov creates the second ringroad of Žilina. In its vicinity are built residential building, amenities, secondary schools, police, companies and Protestant church, which generate a large number of transit relations. Daily over 10,000 of vehicles pass this street, while an hour´s traffic volumes come up to 800 veh/sec [8]. Fig. 1 shows traffic state at the chosen part of the Street Veľká Okružná. In addition, nearly each public transport line leads on this street or at least crosses the street. Due to these facts the traffic solution on this street has a decisive influence on the quality of public transport from the point of view of delay times and travel speeds.
Fig. 1. Rush-hour traffic at the chosen part of the street Veľká Okružná [pcu/h]
Rys. 1. Ruch w godzinach szczytu w wybranej części ulicy Veľká Okružná [pcu/h]
3. MIRCROSIMULATION OF THE STREET VEĽKÁ OKRUŽNÁ
calculated new signal plans for these junctions. Currently these junctions are in coordination, but there is no public transport priority.
Fig. 2. The model of the network – chosen part of the Street Veľká Okružná (V.O.)
Junctions: 1 – V.O. Hálková; 2 – V.O. Komenského; 3 – V.O. – Spanyolova; 4 – V.O. – Predmestská Rys. 2. Model sieci – wybrana część ulicy Veľká Okružná (V.O.)
In order to determine the potential advantages and disadvantages of public transport priority in the centre of the city of Žilina, the microscopic simulation at the chosen part of the street Veľká Okružná was carried out (Fig. 2). There were investigated two variants:
(1) Simulation of the current traffic situation at these signal controlled junctions, (2) Simulation of public transport priority in the form of traffic signal priority.
For the microscopic simulation, Aimsun was used. The inputs data for simulation were traffic volumes at the sections, turnings of vehicles at the junctions (these were obtained from traffic surveys of the University of Žilina), public transport lines, characteristics of individual vehicles, and signal plans of the junctions.
Simulation in Aimsun provides various outputs, which are divided into groups: network statistics, section and turn statistics, subpath statistics, O/D matrix statistics and public transport statistics. For each groups are generated statistics as mean flow, density, mean speed, harmonic mean speed, travel time, delay time, stop time, number of stops, total travel, total travel time, fuel consumed, pollution emmited; the differences among groups are in the inputs into calculation and in the units, into the which the output are calculated.
For the comparison in our study were chosen following outputs for the network:
- delay time; which means average delay time per vehicle per kilometer. This is the difference between the expected travel time (the time it would take to traverse the system under ideal conditions) and the travel time. It is calculated as the average of all vehicles and then converted into time per kilometer.
- harmonic speed, which means harmonic mean speed for all vehicles that have left the system. - travel time, which means average time a vehicle needs to travel one kilometer inside the
network. This is the mean of all the single travel times (exit time - entrance time) for every vehicle that has crossed the network, converted into time per kilometer [11].
3.1. Current traffic situation
With the help of microscopic modelling of the current situation there were found out increased Delays times for public transport vehicles nearly at every junction entrance with public transport (see Fig. 3). But the most problematic entrances seemed to be entrances:
- V.O. – Hálková; where Delay Times for public transport coming from the street Hálková were 66.9 sec and 43.9 sec. (entrances 1C and 1D);
- V.O. – Komenského; P.T. Delay Times coming from the street Komenského are 44.7 sec (from the city centre – entrance 2.D) and 29.7 sec (from Hliny – entrance 2.C);
- V.O. – Spanyolova; high Delay Times for the PT. coming from Dom Odborov (51.9 sec – entrance 3.A) and for the PT coming from the Spanyolova street (28.9 sec – entrance 3.C); - V.O. – Predmestská – 1. Mája; Delay Times at the entrance from the street 1. Mája are 35.7
sec (entrance 4.B), and at the entrance from the street Spanyolova 30.5 sec (entrance 4.A). When comparing delay times for public transport and delay times for individual transport, it is possible to see to a certain extend direct relation between them. Given to this relation and traffic volume of the junction entrances it can be stated that delay times are not caused by improper traffic control but they are caused by traffic saturation and space limitations within this area.
Fig. 3. Simulated delay time [sec] in sections for current traffic situation
Rys. 3. Symulowany czas opóźnienia [sek.] w odcinkach dla obecnej sytuacji na drodze
3.2. Public transport priority
stayed nearly unchanged. Delay times for individual transport slightly increased, only few sections showed very high values of delay time (117.2 sec – entrance 4.D, 77 sec – entrance 1.D).
Fig. 4. Simulated delay time [sec] in sections for the traffic situation with the public transport priority Rys. 4. Symulowany czas opóźnienia [sek.] w odcinkach dla sytuacji na drodze z pierwszeństwem transportu
publicznego
3.3. Network statistics
Looking at previous outputs you can see how public transport priority may influence traffic at the sections. Generally, network summary statistics (Tab. 1) shows increase of 11,44 sec/km for the delay time of cars (which means increase of 10,5%), but their also shows potential to decrease delay times for public transport of 88 sec/km (which means decrease of 66,3%). Similarly, the speed of public transport vehicles may increase at 75%.
Table 1 Network statistics
Time Series Value Total Difference Difference Relative Reality PT Priority
Delay Time All 108,86 sec/km 117,9 sec/km 9,04 sec/km 8,3 % Delay Time Bus 133,02 sec/km 44,83 sec/km -88,19 sec/km -66,3 % Delay Time Car 108,16 sec/km 119,6 sec/km 11,44 sec/km 10,58 % Harmonic Speed All 20,57 km/h 19,58 km/h -0,99 km/h -4,81 % Harmonic Speed Bus 17,56 km/h 30,88 km/h 13,32 km/h 75,85 % Harmonic Speed Car 20,67 km/h 19,41 km/h -1,26 km/h -6,1 % Travel Time All 175,35 sec/km 184,37 sec/km 9,02 sec/km 5,14 % Travel Time Bus 205,65 sec/km 117,44 sec/km -88,21 sec/km -42,89 % Travel Time Car 174,48 sec/km 185,9 sec/km 11,42 sec/km 6,55 %
4. CONCLUSION
use suitable transport modelling software which are able to visualise transport network and in this way to provide better explanatory value mainly for people who are not experts in this area [5].
The results from the microscopic simulation of the particular territory predict significant improvements in the preferred mode of transport (66% decrease of delay time for public transport), while there was relatively little decrease of quality of the non-preferred mode of transport (individual transport – car, 10,5% increase of delay time). But there are also sections where monitored characteristics for non-preferred mode of transport improved as well. The mentioned sections are the sections where time period for preferred mode of transport (public transport) is short. On the other hand, main worsening are on the sections where no public transport lines are or time period for public transport vehicles is long. Although this fact is not desirable from the point of view of individual transport, but it is the heart of public transport priority. Therefore the proposal of public transport priority requires careful preparation where every risk is examined and subsequently minimised/eliminated.
References
1. Kalašová, A. & Kupčuljaková, J. The future in the telematics applications as support for increased safety. Transport Problems. 2012. Vol. 7. No. 1. P. 103-110.
Available at:
http://transportproblems.polsl.pl/pl/Archiwum/2012/zeszyt1/2012t7z1_11.pdf
2. Cappelli, A. & Libardo, A. & Nocera, S. Theories, strategies and actions for the efficient development of regional transit. Ingegneria Ferroviaria. 2013. Vol. LXVIII. No. 11. P. 943-962. 3. Kupčuljaková, J. The issue of municipal transport preference. Doprava a spoje. 2011. No. 2.
P. 91-96. Available at:
http://fpedas.uniza.sk/dopravaaspoje/2011/2/Kupculjakova.pdf
4. Ondruš, J. & Dicová, J. Prediction of development mass passenger transport in Žilina district. Perner´s Contacts. 2011. Vol. 6. No. IV. P. 304-310.
Available at:
http://pernerscontacts.upce.cz/23_2011/Ondrus.pdf
5. Kupčuljaková, J. Possibilities of ensuring urban public transport priority. Archives of transport system telematics. 2012. Vol. 5. No. 4. P. 12-16.
6. Stoyanov, P. & Gagova, P. Some implementation of quality of public transport. Transport Problems. 2012. Vol. 7. No. 2. P. 37-42.
Available at: http://transportproblems.polsl.pl/pl/Archiwum/2012/zeszyt2/2012t7z2_04.pdf
7. Gogola, M. Modelové riešenie preferencie MHD na vybranej časti mesta Žilina. Doprava a spoje. 2012. No. 1. P. 94-103.
Available at: http://fpedas.uniza.sk/dopravaaspoje/2012/1/gogola.pdf 8. Teritorial Structure Plan of the city of Žilina.
Available at:
http://www.zilina.sk/docs/2012/upm_zilina/Zavazna_cast_text.pdf
9. Ekeila. W. & Sayed T. & Esawey, E.M. Development of a Dynamic Transit Signal Priority Strategy. 2009. Available at:
http://conf.tac-atc.ca/english/resourcecentre/readingroom/conference/conf2009/pdf/Ekeila.pdf 10. Altun, S. & Furth, P. Scheduling buses to take advantage of transit signal priority. Transportation
VEGA Project no. 1/0159/13 – KALAŠOVÁ, A. and collective: Basic Research of Telematic Systems, Conditions of Their Development and Necessity of Long-term Strategy. University of Žilina, the Faculty of Operation and Economics of Transport and Communications, 2013-2015.
Centre of excellence for systems and services of intelligent transport II.
ITMS 26220120050 supported by the Research & Development Operational Programme funded by the ERDF.
"Podporujeme výskumné aktivity na Slovensku/Projekt je spolufinancovaný zo zdrojov EÚ"
![Fig. 1. Rush- hour traffic at the chosen part of the street Veľká Okružná [pcu/h]](https://thumb-eu.123doks.com/thumbv2/123dok_br/18360682.354124/3.892.135.755.655.943/fig-rush-hour-traffic-chosen-street-veľká-okružná.webp)
![Fig. 3. Simulated delay time [sec] in sections for current traffic situation](https://thumb-eu.123doks.com/thumbv2/123dok_br/18360682.354124/5.892.108.784.489.773/fig-simulated-delay-time-sections-current-traffic-situation.webp)
![Fig. 4. Simulated delay time [sec] in sections for the traffic situation with the public transport priority Rys](https://thumb-eu.123doks.com/thumbv2/123dok_br/18360682.354124/6.892.109.784.198.489/simulated-delay-sections-traffic-situation-public-transport-priority.webp)
