PARTICIPATORY MAPPING IN THE DESIGN PROCESS OF A
SPATIAL DATA INFRASTRUCTURE (SDI)
A case study in the Biosphere Reserve Rio Platano (Honduras)
PARTICIPATORY MAPPING IN THE DESIGN PROCESS OF A
SPATIAL DATA INFRASTRUCTURE (SDI)
A case study in the Biosphere Reserve Rio Platano (Honduras)
Dissertation supervised by
PhD. Professor Laura Díaz Sánchez Institute of New Images Technologies (INIT) University Jaume I, Castellón de la Plana, España
PhD. Professor Joaquín Huerta Guijarro Institute of New Images Technologies (INIT) University Jaume I, Castellón de la Plana, España
PhD. Professor Roberto Henriques Estatística e Gestão de Informação (ISEGI)
Universidade Nova, Lisboa, Portugal
Alberto Olivares Colás
PARTICIPATORY MAPPING IN THE DESIGN PROCESS OF A
SPATIAL DATA INFRASTRUCTURE (SDI)
PARTICIPATORY MAPPING IN THE DESIGN PROCESS OF A
SPATIAL DATA INFRASTRUCTURE (SDI)
A case study in the Biosphere Reserve Rio Platano (Honduras)
Dissertation supervised by
PhD. Professor Laura Díaz Sánchez Institute of New Images Technologies (INIT) University Jaume I, Castellón de la Plana, España
PhD. Professor Joaquín Huerta Guijarro Institute of New Images Technologies (INIT) University Jaume I, Castellón de la Plana, España
PhD. Professor Roberto Henriques Estatística e Gestão de Informação (ISEGI)
Universidade Nova, Lisboa, Portugal
ACKNOWLEDGMENTS
I would like to thank Professor Laura Díaz for her support and her good ideas when it was difficult for me to find the way.
Also, I would like to thank Professor Joaquin Huerta, Professor Roberto Henriques and Professor Ian Kramer for their advice.
Thanks, Dittmar Jenrich for your hospitality in the PROTEP project, explaining to me whatever information was necessary.
Thanks, Jorge Travieso for waking the interest in me for the life of the indigenous communities in Rio Platano and teaching me about their life style.
Thanks, Joe Ryan and Marco Rios for your patience, explaining to me the different aspects of SIMONI. Also thanks, to all the people of PROTEP project.
Thanks, Lorenz for being my friend and supporting me in this adventure.
Thanks, Moises, Carles, Bea, Oliver, Victor, Bruno for taking care of me those three months in Honduras and Nicaragua. Thanks also, all people I met in those countries.
Thanks, Andrew Thompson for your patience and support in my English adventure.
Thanks, Mario (Marius Lokust) for those afternoons where English was the excuse to talk about music. For sure it was the beginning of a big friendship.
Thanks, Sara, Sarah, Roberto, Joan, Kristinn, Luis, Esme, Diego, David, Stefan, Angelo, Ardit, Pamella, Diana, Helder, Neel, Agasha, Roya, Muhammad, Gulendam, Byniam, Shiuli, Asmamaw and Laura, for those days in Münster and Castellón.
Thanks, Olga, Luis, Marta, Akemi, Cristina, Alejandro, Pablo and all Rockville people for being there when it was necessary to stop for a moment.
Thanks, Dario, Alicia, Soriano, Lucia, Paula, Carlos, Begoña, Marcel, Ceci and all my friends for being a part of my life.
Thanks, Dad, Mum, Sister, and all my family for your support and your affection.
PARTICIPATORY MAPPING IN THE DESIGN PROCESS OF A
SPATIAL DATA INFRASTRUCTURE (SDI)
A case study in the Biosphere Reserve Rio Platano (Honduras)
ABSTRACT
In the recent years, the major production of cartographic information and the advancement of new Information Technologies (IT's) has brought with it the need to develop new storage and management tools, making access in a simpler way either alphanumeric or vector information.
Since the 60s, the processing, analysis and visualization of cartographic data has been carried out using GIS as desktop software, installed on a single computer. The advantage of this system was the possibility of combining different cartographic information thereby facilitating decision-making.
The need to share data, mainly cartographic information, between agents who are working in the same area has been the basis for the creation of Spatial Data Infrastructures (SDI) at global, national, regional ,local, or corporative level.
Therefore, the aim will be to have cartographic information updated and available for all the involved agents who are working in the same territory, which will result in sharing efforts and costs.
Nevertheless, the development of new technologies has had an effect where the cartographic data producers have less direct contact with the field, ignoring somehow the people living in it who are the ones with best knowledge of the territory.
In remote areas, where it is difficult to access such as the Rio Platano Biosphere Reserve Region (Honduras), it is indispensable to create an SDI for managing and sharing cartographic information by the involved agents in the territory.
It is important that the information offered by the indigenous communities is not left aside because they have a direct relation with the field. In the case of Rio Platano, they are scattered along the territory.
PARTICIPATORY MAPPING IN THE DESIGN PROCESS OF A
SPATIAL DATA INFRASTRUCTURE (SDI)
A case study in the Biosphere Reserve Rio Platano (Honduras)
ABSTRACT (Spanish)
El incremento en la producción de información cartográfica y el avance de las nuevas Tecnologías de la Información (IT´s) en los últimos años ha llevado aparejado la necesidad de desarrollar nuevas herramientas de almacenamiento y gestión, con las que acceder de una forma sencilla tanto a la información alfanumérica, como a la vectorial de la misma.
El tratamiento, análisis y visualización de la información cartográfica se ha venido realizando, desde la década de los 60, mediante la utilización de los Sistemas de Información Geográfica como software de escritorio, instalado en un único ordenador. Este sistema ofrecía como ventaja la posibilidad de combinar distinta información cartográfica facilitando de este modo la toma de decisiones.
La necesidad de compartir información, ya sea cartográfica o de cualquier otra materia, con agentes que estén trabajando en un mismo territorio, ha sido la base para la creación de las Infraestructuras de Datos Espaciales (IDE), tanto a nivel global, como nacional, regional, local, o corporativa.
dichos recursos como: software de publicación de datos cartográficos (Servidores de mapas), estándares de publicación, metadatos, marco legal, acuerdos entre organizaciones y creación de niveles de usuarios.
La finalidad, por tanto, será disponer de una información cartográfica lo más actualizada posible, accesible por todos los agentes que trabajan en un mismo territorio, compartiendo esfuerzos y costos.
Sin embargo, este desarrollo de nuevas tecnologías ha producido que los generadores de información cartográfica tengan menor relación directa con el territorio, obviando en ciertos momentos, que las personas que mejor lo conocen son los que habitan en cada lugar.
En áreas remotas y de difícil acceso como la Región de la Biosfera Rio Plátano (Honduras), se hace indispensable la creación de una IDE para gestionar y compartir información cartográfica por los agentes que trabajan en la misma. En la definición de la IDE se ha optado por no dejar de lado la información ofrecida por aquellos que conocen mejor el territorio, dominado por la presencia de pequeñas comunidades indígenas dispersas.
KEYWORDS
Participatory Mapping Participatory Pictogram Indigenous Communities
Spatial Data Infrastructure (SDI)
Spatial Database Management System (SDBMS) Map server
Geographic Information System (GIS) Cadaster
Socio-environmental indicators
KEYWORDS (Spanish)
Mapas Participativos Pictogramas Participativos Comunidades Indígenas
Infraestructura de Datos Espaciales (IDE) Sistema de Gestión de Bases de Datos (SGBD) Servidor de Mapas
Sistemas de Información Geográfica (SIG) Catastro
ACRONYMS
CONPAH– National Confederation of Indigenous People of Honduras CSW– Catalogue Service for the Web
DCMES– Dublin Core Metadata Element Set EU– European Union
FETRIPH– Confederation of Pech Indigenous communities of Honduras FGDC– Federal Geographic Data Committee
GIS– Geographic Information System GPS– Global Positioning Systems
GSDI– Global Spatial Data Infrastructure HTTP– Hypertext Transfer Protocol
ICDE– Colombian Spatial Data Infrastructure
ICF - National Institute for Forest Conservation and Development, Protected Areas and Wild Life
ICTs– Information and Communication Technologies IFAD– International Fund for Agricultural Development IGN– National Geographic Institute
IK– Indigenous Knowledge
IP – Institute of Property of Honduras IP– Internet Protocol
ISO – International Organization for Standardization IT– Information Technology
MASTA– Moskitia Alsa Takanka
MDGS– UN Millenium Development Goals MOPAWI– Moskitia Pawisa
NAD– Noth American Datum
NGOs– Non-Governmental Organization NSDI– National Spatial Data Infrastructure
OFRANEH– Honduran Black Fraternal Organization OGC– Open Geospatial Consortium
OSGEO– Open Source Geospatial Foundation PRA– Participatory Rural Appraisal
PAFID– Philippine Association for Intercultural Development PGIS– Participatory Geographic Information System
PROTEP– Land Use Planning and Environmental Protection Project P3DM– Participatory 3-D Modelling Mapping
RDBMS– Relational Database Management Systems RHBRP– Reserve of the Man and Rio Platano Biosphere SDBMS– Spatial DataBase Management System
SDE– Spatial Database Engine SDI– Spatial Data Infrastructure
SEGEPLAN– Secretariat of Planning and Programming of the Presidency SEPLAN– Ministry of Planning and External Cooperation
SIMONI– Integral Monitoring System
SINAPH– National Protected Areas System of Honduras SINIT– National Land Information System
SLD– Style Layer Descriptor SQL – Structured Query Language SURE– Unified Registry System UK– United Kingdom
UML – Unified Modelling Language UN– United Nations
UNESCO– United Nations Educational, Scientific and Cultural Organization USA– United States of America
VGI– Volunteered Geographic Information WCS– Web Coverage Service
WFS– Web Feature Service WGS – World Geodetic System WMS– Web Map Service WPS– Web Processing Service
WSIS– World Summit on the Information Society WWW– World Wide Web
INDEX OF THE TEXT
1.
INTRODUCTION ... 1
1.1.Theoretical Framework ... 1
1.2.Motivation... 3
1.3.Research Objectives ... 4
1.4.Research Questions ... 5
1.5.Thesis Structure... 5
2.
STATE OF THE ART ... 8
2.1.Why participation of the indigenous communities?... 8
2.2.Participatory Mapping ... 8
2.2.1. Indigenous knowledge ... 9
2.2.2. Participatory Rural Appraisal. A bit of History ... 10
2.2.3. Participatory Mapping projects in Rio Platano Region ... 11
2.2.4. Purposes and Uses ... 13
2.2.5. Methodology ... 14
2.2.6. Relation between GIS and Participatory mapping ... 17
2.3.Spatial Data Infrastructure (SDI) ... 19
2.3.2. Components of the SDI ... 22
2.3.3. Standards and Regulations for management of Geographic Information ... 23
3.
CONCEPTUALISATION. NECESSITIES OF THE PROJECT28
3.1.Context scenario ... 283.2.Necessity to share information... 29
3.3.Necessities of the new Platform ... 30
3.4.Conceptual development ... 31
4.
STUDY AREA AND DATA... 33
4.1.Study Area ... 33
4.2.Data ... 36
4.2.1. Digital Cartography ... 36
4.2.2. Metadata and Reference system ... 39
5.
INDIGENOUS
COMMUNITIES
CARTOGRAPHIC
INTEGRATION PROCESS ... 40
5.1.Cartographic integration process of the land use rights ... 40
5.1.1. Indigenous communities land rights... 40
5.1.2. Indigenous communities organizations ... 41
5.1.5. Conversion process from Participatory Mapping to Digital Cartography ... 47
5.2.Cartographic integration process in the SIMONI “Integral Monitoring System”50
6.
SPATIAL DATABASE MANAGEMENT SYSTEM (SDBMS)54
6.1.Purpose of SDBMS and available data sources ... 556.2.Potential Users ... 55
6.3.Organizational structure or data model ... 57
6.3.1. Cadastral Database ... 57
6.3.2. Socio-environmental Information Database ... 57
6.3.3. SIMONI Database ... 58
7.
DESIGN PROCESS OF THE RIO PLATANO REGION
SPATIAL DATA INFRASTRUCTURE (SDI) ... 59
7.1.Rio Platano SDI as a Regional Nodo ... 59
7.2.Components of the SDI ... 60
7.3.Client-Server Model ... 60
7.4.Geoportal Design. Service Structure ... 61
7.5.Involved agents. From the Global one to the indigenous communities ... 62
7.6.Policies and Agreements ... 63
7.7.Rio Platano Region Map server ... 63
7.7.2. Map server software comparison ... 64
7.7.3. OpenGeo suite... 65
7.7.4. Publishing Indigenous communities cartographic information ... 69
7.8.Metadata Service ... 69
7.9.Rio Platano Region metadata service ... 71
8.
EVALUATION ... 72
9.
CONCLUSION ... 74
9.1.Research Objectives ... 74
9.2.Research Questions ... 75
9.3.Future in the Rio Platano Region SDI ... 76
Bibliography ... 77
Annex 1. Prototype design and interviews ... 84
Annex 2. Digital Cartography List and Spatial Database
Management System (SDBMS) ... 96
Annex 3. Involved agents ... 99
Annex 4. Geoportal - Map server captures ...101
Annex 5. SLD file...105
INDEX OF TABLES
Table 1. Adaptation from the World Bank document ... 10
Table 2. Pictograms used in the Land Use study (P.Herlihy, 1998) ... 13
Table 3. Metadata Core ISO 19115. ... 25
Table 4. Metadata Element Set. (Dublin Core, 2013) ... 26
Table 5. Methodology to define the cadastral boundaries ... 44
Table 6. List of digital participatory pictograms... 49
Table 7. Possible “incidence participatory pictograms” in SIMONI ... 52
Table 8. Users and Permission in the Cadastral Database ... 56
Table 9. Users and Permission in the Socio-environmental Database ... 56
Table 10. Users and Permission in the SIMONI Database... 56
INDEX OF FIGURES
Figure 1. Three pilars of PRA. (Chambers, 1997) ... 11
Figure 2. Land use for the indigenous communities in Rio Platano Region (P. Herlihy, 1998) ... 12
Figure 3. Images of participatory map methodologies ... 17
Figure 4. Diagram of the three dimensions of paired attributes shared by GIS and participatory mapping (Vajjhala, 2005) ... 19
Figure 5. Diagrammatic View of the INSPIRE Vision (Inspire, 2013) ... 20
Figure 6. Location of the project ... 33
Figure 7. Municipalities in Rio Platano ... 34
Figure 8. Distribution of the ethnics ... 34
Figure 9. Sub-zones Biosphere Reserve ... 38
Figure 10. Indigenous communities organizations in Rio Platano ... 41
Figure 11. Preliminary study about the indigenous community hierarchy... 45
Figure 12. Functional Habitat design. Draw Process ... 46
Figure 13. Validation process ... 46
Figure 14. Meeting to establish the Cadastral boundaries ... 47
Figure 16. Add "fish area "Participatory pictogram to QuantumGIS icons ... 49
Figure 17. a) Functional Habitat of two neighbouring communities. ... 50
Figure 18. Add "jaguar killing" pictogram to QuantumGIS icons... 53
Figure 19. QuantumGIS view with punctual incidence icons ... 53
Figure 20. Database management ... 55
Figure 21. Cadastral Database schemas ... 57
Figure 22. Nodo structure in SDI levels ... 59
Figure 23. Rio Platano SDI components ... 60
Figure 24. Architecture Model Client/Server ... 61
Figure 25. Publishing process through Geoserver ... 67
1.
INTRODUCTION
1.1.
Theoretical Framework
‘‘Geospatial data’’ means information that identifies the geographic location and characteristics of natural or constructed features and boundaries on the earth. This information may be derived from, among other things, remote sensing, mapping, and surveying technologies. Statistical data may be included in this definition at the discretion of the collecting agency (Presidential Documents Executive Order 12906, 1994).
This document was the first to talk about the cooperation between the different
agencies in the U.S.A. regarding “Geospatial data” and the way of obtaining it. It
was the basis for developing the Spatial Data Infrastructure of the country.
The term Spatial Data Infrastructure (SDI) is often used to denote the relevant base collection of technologies, policies and institutional arrangements that facilitate the availability of and access to spatial data. The SDI provides a basis for spatial data discovery, evaluation, and the application for users and providers within all levels of government, the commercial sector, the non-profit sector, academia and by citizens in general (Global Spatial Data Infrastructure, 2004).
The Region of Rio Platano is a huge extension of forest composed of five municipalities. The low level of development of the whole region, where communication is through unpaved roads, is the main cause of the isolation of the area from Tegucigalpa (capital of Honduras).
Furthermore this situation is exacerbated by the lack of coordination among organizations working in the study area. Municipalities and ICF offices "National Institute for Forest Conservation and Development, Protected Areas and Wild Life"
In these cases, the relationship between the municipal technicians and the indigenous communities who are living in the remote areas of Rio Platano becomes important. The role of the citizens is vital to feed Geospatial data to those remote areas, since they are the ones with the best knowledge of the territory.
Therefore, it is important to obtain relevant cartographic information from different sources in all levels of knowledge from the International cartographic servers to the small communities. The ideal situation would be that all the organizations working in the Region were well organized, and the Geospatial data were obtained from all the different levels of the society.
This Thesis will be framed within the “Land Use Planning and Environmental Protection Project” (PROTEP) in Rio Platano. This project has been developed through bilateral cooperation between Honduras and Germany, and is executed by the ICF. The KfW-Entwicklungsbank is the funding organization for the project and the GFA-Consulting group provides technical assistance.
PROTEP's activities are directed towards improving the management and
protection of natural resources in the “Río Platano Region” Reserve and its buffer
zones. The project implementation began in May 2010 as a continuation of a previous process of land tenancy regulation and cadastral establishment in the reserve. The project emphasizes their actions in the framework of support for land management at the community level.
Rio Platano is a protected area, where small isolated indigenous communities are scattered throughout the territory. As previously mentioned, the information obtained from these communities will be of vital importance to feed the Spatial Data Infrastructure of the Region with cartographic information.
popular in developed countries. Nevertheless, how can indigenous communities, provide cartographic information without an internet connection?
There are different tools used in the obtaining of data from the indigenous
communities, but the most used one is “Participatory mapping”; which is in its
broadest sense, the creation of maps by local communities – often with the involvement of supporting organizations including governments (at various levels), non-governmental organizations (NGOs), universities and other agents engaged in development and land-related planning (International Fund for Agricultural Development (IFAD), 2009).
The methodology used in order to obtain cartographic information from the indigenous communities using Participatory mapping and the inclusion of that information to the structure of the SDI of Rio Platano will be the backbone of this thesis.
1.2.
Motivation
The great amount of cartographic information generated by all the different sources has provoked a hardship in maintaining all this information in a well-organized fashion. The organizations in the study area must coordinate and share all sorts of information, mainly cartographic data. This is the base for the progress and development of the projects carried out, focusing on the global knowledge and better planning of the region.
Rio Platano Region is a vast area, where communication is difficult, due to the terrain since it is very abrupt and the roads are not in a good condition. This structure of the area causes that the information between different organizations and people working in the study area to not flow easily.
The methodology used to obtain relevant information from indigenous communities with participatory mapping processes is considered an important point for obtaining a good real knowledge of the area. Their contribution using maps with pictograms, showing the different aspects of the territory, will be necessary to feed the cartographic data of the Spatial Data Infrastructure of the Rio Platano Region.
Therefore, obtaining such information from indigenous communities and its conversion to digital format using Geographic Information System (GIS) is essential for the establishment of cadastral boundaries and socio-environmental information with a great relation to the ground physical level.
This research proposes to develop a methodology to include the information obtained from the indigenous communities regarding cadastral boundaries and socio-environmental information using Participatory mapping tools aiming to feed the Spatial Data Infrastructure proposed for the Rio Platano Region, and coordinate it with the information related to the other organisms.
1.3.
Research Objectives
The different objectives of the thesis after studying the necessities of the project are:
Design the methodology to obtain information from the indigenous communities.
Design the methodology for the extraction of the cadastral information in the indigenous areas.
Design the methodology for the extraction of the information regarding socio-environmental aspects.
Methodology of the digitalization to include the obtained information in the structure of the PROTEP cartography.
office, ICF offices, Municipalities, other agencies in the area, inhabitants and indigenous communities).
Design the methodology to share all the available information with the different agents and all the people interested in the Rio Platano Region.
1.4.
Research Questions
1. How can we include the information of the people who have better knowledge of the territory (indigenous communities)?
2. How is it possible to measure the quality of this information?
3. How can the obtained information from the indigenous communities be important to acquire a better knowledge of the territory?
4. How can all the available information in PROTEP project be organized in a SDI?
5. How can PROTEP project share the available information with the
different municipalities, ICF offices “National Institute of Forest Conservation and Development, Protected Areas and Wild Life”, and the
people interested in Rio Platano Region?
1.5.
Thesis Structure
This thesis is divided in nine chapters. The first chapter is a general description of the actual scenario in the Rio Platano Region regarding the availability of the cartographic information and the motivation of creating a SDI in the region including the information obtained from the indigenous communities using Participatory mapping techniques.
Chapter 2. State of the Art, is an overview of the actual situation in
Chapter 3. Conceptualisation. Necessities of the project. After several
interviews with the people who are working in the project, it is possible to gather the weak points from the actual situation for sharing cartographic information. Analysing that information obtained from them; the Geoportal interaction prototype of the Spatial Data Infrastructure of the Rio Platano Region with the different services is developed. In addition to the design of the main page, the necessity to include the information obtained from the indigenous communities is considered essential for the good knowledge of the territory after the interviews with the people selected for the interviews in the PROTEP project.
Chapter 4. Study Area and Data, is a brief geographic description of the Rio
Platano Region and an overview of the available data published by different agencies which are working in the area and its characteristics of production.
Chapter 5. Indigenous communities Cartographic integration process.
Designing the methodology to include the information from the indigenous communities in a Geographic Information System. After several meetings with the selected people in each community a few number of pictograms for the collection of different information as boundaries for the cadastral registration and biological aspects are designed (hunt areas, fishing areas, agriculture areas, etc.) in QuantumGIS. Also, the first steps of the methodology for feeding the SIMONI (Integral Monitoring System) which is being developed in this moment in the PROTEP project are designed.
Chapter 6, Spatial Database Management System (SDBMS), is a description of
the different databases created for the management of the digital cartography. It is included the data model designed for the use in PostgreSQL/PostGIS regarding cadastral and socio-environmental information and the definition of the different user levels for accessing to the cartographic information.
Chapter 7. Design process of the SDI. Gathering the information from the
SDI is designed. The Geoportal is the reference of the Rio Platano Region regarding the cartographic information. It is possible to check all available cartographic information from the different involved agents in the area. Besides, the potential clients of the Geoportal obtain information from all level and with the sources, from indigenous communities to an international map server such as Google or OpenStreetMap. From this platform, it is possible to obtain general information from the Rio Platano Region and PROTEP project, contact with all the agents working in the area and consult the metadata, agreements and laws regarding the cartographic information.
Chapter 8. Evaluation. Describes the situation in the region after the
deployment of the platform with the inclusion of cartographic information from the indigenous communities. The level of cartographic knowledge of the area has improved. The relationship between all agents is the key for sharing and increasing the cartographic value of this remote protected area.
Chapter 9. Conclusion. This final chapter is focused on taking a look back in
2.
STATE OF THE ART
2.1.
Why participation of the indigenous communities?
The major reasons for emphasizing participation of the indigenous communities are as follows (Narayanasamy, N., 2009):
Participation results in better decisions.
People are more likely to implement the decisions that they made themselves rather than the decisions imposed on them from above.
Motivation is frequently enhanced by setting up of goals during the participatory decision-making process.
Participation improves communication and cooperation (Locke, E., 1968). People may learn new skills through participation; leadership potential
may be readily identified and developed (Heller et al., 1998).
2.2.
Participatory Mapping
“Maps are more than pieces of paper. They are stories, conversations, lives and
songs lived out in a place and are inseparable from the political and cultural contexts in which they are used.” (Warren, 2004).
Participatory mapping is, in its broadest sense, the creation of maps by local communities – often with the involvement of supporting organizations including governments (at various levels), non-governmental organizations (NGOs), universities and other actors engaged in development and land-related planning (International Fund for Agricultural Development (IFAD), 2009).
2.2.1. Indigenous knowledge
Herbal medicine is a good example of Indigenous Knowledge. It is the basis for local decision-making in agriculture, health, natural resources management and other activities. Indigenous Knowledge is unique to a particular culture and society (World Bank, 1998).
The knowledge of the Indigenous communities is crucial to understand the territory where they are located. Learning from them in an investigating process will provide us important information about what they have and what they know.
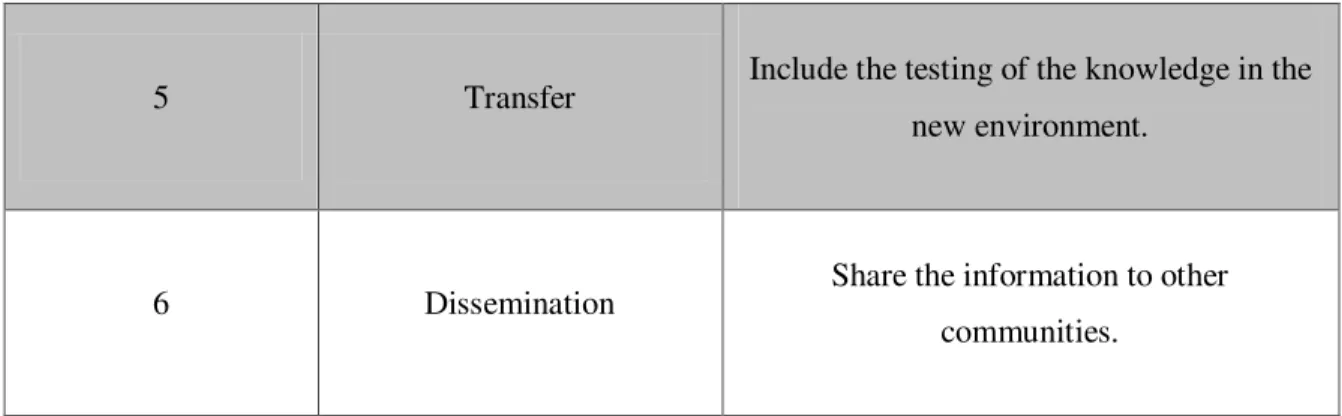
The integration process of this knowledge obtained from the indigenous communities is essential for sharing information in the Rio Platano Region. The process for including it is composed by different steps according to the World Bank:
Step Number Step Name Definition
1 Recognition and
Identification Identification by external observers.
2 Validation Assessment of Indigenous Knowledge
significance and relevance.
3 Recording and
Documentation
Is the major challenge, because of the tacit nature of Indigenous knowledge (typically
exchanged through personal communication).
5 Transfer Include the testing of the knowledge in the new environment.
6 Dissemination Share the information to other
communities.
Table 1. Adaptation from the World Bank document
2.2.2. Participatory Rural Appraisal. A bit of History
Mapping is a fundamental way for displaying human spatial cognition. The representation of the territory by local people has been done in different ways since prehistoric societies. Some remarkable examples are shown in the delightful book
“Maps are Territories” (Turnbull, 1989). The earliest is a wall painting dating to 6,200 BC, from Catal Huyuk (Chambers, 2006).
The participatory mapping started in the late 1980s during the evolution of the
“Participatory Rural Appraisal” (PRA) using Sketch mapping tools and scale mappings. The situation changed in the 1990s, with the diffusion of Geographic Information Systems (GIS), Global Positioning Systems (GPS), and the open access to data via internet (Rambaldi, 2004).
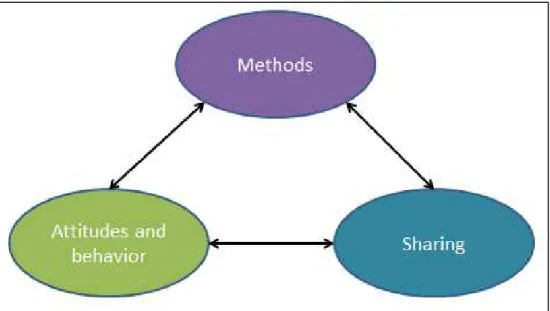
By the early 1990s, three core components had emerged which can be said to constitute PRA: methods, behaviour and attitudes, and sharing (Mascarenhas et al, 1991). PRA methods are "visual and tangible and usually performed by small groups" and the maps created can be "social or census, showing people and their characteristics, resource maps showing land, trees, water and so on, and mobility
maps showing where people travel for services" (Chambers, 2008).
were used to monitor and evaluate the projects. It has been known as participatory monitoring and evaluation (Narayanasamy, N., 2009).
Figure 1. Three pilars of PRA. (Chambers, 1997)
Indigenous and peasant societies in Latin America and the social scientists working with them began to harness the powers of mapping in the 1990s. Nongovernmental organizations (NGOs) became widespread actors in indigenous regions in the previous decade, but by 1990 indigenous organizations had begun to organize national-level movements throughout the region (Brysk, 2000; Dean and Levi, 2003; Maybury-Lewis, 2002).
2.2.3. Participatory Mapping projects in Rio Platano Region
Funded by the Honduran and German governments, a geographer of the University of Kansas, Peter Herlihy and a team of researchers and local surveyors used participatory mapping to design a zoning and management system for the residents of the Rio Platano Biosphere Reserve in 2001 (Herlihy and Knapp, 2003).
Figure 2. Land use for the indigenous communities in Rio Platano Region (P. Herlihy, 1998)
These were the pictograms used for describing the land use of the different indigenous communities in the Rio Platano Region:
Pictogram Land Use
Agricultural
Trees for canoes
Hunting
Collection of fruits, medicines and craft supplies
Material construction/Wood
Wood for sale
Natural Area for protection
Fish area
Sacred site
Touristic Place
Table 2. Pictograms used in the Land Use study (P.Herlihy, 1998)
This document was the basis for the design of the Participatory Mapping methodology for the definition of the cadastral boundaries in the PROTEP project, this information will be included in the future in the Rio Platano Geoportal after the approval of the Institute of Property (IP). The methodology for obtaining these limits
is explained in section 5. “Indigenous communities cartographic integration process”
of this master´s thesis.
2.2.4. Purposes and Uses
Participatory mapping has been developed for different purposes. Some examples are (International Fund for Agricultural Development (IFAD), 2009):
Land use planning: Describes a participatory land use planning process initiated in a number of villages in Mae Hong Song province, Thailand (Puginier ,2001).
Historical mapping: Mapping ancestral domains in Northern Mindanao (a PAFID-IPAD project).
Social mapping: Create census using participatory mapping.
Health mapping: Using participatory mapping to show the location and concentrations of breast cancer for women.
Mobility mapping: Maps showing the functional habitat of the indigenous communities. Who goes where for what and how often?
Education: Showing the variation in didactic styles. Water and sanitation: Mapping areas of open defecation. Farm mapping: Study of the soil conditions within the farm.
This relation is only a small list of possible purposes and uses, but it could be extended further. The International Fun for Agricultural Development (IFAD)
identifies six broad purposes for initiating a participatory mapping project:
1. To help communities articulate and communicate spatial knowledge to external agencies.
2. To allow communities to record and archive local knowledge.
3. To assist communities in land-use planning and resource management. 4. To enable communities to advocate for change.
5. To increase the capacity for sharing ideas within communities.
6. To address resources-related conflict. Participatory mapping can be used to manage conflicts between a community and outsiders and to address internal conflicts.
2.2.5. Methodology
In the incredible book “Rural development –Putting the last first”, written by Robert Chambers in 1983, the author identifies six methods which define with the
term “Reversals in learning” (Chambers, 1983):
1. Sitting, asking, and learning 2. Learning from the poorest
3.2. Games, quantification and ranking
4. Joint Researcher and communities in their fields and under their conditions 5. Learning by working
6. Simulation games
The methodology to obtain cartographic information from the indigenous communities has changed over the past years to start incorporating new technologies. In the next sections it is possible to identify some of them described by the IFAD in
the publication “Good practices in participatory mapping” (International Fund for Agricultural Development (IFAD), 2009):
Ground Mapping: A basis mapping method that involves community members drawing maps on the ground from memory using any available materials, such as plants, rocks, or household tools. The final product is kept for a short time only.
Sketch mapping: They are drawn on large pieces of paper and from memory. The represent the land from a bird´s eye view. They involve drawing key community-identify features. They do not rely on exact measurements, and do not use a consistent scale and geo-referencing. Transect mapping: A spatial cross-section community, depicting
geographic features (e.g. infrastructures, local markets, and schools) as well as land use types and vegetation zones observed along an imaginary line.
Scale mapping – drawing information on existing scale maps: This method is commonly used where accurate and affordable scale maps are available. Local knowledge is gathered in conversation around a map and is then drawn directly upon the map. The position of features is determined by looking at their position relative to natural landmarks (e.g. rivers, mountains, lakes).
used to incorporate and communicate local spatial knowledge. This is often a last resort measure because the time and energy required to create a scale map from scratch is considerable.
Participatory 3-D modelling mapping: P3DM are stand-alone scale relief models created from the template of a cartographic maps. Pieces of cardboard are cut in the shape of the contour lines and pasted on top of each other. Geographic features are depicted on the model using pushpins (for points), coloured string (for lines), and paint (for areas).
GPS mapping: Use to capture and store geographic coordinates related to local features (e.g. boundaries or point locations) and then locate these points on accurate scale maps.
Aerial and Remote sensing images: Good format to communicate community information to decision-makers because it uses cartographic protocols. The problem is that it can be expensive and images are not readily available.
Multimedia mapping: Interactive, computer-based maps that link digital video, photos and written text with maps. This method is expensive for many communities and training is needed to understand the equipment as well as cartographic protocols.
Participatory Geographic Information System (PGIS): Participatory GIS are computer-based systems that capture, manage, analyse, store and present geo-referenced spatial information. This method is also expensive for many communities and training is needed to understand the equipment as well as cartographic protocols.
Internet-based mapping: It is the newest arena for participatory mapping initiatives. These interactive maps allow users to click on map features in order to access other multimedia information. This method requires high speed internet access. This remains a challenge for many developing countries outside of urban area.
Ground Mapping Participatory 3-D modelling mapping
Sketch Mapping Aerial and Remote sensing images
Figure 3. Images of participatory map methodologies
2.2.6. Relation between GIS and Participatory mapping
It is fairly evident that geographic information systems (GIS) and geospatial technologies has become an important decision-making tool for local communities. For example, geospatial visualization techniques can be used to show the current and future situations of the communities in a more intuitive and realistic way (Pleizier et al, 2004).
The spatial analytical capabilities of GIS can assist local committees in understanding the nature of community issues and making better decisions.
However, it has been well recognized that “traditional GIS methodologies often
An important recent development in community-based GIS has been the recognition of the need and the power to enlarge the level of community involvement in spatial decision-making processes (Barton et al., 2005) since “the complexity of modern society cannot be managed – even at the local level – without the direct involvement of all the components of the society” (Yu and Cai, 2009).
Recent decades have seen significant changes in both local and global development planning efforts. Community-based organizations and advocacy groups around the world have advanced the concept of “environmental justice” and issued
calls for more inclusive dialogues among planners and local stakeholders. At the same time, research on sustainable practices has emphasized the importance of
“resident experts” in implementing environmentally-sound development decisions.
In response to this concurrent international emphasis on stakeholder consensus and indigenous knowledge, public and community participation have moved to the forefront of both large- and small-scale development and environmental agendas (Stiglitz, 2002).
The transformation of development priorities and practices has drawn widespread attention to a variety of information and communication technologies (ICTs) for their potential to facilitate participatory development that is both inclusive and environmentally-sensitive. The international demand for these technologies is evident in initiatives, such as the UN Millennium Development Goals (MDGs) and the World Summit on the Information Society (WSIS), which emphasize that effective development depends on equitable information access and global knowledge sharing (United Nations, 2000; WSIS, 2003).
the three dimensions focus primarily on the issues surrounding how people live and
are connected more strongly to participatory mapping. The dimensions on the right side characterize where people live and are more strongly associated with GIS. The
combination of GIS and participatory maps into participatory digital mapping at the center of the figure seeks to balance these attributes and create a dynamic equilibrium across all three dimensions (Vajjhala, 2005)
Figure 4. Diagram of the three dimensions of paired attributes shared by GIS and participatory mapping (Vajjhala, 2005)
2.3.
Spatial Data Infrastructure (SDI)
The need of geographic information for almost every human activity has led to an enormous struggle for its recording, storage, treatment, analysis and visualization. Cartography, and its most known product, maps, has been the traditional answer to the disposition of an idea, in smaller scale, of the reality that occurs in a territory (Rodriguez and Bernabé, 2012).
2.3.1. SDI around the world
The Presidential Document of the U.S.A. “Executive Order 12906 of April
11, 1994” pointed the necessity to create a coordination of the Geographic Data. The aim of this order was “to implement the recommendations of the National Performance Review; to advance the goals of the National Information
Infrastructure; and to avoid wasteful duplication of effort and promote effective and
economical management of resources by Federal, State, local, and tribal
governments” (Presidential Documents Executive Order 12906, 1994).
The United States National Spatial Data Infrastructure (NSDI) started in 1994. It is considered the first SDI concept created from the basis of the Presidential Document. “The NSDI is seen as the technology, policies, criteria, standards and people necessary to promote geospatial data sharing throughout all levels of
government, the private and non-profit sectors, and academia. It provides a base or
structure of practices and relationships among data producers and users that
facilitates data sharing and use. It is a set of actions and new ways of accessing,
sharing and using geographic data that enables far more comprehensive analysis of
data to help decision-makers choose the best course(s) of action” (Federal
Geographic Data Committee, 2013).
In Europe INSPIRE was the initiative which developed the idea of SDI. The INSPIRE directive came into being on May 15 2007 and has been implemented in several stages, with full deployment required by 2019. The INSPIRE directive aims to create a European Union (EU) Spatial Data Infrastructure, enabling the sharing of environmental spatial information among public sector organizations and to better facilitate public access to spatial information across Europe. The European Spatial Data Infrastructure allows assistance in policy-making across boundaries and agencies. Therefore the spatial information considered under the directive is extensive and includes a great variety of topical and technical themes. INSPIRE is structured in seven chapters: 1) General provisions 2) Metadata 3) Data interoperability 4) network services 5) harmonization and data reuse 6) coordination and complementary measures and 7) final dispositions (INSPIRE, 2013).
Colombia was the first country to develop a SDI in Latin America. The Colombian Spatial Data Infrastructure-ICDE began in 1996 as a mechanism to coordinate efforts of producers and users of geographic information, with the aim of optimizing their production, managing all the data, and accessing through the use standards and information technology. In 2000, eight institutions came together to create the Basic Agreements for establishing and promoting the development of ICDE as the sum of policies, standards, organizations and technology resources that facilitate the production, access and use of the geographic information in all the country. Services available from the ICDE include location services, map view services, and download services, transformation services and service access to spatial data. The services agree on the international standards established in the ISO TC211 Committee and the OGC (Colombian Spatial Data Infrastructure, 2012).
Regarding Central America, Guatemala is the country with the most developed SDI. The initiative to create the SINIT “National Land Information System” was developed based on the Land Use Planning law of 2009. In this law, SINIT was defined as the instrument that contains and organizes all alphanumeric and cartographic information. SINIT published different topographic, agricultural, statistical and thematic information managed by SEGEPLAN “Secretariat of Planning and Programming of the Presidency” (SEGEPLAN, 2013).
2.3.2. Components of the SDI
In any spatial and thematic area of a SDI (besides of the geographic component that consists of data, data descriptors -metadata-, and services), a key
part is the “organization”. It is responsible for ordering and defining the structure and harmonizing the rest components of a SDI in order to work in an efficient way. The organization includes a political component:
Creating a collective organism, composed of all the involved actors in the project.
The adoption of an appropriate legal framework.
The definition of agreements, alliances and partnerships necessary for the availability of spatial data and services.
Establishing agreements between the producers to coordinate the generation and maintenance of geographic information.
A technology component should be defined, which will be able to:
To establish standards and regulations necessary for the interoperability. To coordinate tools and mechanisms for searching, consulting, and using
geographic data.
2.3.3. Standards and Regulations for management of Geographic Information
2.3.3.1. Interoperability
Interoperability is the capability to communicate, execute programs, or transfer data among various functional units in a manner that requires the user to have little or no knowledge of the unique characteristics of those units (ISO 2382-1, 1993).
In a SDI, interoperability is the definition for the communication among the involved agencies in a coordinated way and using the same semantic. The interoperability enables the involved agencies to be able to share in a coordinated form: Business Agreements, Policy Framework, Incentives to cooperate, Business Models, Infrastructure, Networks, Support for multiple (Languages, Customs, Views, Data Formats, Projections, Datums), Shared Best Practices, Metadata and Standards.
In the GIS field, it is possible to find some organizations that are developing software and standards to help in the process of sharing cartographic information:
The Open Geospatial Consortium (OGC) is an international industry consortium of 482 companies, government agencies and universities participating in a consensus process to develop publicly available interface standards. OGC Standards support interoperable solutions that "geo-enable" the Web, wireless and location-based services and mainstream IT. The standards empower technology developers to make complex spatial information and services accessible and useful with all kinds of applications (Open Geospatial Consortium (OGC), 2013).
contributions will be maintained for public benefit. OSGeo also serves as an outreach and advocacy organization for the open source geospatial community, and provides a common forum and shared infrastructure for improving cross-project collaboration (Open Source Geospatial Foundation (OSGeo), 2013).
2.3.3.2. Metadata
A metadata record is a file of information, usually presented as an Extensible Markup Language (XML) document, which captures the basic characteristics of a data or information resource. It represents the who, what, when, where, why and how
of the resource. Geospatial metadata commonly document geographic digital data such as Geographic Information System (GIS) files, geospatial databases, and earth imagery but can also be used to document geospatial resources including data catalogs, mapping applications, data models and related websites. Metadata records include core library catalog elements such as Title, Abstract, and Publication Data; geographic elements such as Geographic Extent and Projection Information; and database elements such as Attribute Label Definitions and Attribute Domain Values (Federal Geographic Data Committee, 2013).
There are significant benefits to use metadata in the generated cartography (Global Spatial Data Infrastructure, 2004):
Metadata helps organize and maintain an organization’s investment in data and provides information about an organization’s data holdings in
catalogue form.
Coordinated metadata development avoids duplication of effort by ensuring the organization is aware of the existence of data sets.
Users can locate all available geospatial and associated data relevant to an area of interest.
Reporting of descriptive metadata promotes the availability of geospatial data beyond the traditional geospatial community.
Data providers are able to advertise and promote the availability of their data and potentially link to on line services (e.g. text reports, images, web mapping and ecommerce) that relate to their specific data sets.
The most used metadata standards are the developed by the ISO and the Dublin Core:
ISO 19115: The 211 ISO technic commit developed the international norm
ISO 19115:2003 “Geographic Information. Metadata”. This norm provides
a model and establishes a common framework of terminology, definitions, and procedures of application for describing the obtained Geographic Information. The norm presents a metadata model described in a Unified Modeling Language (UML) where each package defines different metadata entities.
The Core of the ISO 19915 is formed by the next elements defined by Compulsory (C), Optional (O) and Conditional (Co):
Set Data Title (C) Spatial Representation type (O) Data Reference Date (C) Reference System (O)
Responsible of the data (O) Lineage (O)
Geographic location (Co) Metadata file identification (O) Data language (C) Metadata Norm name (O) Character set data (Co) Metadata norm version (O) Category of data issue (C) Metadata language (Co)
Data Resolution (O) Character set of the metadata (Co) Data Summary (C) Contact point of the metadata (C) Distribution format (O) Creation Data of the metadata (C) Additional information (O)
Table 3. Metadata Core ISO 19115.
ISO 19139: provides the XML implementation schema for ISO 19115 specifying the metadata record format and may be used to describe, validate, and exchange geospatial metadata prepared in XML.
the description resources helping the user to find in an easy and efficient way the information of the data (Duval et al. 2002). The Simple Dublin Core Metadata Element Set (DCMES) consists of 15 metadata elements:
1. Title 2. Creator
3. Subject 4. Description
5. Publisher 6. Contributor
7. Date 8. Type
9. Format 10. Identifier
11. Source 12. Language
13. Relation 14. Coverage
15. Rights
Table 4. Metadata Element Set. (Dublin Core, 2013)
2.3.3.3. Geo-services
The Open Geospatial Consortium has defined different Geo-services standards for delivering the Cartographic Information (Open Geospatial Consortium (OGC), 2013):
Web Map Service (WMS): provides a simple HTTP interface for requesting geo-registered map images from one or more distributed geospatial databases. A WMS request defines the geographic layer(s) and area of interest to be processed. The response to the request is one or more geo-registered map images (returned as JPEG, PNG, etc) that can be displayed in a browser application. The interface also supports the ability to specify whether the returned images should be transparent so that layers from multiple servers can be overlain.
Web Feature Service (WFS): defines an interface for specifying requests for retrieving geographic features across the Web using platform-independent calls. The WFS standard defines interfaces and operations for data access and manipulation on a set of geographic features.
photos, digital elevation data, and other phenomena represented by values at each measurement point.
3.
CONCEPTUALISATION. NECESSITIES OF THE
PROJECT
3.1.
Context scenario
The study of the Biosphere Reserve Rio Platano (Honduras) involves many different agents to be considered: agency which develops the cadastral and the main environmental information, municipalities, different agencies regarding environmental and social aspects, inhabitants and indigenous of the study area. Also the involved agents are composed by different services which developed an important library of information. This information can be divided in 4 different groups: Cartography, agreements, laws, and metadata.
This kind of project develops an important collection of cartographic information divided in different categories: cadastre, environment, hydrology, transportation, land use, digital images, etc. For the agencies involved in the project the availability of information about the study area is important for knowing the territory and making good decisions.
Also, The Land Use Planning and Environmental Protection Project”
(PROTEP) is developing the “Integral Monitoring System” (SIMONI), which is a comprehensive monitoring system whose main objective is to provide a platform that can measure the management effectiveness of the Reserve of the Man and Rio Platano Biosphere (RHBRP). The final objective is to contribute to the sustainable use within the RHBRP.
The SIMONI has three strategic objectives:
Strategic Objective 1: Systematize and integrate different monitoring
Strategic Objective 2: Create a monitoring system with the ability to measure
the state, pressure, response and impacts within the socio-cultural and biological-ecological aspects in five different eco-regions of the RHBRP.
Strategic Objective 3: Create a monitoring system that integrates the needs of
beneficiaries RHBRP, as decision makers, NGOs, scientists and technicians in order to promote a comprehensive vision which establishes a series of coordinated actions that contribute to the sustainable management of RHBRP.
3.2.
Necessity to share information
Through a complete interview with two members of the agency (Annex 1) in which the PROTEP project is developing, it was possible to take a general overview of the process to access the cartographic information and the different aspects to be considered for the decision making.
The main points from the interviews, which are included below explain the necessity to create a platform for sharing information between all the involved agents whom are working in the Rio Platano area. This also includes the information obtained from the indigenous communities:
“In this moment is very difficult to share information between the project office and the municipalities. Our people travel to the study area at least twice per
month but their task is not to bring the updated information. So, the actual situation is not ideal, because municipalities don´t have the updated information.”
“For me, it would be important that I and all the people involved in the project could have access to all the available information in an easier and more accessible
way. Also, we have to find the way to include the information obtained from the indigenous communities in the project.”
“We are defining the web page of SIMONI. We have designed a web page where it is very easy to feed the SIMONI with socio-environmental indexes and
information in a map for making decisions. Also, we have to find a solution for
sharing this information with the ICF (National Institute of Forest Conservation and
Development, Protected Areas and Wild Life) offices in the area, the municipalities and other agencies which are developing projects in Rio Platano.”
“To feed the SIMONI is important the information provided by different agents, municipalities, ICF agencies, inhabitants of the area, and the indigenous communities of Rio Platano.”.
3.3.
Necessities of the new Platform
The process of creating information is more than simply collecting and storing data on a hard drive. The process needs to include the knowledge to create a good data model, where the information will be structured and it will be possible to retrieve information about this data (i.e. metadata). The proposed platform should enable the user to select the information needed by filtering information that defines the different aspects of the project.
To clarify, the first aspect is to know what information is available and its location. Then it will be necessary to organize such information. The benefit of the platform will provide the consulting user with all the available information for decision making including all the existing variables.
Regarding the SIMONI, the application has been designed for incorporating alphanumeric information. SIMONI tries to define a number of socio-environmental indexes, which may be obtained with existing information of the study area.
The benefit of the platform will be for the consulting user which will be able to provide all the available information for decision making with all the existing variables.
Accessing to cadastral, environmental and socio economical information. Share information obtained from the indigenous communities.
Consulting information on-line. Aggregating information. Downloading the information.
Consulting the information of the data (metadata).
Consulting the agreements between the different agencies. Consulting the laws regarding the study area.
Consulting the information regarding other projects or agencies. Creating maps with the available information.
Creating different users.
Adding incident information (punctual and polygonal incidences) in SIMONI application.
3.4.
Conceptual development
The figures in Annex 1 present prototype interfaces of the GEOPORTAL created for the deployment of the Spatial Data Infrastructure in the Rio Platano Region. This was developed after a Usability Test with two members of the agency.
4.
STUDY AREA AND DATA
4.1.
Study Area
The study area is the "Rio Platano Reserve" declared “Heritage of Man and the Biosphere” by UNESCO in 1982. Located within the watershed of the Rio Platano, the reserve is one of the few remaining tropical rainforest areas in Central America with an abundant and varied plant and wildlife. In its mountainous landscape sloping down to the Caribbean coast, are over 2.000 indigenous people whom have preserved their traditional way of life (UNESCO, 2013). The area of the reserve is 900.000 hectares with a population of approximately 150.000 inhabitants.
Figure 6. Location of the project
Figure 7. Municipalities in Rio Platano
The area is also populated by indigenous communities; Miskitos, Pech, Garífunas and Ladinos. Miskitos and Garífunas live close to the coast, in the area of the big lakes (Ebano lake and Brus lake), where there are good conditions for fishing activities. The Miskitos are progressively conquering the inland zones through the channels of the major rivers in the area (Platano River and Patuca River).
The main inland areas of the reserve are inhabited by the Ladino and Pech communities. They reached the limits of the reserve from the south and west crossing the mountains of Dulce Nombre de Culmí area.
The distance between the capital of Honduras (Tegucigalpa) and the south-west limit of the Biosphere Reserve (the closest one) is 250 kilometres and the needed time to reach the limit from there is approximately 4 hours. Dulce Nombre de Culmí is the last large village (4.000 inhabitants) located exactly in the border of the Reserve. This area is populated by Ladinos and Pech communities. After this village the communication is more difficult, provoking a slow paced travel are to unpaved roads which increases the travel time.
In the coastal area and along the rivers the economy is mainly based in agriculture and fishing activities with a low level of development. This small-scale agriculture is easily made sustainable. However, conflicts over land rights involve non-native people invading and threatening indigenous land owners, which at the time are forcing them to move on from their historical lands. This migration is shifting the land use of these areas to the control of drug traffickers.
The climate of the area is tropical with precipitation values between 3.000 and 4.000 mm per year. This is important for the maintaining of the wet forest and the agriculture of the area. It is possible to define two seasons (rainy and dry), with huge differences in the value of precipitation. During the rainy season, tropical storm can occur with the consequence of big floods, overflows and landslides.
4.2.
Data
4.2.1. Digital Cartography
The ICF is the agent which executes the national law regarding the “Forest
management, protected areas and Wildlife” with the faculty to develop programs, projects and plans; also it is the organization which is in charge of creating the technical administration units that comply with the goals of this law. Its mission is to
“Ensuring the conservation and sustainable use of ecosystems, through the application of policies and regulation and encouraging investment and participation” (National Institute for Forest Conservation and Development, Protected Areas and Wild Life, 2013).
The ICF has developed a Forest National Information System (SNIF), a transversal tool to manage the administrative and technical information. This software is capable to handle cartographic information. Currently, the SNIF is technically supported by the Information Technology (IT) department, but it is only a prototype without a real agreement by the institution, and it is only used by the technicians of the IT department.
The only way to obtain digital information published from the ICF is through the “National Protected Areas System of Honduras” (SINAPH) where it is possible to download the limits of the protected areas in shapefile format. Currently, ICF does not have procedures and protocols for the exchange of cartographic information with other national institutions. Therefore, the only way to share cartographic information is informal and using physical copies.
ICF has different cartographic information in shapefile format developed by their technicians regarding protected areas, land coverage, conservation targets, management plans, road networks and hydrology of the whole Honduran territory.