Full Terms & Conditions of access and use can be found at
http://www.tandfonline.com/action/journalInformation?journalCode=tbsm21
Download by: [Universidade Nova de Lisboa] Date: 24 November 2017, At: 02:42
International Journal of Biodiversity Science, Ecosystem
Services & Management
ISSN: 2151-3732 (Print) 2151-3740 (Online) Journal homepage: http://www.tandfonline.com/loi/tbsm21
Ecosystem services and biodiversity trends in
Mozambique as a consequence of land cover
change
Sérgio Niquisse, Pedro Cabral, Ângela Rodrigues & Gabriela Augusto
To cite this article: Sérgio Niquisse, Pedro Cabral, Ângela Rodrigues & Gabriela Augusto (2017) Ecosystem services and biodiversity trends in Mozambique as a consequence of land cover change, International Journal of Biodiversity Science, Ecosystem Services & Management, 13:1, 297-311, DOI: 10.1080/21513732.2017.1349836
To link to this article: https://doi.org/10.1080/21513732.2017.1349836
© 2017 The Author(s). Published by Informa UK Limited, trading as Taylor & Francis Group.
View supplementary material
Published online: 17 Jul 2017. Submit your article to this journal
Article views: 427 View related articles
Ecosystem services and biodiversity trends in Mozambique as a consequence
of land cover change
Sérgio Niquisse a, Pedro Cabral b, Ângela Rodriguesband Gabriela Augustob
aDepartment of GIS and Regional Planning, Universidade Católica de Moçambique, Beira, Sofala, Moçambique;bNova IMS, Universidade Nova de Lisboa, Campus de Campolide, Lisboa, Portugal
ABSTRACT
The incorporation of ecosystem services (ES) information in planning decisions is an important factor in the sustainable use of natural resources. However, studies assessing the levels and changes of these services at national level are rare. In this paper, we estimate past and future changes in multiple ES and biodiversity, as a consequence of land cover change (LCC) in Mozambique. Water yield, water quality, erosion regulation, climate regulation, and biodiversity were modeled using a spatially explicit approach. Changes in ES and biodiversity were mapped at province level between 2005 and 2009. Through the use of a land change model, land cover was projected for 2025, and the resulting impacts on ES and biodiversity were estimated. We found a moderate increase in climate regulating service between 2005 and 2009. However, water quality (nutrient retention) and biodiversity decreased. LCC for 2025 is expected to have a similar impact on these ES. This study contributes with a methodology that can be useful for monitoring ES and assist decision policies affecting ES provision and trade-offs.
ARTICLE HISTORY Received 1 March 2017 Accepted 22 June 2017
EDITED BY Patrick O’Farrell
KEYWORDS
Ecosystem services change; GlobCover; InVEST; Land Change Modeler; Africa; open data; natural capital
1. Introduction
Ecosystem services (ES) are the benefits that people derive from nature, and these are essential for human well-being (Costanza et al. 1997, 2014; Daily 1997; Mooney et al.2005). However, their ability to support mankind is being threatened by the increasing demand of land for agriculture, forest, industrial, and urban areas (Halpern et al. 2008; Kareiva et al.
2011). Considerable efforts have been carried out to draw attention to the importance of preserving nat-ural capital, and also to providing useful information for decision-making through biophysical (Bai et al.
2013; Leh et al.2013) and economic valuation studies of ES (Kubiszewski et al.2013; Frélichová et al.2014; Jacobs et al. 2016; Kindu et al. 2016). ES mapping tools and quantitative biophysical and economic indi-cators make ES values visible thereby helping to assess the trade-offs associated with these interactions (Tallis and Polasky 2009, 2011; Maes et al. 2012; Burkhard et al. 2013). To this end, several national ecosystem assessments have been carried out under the Millennium Ecosystem Assessment framework (Millenium Assessment 2003). However, these are context-specific, and insufficiently harmonized to inform European policies (Schröter et al. 2016). For instance, the Portuguese national ecosystem assess-ment (Pereira et al. 2009) is composed of several dispersed case studies and does not include a national assessment at country level. Thus, there is need for national ecosystem assessments that provide a
valuation of multiple ecosystem services in biophysi-cal and/or economic terms.
One possible way of carrying out regional and national assessments is to study the impact of land cover change (LCC) on the provision of multiple ES (Leh et al.2013; Feger et al.2015; Tolessa et al.2017). The effective management of LCC has been consid-ered crucial to design policies able to ensure ES supply (Portela and Rademacher 2001; Nelson et al.
2009; Swetnam et al. 2011; Martínez-Harms and Balvanera 2012; Mascarenhas et al. 2015). It has also been demonstrated that to better understand the impact of planning policies, it is important to have decision support tools based on system diagnosis and simulation of scenarios (Costanza and Ruth 1998; Olsson et al. 2004; Kareiva et al. 2011; Maes et al.
2012; Kubiszewski et al.2017).
Studies about the impact of LCC on ES have been carried out all over the world (Polasky et al. 2011; Feger et al.2015; Wang et al.2015). For Africa, these studies are rare, possibly due to the lack of data (Leh et al. 2013; Abram et al. 2014; Dawson and Martin
2015; Kindu et al. 2016; Wangai et al. 2016). This constitutes an important problem because this con-tinent is undergoing significant LCC with important impacts on the supply of ES (Power et al. 2010; Leh et al. 2013; Kindu et al. 2016). Specifically for Mozambique, earlier works have analyzed ES at national, regional, and local levels (C. Wong et al.
2005; Nagabhatla et al. 2008; Mudaca et al. 2015;
CONTACTSérgio Niquisse sniquisse@ucm.ac.mz Universidade Católica de Moçambique, Beira, Sofala, Moçambique. Supplemental data for this article can be accessedhere.
–
https://doi.org/10.1080/21513732.2017.1349836
© 2017 The Author(s). Published by Informa UK Limited, trading as Taylor & Francis Group.
This is an Open Access article distributed under the terms of the Creative Commons Attribution License (http://creativecommons.org/licenses/by/4.0/), which permits unrestricted use, distribution, and reproduction in any medium, provided the original work is properly cited.
Nunes and Ghermandi2015; Von Maltitz et al.2016). However, none has provided a biophysical assessment of ES at national and/or province levels nor their changes as a consequence of LCC. As a result, it is still difficult to understand ES trends and dynamics in Mozambique, complicating the task of preserving natural capital. The lack of such studies may consti-tute an important obstacle for designing policies aim-ing to maintain ES supply.
In order to provide more precise information about the state of ES in Mozambique, we use a spatially explicit modeling tool – the Integrated Valuation of Ecosystem Services and Trade-offs (InVEST) (Tallis et al. 2015) – that uses ecological production functions and economic valuation as inputs (in this study, we perform only a biophysical assessment). InVEST is a free and open model, has low data requirements, and has demonstrated its use-fulness in different study areas (Nelson et al. 2009; Goldstein et al. 2012; Delphin et al. 2013; Geneletti
2013; Leh et al. 2013; Cabral et al. 2016; Jiang et al.
2016; Posner et al.2016). Thus, the main goal of this study is to assess the impact of LCC on multiple ES and biodiversity of this country. The assessment is focused on‘landscape services’, that is, the capacity of
a landscape to provide goods and services to society (Lamarque et al. 2011). We use ‘ecosystem service
indicators’ to model the likely trends in ES, as these represent‘quantitative spatially differentiated metrics
or maps related to supply of, or demand for, ecosys-tem services’ (EPA 2009). The specific objectives of
this exploratory and awareness raising study are:
(i) To identify and describe the trends of ES and biodiversity in Mozambique as a consequence of LCC between 2005 and 2009 using open data;
(ii) To estimate future LCC for year 2025, and the impact on Mozambique’s ES and biodiversity.
With this study, we expect to shed light on issues regarding the assessment of ES at the country level and to discuss how this approach can provide useful information for planning.
2. Materials and methods
2.1. Study area
Mozambique, officially the Republic of Mozambique, is located in southeast Africa and comprises a land surface of about 800,000 km2(Figure 1). This country
is naturally endowed with a diverse landscape includ-ing coastal plains, savannah, woodlands, and moun-tains. There are many rivers flowing from west to east into the Indian Ocean, with the Zambezi and Limpopo being the two largest. Mozambique is
divided into 11 provinces and shares borders with six countries. The country had about 27.98 million inhabitants in 2015 (World Bank 2016). This repre-sents an increase of 37.4% in total population since the last census in 2007 (INE 2007) (Table 1). The capital and largest city is Maputo, with 1.24 million inhabitants (projected population) (INE 2015). Mozambique´s gross domestic product (GDP) was US $14,807 billion in 2015 (World Bank 2016). The country ranked 180 out of 188 countries in the Human Development Index for year 2015 (UNDP
2015).
Drought is a serious problem, especially in the Southern provinces of the country, with devastating consequences, such as the loss of crops and cattle, and famine. According to SETSAN (SETSAN 2016), approximately 2.3 million people are expected to be food insecure between October and March 2017. Mozambique has also been identified as especially vulnerable to flooding due to the occurrence of tro-pical storms (Chemane et al. 1997; Nicholls and Tol
2006; Cardona et al.2012). Mozambique has one of7 the longest African coastlines, approximately 2,700km, with a high level of exposure of coastal populations to climate hazards and erosion (around 60% of the population live in the coastal areas) (República de Moçambique 2015a, 2015b; INE
2016a). This exposure is being amplified by the increase of people and associated infrastructures (EEA2006; Martins et al.2012), and by the expected increase in coastal flooding and sea level rise (IPCC
2014).
2.2. Data and methods
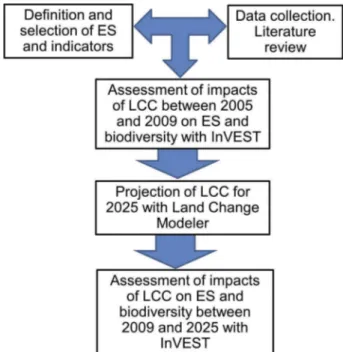
The overall methodology followed in this paper is shown inFigure 2and explained further below.
This study deals only with ES supply and does not specifically examine the ES demand. However, con-sidering that 80% of the population depends on agri-culture production (FAO 2012), it is reasonable to assume that ES indicators related to the sustainability of food production are in high demand. Water provi-sion and quality are also ES of utmost importance in Mozambique, as almost half of the population does not have access to treated water for domestic use (INE 2016b). Earlier research has demonstrated a positive relationship between well-being and the bio-diversity richness (Dallimer et al. 2012), and the pre-servation of biodiversity is equally important for Mozambicans. Finally, climate regulation is an impor-tant global ES (Gómez-Baggethun and Barton 2013). Therefore, and considering the data availability, the selected ES indicators for modeling included water yield, water quality, sediment retention, carbon sto-rage, and biodiversity. These indicators have been used successfully in other studies (Bhagabati et al.
2012; Bai et al. 2013; Leh et al. 2013; Cabral et al.
2016). Table 2 shows the ES and respective ES indi-cators (units) used in the current study. We used the Integrated Valuation of Ecosystem Services and Trade-offs (InVEST) tool (Tallis et al.2015) to quan-tify and map ES indicators. ESRI ArcGIS (ESRI2014) was the software used to process, analyze, and map all of the geographical data used in the study.
2.2.1. Land cover data
The land cover maps of Mozambique for years 2005 and 2009 used in this study are from ESA/ESA GlobCover Project (http://due.esrin.esa.int/page_globcover.php). These datasets differentiate 19 classes of land cover (Table 3) and are derived from data acquired by the ENVISAT MERIS sensor, with 300m of spatial resolution (ESA2015). The overall accuracy is 73% (Defourny et al.
2009). Additional data for administrative boundaries were obtained from the National Center of Cartography (CENACARTA) (http://www.cenacarta.com).
2.2.2. ES indicators
All of the ES indicators were calculated using a 300m spatial resolution. All spatial datasets had or were converted into a common World Geodetic System 84 Universal Transverse Mercator projection.
2.2.2.1. Water yield. Water yield is the amount of water running off the landscape (Langbein and Iseri
Table 1.Mozambique’s population in year 2007 (INE2007). Province 2007 Inhab. / Sq Km Area (Sq Km) Cabo Delgado 1,683,681 21 78,778
Gaza 1,362,174 18 75,334
Inhambane 1,444,282 21 68,775
Manica 1,400,415 22 62,272
Maputo-Província 1,098,846 47 23,258 Maputo-Cidade 1,271,569 3667 347
Nampula 3,861,347 49 79,010
Niassa 1,055,482 8 129,798
Sofala 1,715,557 25 67,753
Tete 1,593,258 16 100,662
Zambézia 3,880,184 37 103,478
Total 20,366,795 26 789,466
Figure 1.Mozambique provinces, dams, and numbered hydrological basins.
1995). The Water Yield InVEST model is based on the Budyko curve and annual average precipitation (Tallis et al. 2015). The hydrologic basins, available at the CENACARTA website, are based on the 30 m digital elevation model (DEM) from the Advanced Spaceborne Thermal Emission and Reflection Radiometer (ASTER). We parameterized this InVEST model using average annual precipitation (Hijmans et al. 2005), annual reference evapotranspiration (Trabucco and Zomer 2009), soil characteristics (FAO et al. 2012), watersheds from CENACARTA, and land cover (ESA 2015) to calculate the average water yield. We report water yield in m3/ha/year. Pixel values were aggregated by province using a GIS opera-tion (zonal statistics) available in the ArcGIS software. Annex S.1 provides the biophysical values used to parameterize the InVEST water yield model (Leh et al.2013,2016).
2.2.2.2. Water quality. The InVEST nutrient reten-tion model evaluates land cover effects on water quality (Tallis et al.2015). The average annual quan-tity of nutrients exported from each land cover cell is determined using values found in the literature for nitrogen (N) export coefficients (Tallis et al. 2015). The nutrient load is obtained by routing water along flow paths based on slope (Tallis et al.2015). Finally,
the nutrient load quantity retained by the landscape is calculated using the nutrient retaining capacity of each type of land cover (Tallis et al.2015). We para-meterized this InVEST model using a digital elevation model (DEM) (NASA2012), annual reference evapo-transpiration (Trabucco and Zomer2009), soil char-acteristics (FAO, IIASA, ISRIC, ISSCAS, JRC 2012), watersheds from CENACARTA, and land cover (ESA
2015). We report nutrient retention (nitrogen) in kg/ ha/year. Pixel values with mean nutrient retention were aggregated by province using a GIS operation (zonal statistics) available in the ArcGIS software. Annex S.1 provides the biophysical values used to parameterize the InVEST nutrient retention model (Leh et al. 2013,2016).
2.2.2.3. Erosion regulation. Soil erosion can be caused by rain and runoff. Harmful effects of erosion include (Lal1998; Mann et al.2002): the reduction of water quality, reduction of soil ability to store water
Figure 2.Flowchart of the methodology used in the study.
Table 2.Ecosystem services and biodiversity indicators used in this study.
Ecosystem services Ecosystem service indicator, units Water yield Water yield, m3/ha/year
Water quality Nutrient retention (nitrogen), kg/ha/year Erosion regulation Sediment retention, t/ha/year
Climate regulation Carbon stored, t/ha/year Biodiversity Habitat quality score [0–1]/year
Table 3.Land cover classes from GlobCover Project and legend reclassification.
Code Land use land cover category
Simplified legend (Bai et al.2014) 14 Rainfed croplands Cropland 20 Mosaic cropland (50–70%) /vegetation
(grassland/shrubland/forest) (20–50%)
Cropland
30 Mosaic vegetation (grassland/shrubland/ forest) (50–70%) /cropland (20–50%)
Cropland
40 Closed to open (>15%) broadleaved evergreen or semi-deciduous forest (>5m)
Forest
50 Closed (>40%) broadleaved deciduous forest (>5m)
Forest
60 Open (15–40%) broadleaved deciduous forest/woodland (>5m)
Forest
90 Open (15–40%) needle-leaved deciduous or evergreen forest (>5m)
Forest
100 Closed to open (>15%) mixed broadleaved and needle-leaved forest (>5m)
Forest
110 Mosaic forest or shrubland (50–70%) /grassland (20–50%)
Shrubland
120 Mosaic grassland (50–70%) /forest or shrubland (20–50%)
Grassland
130 Closed to open (>15%) (broadleaved or needle-leaved, evergreen or deciduous) shrubland (<5m)
Shrubland
140 Closed to open (>15%) herbaceous vegetation (grassland, savannas or lichens/mosses)
Grassland
150 Sparse (<15%) vegetation Grassland 160 Closed to open (>15%) broadleaved forest
regularly flooded (semi-permanently or temporarily)–Fresh or brackish water
Wetland
170 Closed (>40%) broadleaved forest or shrubland permanently flooded–Saline or brackish water
Wetland
180 Closed to open (>15%) grassland or woody vegetation on regularly flooded or waterlogged soil–Fresh, brackish, or saline water
Wetland
190 Artificial surfaces and associated areas (Urban areas >50%)
Urban
200 Bare areas Desert
210 Water bodies Water
and nutrients, reduction of agronomic productivity, damage in infrastructures, and siltation. The sedi-ment retention InVEST model (Tallis et al. 2015) was used to determine the ability of the landscape to retain sediments in a watershed as a function of rainfall (Hijmans et al. 2005), soil characteristics (FAO, IIASA, ISRIC, ISSCAS, JRC 2012), and topo-graphy (NASA 2012). The model uses the Universal Soil Loss Equation (USLE) (Wischmeier 1978) to calculate the potential soil loss of each type of land use and land cover (1):
USLE¼RKLSCP (1)
where USLE is the potential average annual soil loss, R is the rainfall erosivity factor, K is the soil erod-ibility factor, LS is the slope length and steepness factor, C is the land use and land cover management factor, and P is the supporting practice factor (Wischmeier 1978). The sediment retention corre-sponds to the difference between potential soil loss (USLE) of the landscape and the maximum potential soil loss assuming a bare landscape. The rainfall ero-sivity (R) is a climatic factor strongly related to soil loss and was obtained using (Roose1996) (2):
R¼0
:5Pþ0:05 (2)
where R is rain erosivity andPis the average annual
precipitation (mm) (Hijmans et al.2005). We report sediment retention in t/ha/year. Pixel values with mean sediment retention were aggregated by pro-vince using a GIS operation (zonal statistics) available in the ArcGIS software. Annex S.1 provides the bio-physical values used to parameterize the InVEST sediment retention model (Leh et al.2013,2016).
2.2.2.4. Climate regulation. Carbon storage is an
important global climate regulating service (Gómez-Baggethun and Barton2013). Estimates of the carbon stored by the vegetation for each land cover class with values found in literature (Leh et al.2013) were used in the InVEST carbon model (Tallis et al.2015). The carbon stored by Mozambique’s landscape is reported
in t/ha/year and was aggregated by province using a GIS operation (zonal statistics) available in the ArcGIS software. Annex S.2 provides the biophysical values used to parameterize the InVEST carbon model (Leh et al.2013,2016).
2.2.2.5. Biodiversity. Biodiversity is not considered
an ES despite being associated with functional ser-vices that provide ES, such as soil fertility, pest control, pollination, water yield, and water quality (Hassan et al. 2005; Lavorel et al. 2015; Newbold et al.2015). The InVEST habitat quality model uses information on land cover and threats to biodiver-sity to produce habitat quality maps (Tallis et al.
2015). Habitat quality is the ability of the
ecosystem to provide appropriate conditions for individual and population persistence and depends on four factors (Tallis et al. 2015): (i) the relative impact of each threat; (ii) distance between habitat and the threat source; (iii) level of legal /institu-tional /social /physical protection from disturbance in each cell; and (iv) the relative sensitivity of each habitat type to each threat on the landscape. We modeled biodiversity using the approach described by Leh et al. (2013). These authors considered
‘disturbed’ and ‘undisturbed’ land cover category
as ‘non-habitat’ and ‘habitat’ areas, respectively. The habitat quality score ranges from 0 (non-habi-tat land cover classes) to 1 (perfect habi(non-habi-tat land cover classes). The habitat degradation sources (roads, urban areas, and agriculture areas) were weighted and given a maximum distance of degra-dation influence (Leh et al. 2013). The habitat quality of Mozambique is reported as an average of pixel scores resulting from the model ranging from 0 to 1. These values are aggregated to provide estimates by province using a GIS operation (zonal statistics) available in the ArcGIS software. Annex S.3 provides the biophysical values used to para-meterize the InVEST habitat quality model (Leh et al. 2013, 2016).
2.2.3. Projection of land cover for year 2025
LCC was projected for year 2025 using the Land Change Modeler available in IDRISI Selva software (Eastman 2012). This model uses the historical changes from 2005 to 2009 land cover maps to project future land cover for year 2025. The land change demand was obtained through the use of Markov chains that determined the probability of a pixel changing to another class between year 2005 and 2009. The transition potentials correspond to suitability maps for each land cover transition and express the likelihood that land will transition in the future using a multi-layer perceptron neural network. During this process, a collection of poten-tial transition maps is created using driver variables that were transformed using a natural log. Only the transitions with more than 100,000 cells were retained for the modeling exercise for the sake of simplicity, because we are interested only in the major transitions. As we had only two time moments for the land cover, it was not possible to assess the quality of the model projection output. We assumed a Business as usual (BAU) case
sce-nario, in which the historical trend of LCC between 2005 and 2009 was used to project 2025 land cover without any planning restrictions. The resulting land cover map was used to obtain the ecosystem service indicators described in Section 2.2.2 for the year 2025.
2.2.4 ES changes
After calculating the ES of each type for each year in Mozambique, changes were calculated as (3):
ESCx¼
EStþ1x EStx
EStx
100 (3)
where ESCx is the ES change index for delivering ES
of typex,EStx is the baseline situation for delivering
ES of typex at time t, and EStþ1xis the situation for
delivering ES of typex at time t + 1.
3. Results
3.1. Land changes in mozambique between 2005 and 2009
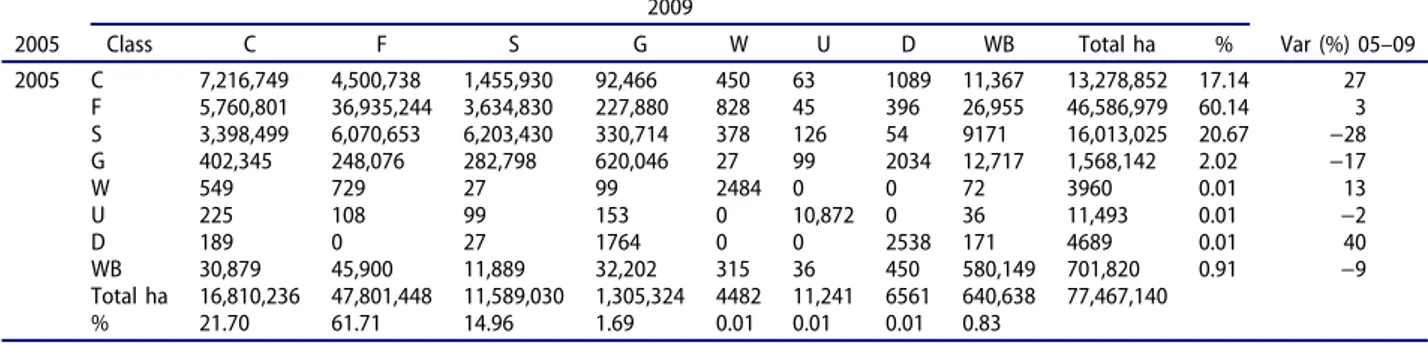
After reclassifying GlobCover classes using a simpli-fied land use and land cover legend (Bai et al.2014) (Table 3), we observe an important increase in the cropland between 2005 and 2009 (27%) (Table 4). This class, the second major type of land cover in the country, increased its proportion in the landscape from 17% to 22%. It is likely that in the long-term cropland will continue to grow due to the need for food production to address the increasing population of the country (World Bank2016). This will have an important impact on ES provided mostly by shrub-land and grassshrub-lands, as these are the shrub-land covers that
will most likely change into cropland. According to (FAO 2013), the main farming system in Mozambique is rain-fed subsistence farming with low levels of productivity due to the lack of condi-tions, including technology, market accessibility, stor-ing infrastructure and agricultural organization (Woodhouse2014). Therefore, to increase production small farmers increase agricultural land by converting other land covers into cropland, mainly grassland and shrubland, because it is much easier for them to prepare the land. Conversely, the shrubland, which is the third largest type of land cover, has decreased sharply, from 21% in 2005 to 15% in 2009. Forest is the largest land cover class and has remained practi-cally unchanged between the two dates (60% in 2005 and 62% in 2009). The other classes represented altogether, approximately, less than 2% of Mozambique’s total area. From these, it is worth noting that the water bodies fell 9%, between 2005 and 2009.
3.2. Impact of land changes in ecosystem services between 2005 and 2009
Figure 3shows ES changes between 2005 and 2009 in Mozambique. There was an increase in climate reg-ulating service (carbon storage) (7.4%), which is con-sistent with the increase in forest (2%) and wetland
Table 4.Land cover changes between 2005 and 2009 (C: Cropland; F: Forest; S: Shrubland; G: Grassland; W: Wetland; U: Urban; D: Desert; WB: Water Bodies).
2009
2005 Class C F S G W U D WB Total ha % Var (%) 05–09
2005 C 7,216,749 4,500,738 1,455,930 92,466 450 63 1089 11,367 13,278,852 17.14 27 F 5,760,801 36,935,244 3,634,830 227,880 828 45 396 26,955 46,586,979 60.14 3 S 3,398,499 6,070,653 6,203,430 330,714 378 126 54 9171 16,013,025 20.67 −28 G 402,345 248,076 282,798 620,046 27 99 2034 12,717 1,568,142 2.02 −17
W 549 729 27 99 2484 0 0 72 3960 0.01 13
U 225 108 99 153 0 10,872 0 36 11,493 0.01 −2
D 189 0 27 1764 0 0 2538 171 4689 0.01 40
WB 30,879 45,900 11,889 32,202 315 36 450 580,149 701,820 0.91 −9
Total ha 16,810,236 47,801,448 11,589,030 1,305,324 4482 11,241 6561 640,638 77,467,140 % 21.70 61.71 14.96 1.69 0.01 0.01 0.01 0.83
Figure 3.Ecosystem service changes (%) in Mozambique (2005–2009).
(13%) classes. However, water quality (nitrogen retention) (−8.6%) and biodiversity (−5.5%)
decreased as a result of LCC in Mozambique. Both water yield (−1.6%) and erosion regulation (−0.2%,
sediment retention) had variations too small to be considered significant considering data and modeling uncertainties.
Table 5shows the changes (%) in ES per province. Maputo city is by far the province with the poorest performance in all the ES. All ES fell considerably in this province as a result of LCC (changes between
−86.3% and−96.8%). This may be associated with the
urbanization process necessary to accommodate an increasing number of people living in the country’s capital and environs (INE 2015), and also with the increase of cropland necessary to support food needs
(FAO 2013). Maputo and Maputo city were the only provinces in which all ES decreased. All the other provinces had mixed performances, with positive and negative evolutions in the level of ES provision translating different LCC dynamics.
Figure 4 shows the variation of ES for all the provinces using year 2005 as reference. Orange to red colors represent an increasing decline in the ES between 2005 and 2009, while light green to dark green represent an increasing improvement in ES. Maputo city is always red color, indicating a degrada-tion of more than 30% in all ES. The water quality regulating service has also decreased strongly in the Gaza province (−22.2%). Sofala had the second
poor-est performance after Maputo city in biodiversity (−15.5%). Cabo Delgado also had a notable decrease
in the climate regulating service as a consequence of LCC (−23.7%).
3.3. Modeled land change trends and impacts on ES for 2025
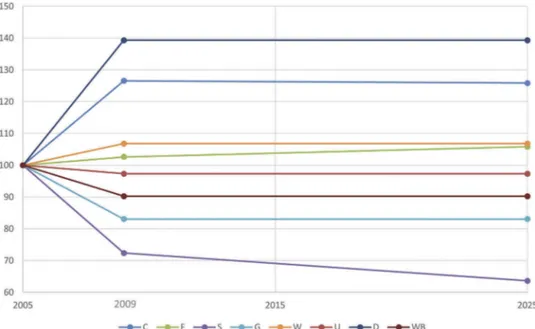
Figure 5reports the major trends in land cover mod-eled for 2025. Cropland is expected to remain stable (−0.6% between 2009 and 2025). Forest will continue
to grow (3.1% between 2009 and 2025). This growth will mainly reflect the replacement of cropland by this class. Finally, shrubland will continue to fall (−12.1% between 2009 and 2025). In this case, both
forest and cropland will contribute similarly to the
Table 5.Ecosystem service changes (%) by province (2005– 2009).
Province
Water yield
Water quality (N retention)
Erosion
regulation Biodiversity Climate regulation Cabo
Delgado
1.5 4.3 −2.9 −10.4 −23.7
Gaza −4.8 −22.2 0.6 −5.8 24.2
Inhambane −0.6 −10.1 −1.5 −8.4 12.4
Manica −2.9 −10.9 −1.2 −5.2 25.2
Maputo −0.8 −2.1 −5.4 −13.4 −11.3 Maputo City −94.6 −96.2 −86.3 −96.8 −93.3
Nampula −1.3 −7.0 0.5 0.2 6.8
Niassa −2.8 −6.5 −0.5 −3.7 4.8
Sofala −0.7 −6.7 −2.7 −15.5 4.1
Tete −5.5 −13.6 2.7 1.4 32.7
Zambezia −1.0 −1.6 −0.4 −4.0 6.4
Figure 4.Ecosystem service changes (%) by province (2005–2009).
decline of this class.Figure 6shows the variation (%) of the ES indicator levels from 2005 to 2025 (index 100 in 2005).
Results show that the climate regulating service is expected to increase 10.3% in Mozambique, confirm-ing the trend seen between 2005 and 2009. However, water quality regulating service (nitrogen retention) is expected to fall sharply (−30.9%). All the other
ser-vices will fall less than 6%. The reduction of nitrogen retention by the landscape can be explained by the increase of cropland (Martínez et al.2009).
There was a slight reduction in water yield from 2005 to 2009 (−1.56%) at the country level, and this
service is expected to be stable for 2025. However, a detailed analysis at the province level (Figure 7)
shows that the provinces in the South of the country will be affected by a decrease in this service from 2009 to 2025.
Another important result at the province level, and contradictory with the performance of the service at national level, is the decrease in the climate regulating service in the province of Tete (−16.3%), from 2009 to
2025. This province is undergoing substantial LCC due to the increasing demand for agricultural lands (26.5% increase in the agriculture class, between 2005 and 2009). Overall, biodiversity fell−5.5% between 2005 and
2009 and is likely to remain stable from 2009 to 2025. A decrease of biodiversity is usually associated with an increase in agriculture activities (McLaughlin and Mineau1995). This decrease may be explained by the
Figure 5.Land cover changes between 2009 and 2025 (C: Cropland; F: Forest; S: Shrubland; G: Grassland; W: Wetland; U: Urban; D: Desert; WB: Water Bodies) (index 100 in 2009).
Figure 6.Ecosystem service trends between 2005 and 2009 and 2025 projection results (index 100 in 2005).
increase of agroforestry and other economic activ-ities, which have caused the loss of suitable habitats for many species during the time period studied. The loss of biodiversity may severely jeopardize several ES and functions (Newbold et al. 2015).
4. Discussion
4.1. ES trends in mozambique as a result of LCC
We provide the first ES and biodiversity assessment for Mozambique. In addition to earlier studies, which have used InVEST for mapping past changes in multiple ES and biodiversity in Africa, we also analyze future changes in ES and biodiversity as a consequence of LCC, at country and province levels. To overcome the lack of land cover data for Africa, and for Mozambique in particular, we employed a land change model to estimate future LCC and quantified the impact on ES and biodiversity. The land change model allowed for an innovative perspective on the ES and biodiversity trends for this country, and to understand how each of the provinces was, and is expected to be, performing regarding each ES and biodiversity in the future.
4.2. LCC main impacts on ES and policy implications
At national level, the main problems identified by our study were the observed negative trends in the water quality service and biodiversity.
The projected decrease in the water quality service in Mozambique for year 2025 should be closely mon-itored, as two main coastal ecosystems depend greatly on water quality: mangroves and coral reefs. Both of these habitats have been widely acknowledged as important factors in the protection of coastlines world-wide (Cabral et al.2017). The mangrove trees occupy an area of approximately 350,000ha (Barbosa et al.
2001), and their ability to protect population and infrastructures from storms and cyclones has been reported in several studies (e.g. Das and Crépin2013; Barbier2016). Moreover, mangroves are themselves an important ecosystem for the subsistence of coastal communities, by providing rich fishing grounds, wood, medicine, coastal erosion protection, thereby contributing to the country’s economic development (Barbosa et al.2001). At the same time, the coral reefs on Mozambique’s coast range from 413 to 570km2 (Carissa Wong et al.2005) and are known to dissipate wave energy and assist in the prevention of sea storm effects on habitats and infrastructures of nearby coasts (Van Zanten et al.2014; Costa et al.2016). Coral reefs are also one of the major attractions for Mozambique’s
developing coastal tourism industry (Motta et al.
2002). Knowing that Mozambique is likely to be severely affected by climate change and rising sea level (República de Moçambique2015b), the degrada-tion of mangrove and coral habitats will likely increase coastal vulnerability, magnifying the effects of climate hazards and erosion, including the loss of lives (UNISDR 2016; Cabral et al. 2017). These findings
Figure 7.Ecosystem service changes (%) between 2009 and 2025 by province.
may have important policy implications for Mozambique. Our results may be linked to the national strategy for mangrove protection (República de Moçambique2015a), and to the strategy and action plan for the Integrated Coastal Zone Management (ICZM) of Mozambique, which is currently being developed (República de Moçambique 2016). Our study offers relevant information to be considered in these plans because the increase of nutrients in the water increases the mortality of mangroves (Lovelock et al.2009), and negatively affects coral physiology and ecosystem functioning (D’Angelo and Wiedenmann
2014). Knowing that about 60% of the population lives in coastal areas (INE2016a), our study confirms and reinforces the need for such strategies to preserve the important services provided by coastal habitats.
Regarding biodiversity, our results are worrying at national level despite the existence of planning instruments aimed at preservation of the country’s
environment and biodiversity (MICOA 2007, 2014). Our findings call for the reinforcement of policies aimed at preserving biodiversity as it is positively connected to human well-being, and other functional services that provide ES (Hassan et al.2005; Dallimer et al.2012; Lavorel et al.2015; Newbold et al.2015). At province level, our results allow the prioritiza-tion of individual services locally. By looking at the provinces individually, one can see which ES require more attention regarding the maintenance of ES levels. For instance, Maputo City clearly stands out from the other provinces as being the one with the poorest performance in all ES. Although this province represents a very small portion of the territory, it is the most densely populated one. An individual ana-lysis of the other provinces will also allow deriving conclusions about which ES should be targeted for intervention by planners.
4.3. Limitations
Important aspects to consider when dealing with ecosystem assessments, and which are often over-looked by actors and researchers, are scale (Zhang et al. 2013; Grêt-Regamey et al. 2014) and data and modeling uncertainties (Hou et al. 2013; Hamel and Bryant 2017). The scale of analysis has a variable impact on the results of ES studies (Raudsepp-Hearne and Peterson 2016). It limits the type of ES possible to analyze and also influences estimates of ES values (Zhang et al.2013; Grêt-Regamey et al.2014). The possible management interventions, including those for the area analyzed in this study, should always incorporate the effects of scale when targeting ecological processes sustaining ES generation (Lindborg et al.2017). Regarding data and modeling uncertainties, and although techniques and strategies exist to minimize this problem, their implementation
is not always possible due to the lack of data and/or modeling limitations (Hou et al. 2013; Hamel and Bryant 2017). Thus, these ES assessment results should also be carefully interpreted concerning scale, data and modeling uncertainties.
The InVEST models were not assessed comparing the model outputs with real data or observations. Unfortunately, we had no access to datasets to vali-date the model results, and for this reason, a sensi-tivity analysis was not carried out. Like all models, those used herein have several limitations, which are documented in the InVEST manual (Tallis et al.
2015). For instance, the carbon model is very simpli-fied and does not consider full carbon cycle (Tallis et al. 2015). The same is true of the water model, which does not account for the whole hydrologic cycle (Tallis et al. 2015). However, the advantage of the InVEST tool is to provide a set of open source models ready to use and available for anyone wishing to do multiple ES assessments in GIS environments. It is also important to note that we have measured only the potential of the ecosystem to provide such ES. More detailed analysis is required to study the relationship between land management practices, ES provision, and ES use by people.
The spatial resolution of the land cover data was coarse, leading to generalization problems. This is problematic in small but important areas such as wetlands, which have their own typical ES, and may be generalized to other land cover types. Additionally, the low level of accuracy of GlobCover (73%) is below the minimum level of interpretation accuracy in the identification of land use and land cover categories from remote sensing data, which should be at least 85% (Anderson et al. 1976). Another important aspect we had to deal with was the different charac-teristics of the data, such as disparate collection dates, and/or different scales. The coherent integration of these different datasets demanded a considerable effort. However, it required no additional data than those already available at national scale, which was very important for such a large study area. The qual-ity and reliabilqual-ity of results can be improved when more accurate, updated, and detailed data become available. This work thus also calls for more recent and better land cover data for Africa in general and, in particular, for Mozambique. However, having access to better data will change only the suite of services to be analyzed if more human resources are available to carry out local and more detailed studies. Finally, this study would have benefitted from stakeholder participation. This would help selecting a suite of ES that could better correspond to an effective demand of ecosystem services, and not to the authors’view regarding this subject. For example, other ES could have been analyzed, such as water quality related to pesticides and contaminants.
Additionally, the discussion about the communica-tion and/or adjustment of specific ES indicators, and scenario building, would enrich this approach, fitting better the information needs for effective spatial plan-ning. Future works will include the development of alternative scenarios with economic valuation and trade-off analysis to better understand the impact of different planning options on ES.
5. Conclusions
This exploratory and awareness-raising study assessed the impact of LCC on multiple ES and biodiversity, using a spatiotemporal approach enabling a new per-spective on the functions and uses of the natural envir-onments of Mozambique. The estimates here presented point out the responsibility of the 11 provinces belong-ing to this territory in their capacities to maintain ES and biodiversity. This type of spatiotemporal diagnosis may help the provinces regarding their contribution to provide non-market ES. These indicators should help to carry out trade-offs considering the natural capital in addition to classic economic approaches. Beyond the completion of this study, which will also include sce-nario and ES valuation, the challenge will be to con-tinue to work on the usefulness of this assessment and the way it can effectively influence decision-making activities, contributing to the maintenance of ecosys-tem functioning in Mozambique.
Disclosure statement
No potential conflict of interest was reported by the authors.
ORCID
Sérgio Niquisse http://orcid.org/0000-0001-5298-8282
Pedro Cabral http://orcid.org/0000-0001-8622-6008
References
Abram NK, Meijaard E, Ancrenaz M, Runting RK, Wells JA, Gaveau D, Pellier A-S, Mengersen K.2014. Spatially explicit perceptions of ecosystem services and land cover change in forested regions of Borneo. Ecosyst Serv [Internet]. 7:116–127. Available fromhttp://linkinghub. elsevier.com/retrieve/pii/S2212041613000909
Anderson JR, Hardy EE, Roach JT, Witmer RE 1976. A
land use and land cover classification system for use with remote sensor data, Geological Survey Professional Paper 964. [place unknown].
Bai Y, Feng M, Jiang H, Wang J, Zhu Y, Liu Y. 2014.
Assessing consistency of five global land cover data sets in China. Remote Sens. 6:8739–8759.
Bai Y, Zheng H, Ouyang Z, Zhuang C, Jiang B. 2013.
Modeling hydrological ecosystem services and tradeoffs: a case study in Baiyangdian watershed, China. Environ Earth Sci [Internet]. 70:709–718. doi: 10.1007/s12665-012-2154-5
Barbier EB.2016. The protective service of mangrove eco-systems: a review of valuation methods. Mar Pollut Bull. 109:676–681.
Barbosa FMA, Cuambe CC, Bandeira SO.2001. Status and
distribution of mangroves in Mozambique. South African J Bot [Internet]. 67: 393–398. [[Accessed 2016 Jul 27]]. http://linkinghub.elsevier.com/retrieve/pii/ S0254629915311558
Bhagabati N, Barano T, Conte M, Ennaanay D, Hadian O, McKenzie E, Olwero N, Rosenthal A, Suparmoko
SA, Tallis H 2012. A green vision for Sumatra: using
ecosystem services information to make recommen-dations for sustainable land use planning at the pro-vince and district level. A Report by The Natural Capital Project, WWF-US, and WWF-Indonesia.
www. ncp-dev.
Burkhard B, Crossman N, Nedkov S, Petz K, Alkemade R.
2013. Mapping and modelling ecosystem services for
science, policy and practice. Ecosyst Serv [Internet]. 4:1–3. http://linkinghub.elsevier.com/retrieve/pii/ S2212041613000259
Cabral P, Augusto G, Akande A, Costa A, Amade N, Niquisse SSS, Atumane A, Cuna AAA, Kazemi K, Mlucasse R, et al.2017. Assessing Mozambique’s expo-sure to coastal climate hazards and erosion. Int J Disaster Risk Reduct [Internet]. 23:45–52. http://linkin ghub.elsevier.com/retrieve/pii/S2212420916306197
Cabral P, Feger C, Levrel H, Chambolle M, Basque D.2016. Assessing the impact of land-cover changes on ecosys-tem services: a first step toward integrative planning in Bordeaux, France. Ecosyst Serv [Internet]. 22:318–327. Available from http://linkinghub.elsevier.com/retrieve/ pii/S2212041616302182
Cardona O-D, Van Aalst MK, Birkmann J, Fordham M, McGregor G, Perez R, Pulwarty RS, Schipper ELF, Sinh
BT, Décamps H, et al. 2012. Determinants of Risk:
exposure and Vulnerability. In Field CB, Barros V, Stocker TF, Dahe Q, editors. Manag risks extrem events disasters to adv clim chang adapt [Internet]. Cambridge: Cambridge University Press; p. 65–108. http://ebooks. cambridge.org/ref/id/CBO9781139177245A021
Chemane D, Motta H, Achimo M. 1997. Vulnerability of
coastal resources to climate changes in Mozambique: a call for integrated coastal zone management. Ocean
Coast Manag [Internet]. 37: 63–83. [[Accessed 2016
Aug 9]]. http://linkinghub.elsevier.com/retrieve/pii/
S0964569197000732
Costa MBSF, Araújo M, Araújo TCM, Siegle E. 2016.
Influence of reef geometry on wave attenuation on a Brazilian coral reef. Geomorphology. 253:318–327. Costanza R, Arge R, De Groot R, Farberk S, Grasso M,
Hannon B, Limburg K, Naeem S, Neill RVO, Paruelo J, et al.1997. The value of the world’s ecosystem services and natural capital. Nature. 387:253–260.
Costanza R, De Groot R, Sutton P, Van Der Ploeg S, Anderson SJ, Kubiszewski I, Farber S, Turner RK, De Groot R, Sutton P, et al. 2014. Changes in the global value of ecosystem services. Glob Environ Chang [Internet]. 26:152–158. http://linkinghub.elsevier.com/ retrieve/pii/S0959378014000685
Costanza R, Ruth M. 1998. Using dynamic modeling to
scope environmental problems and build consensus. Environ Manage [Internet]. 22:183–195. doi:10.1007/ s002679900095
D’Angelo C, Wiedenmann J. 2014. Impacts of nutrient
enrichment on coral reefs: new perspectives and impli-cations for coastal management and reef survival. Curr
Opin Environ Sustain [Internet]. 7:82–93. http://linkin ghub.elsevier.com/retrieve/pii/S1877343513001917
Daily G., editor. 1997. What are ecosystem services? In: Nature’s services: societal dependence on natural ecosys-tems. Washington, DC: Island Press.
Dallimer M, Irvine KN, Skinner AMJ, Davies ZG, Rouquette JR, Maltby LL, Warren PH, Armsworth PR, Gaston KJ. 2012. Biodiversity and the feel-good factor:
understanding associations between self-reported
human well-being and species richness. Bioscience [Internet]. 62:47–55
Das S, Crépin A-S. 2013. Mangroves can provide
protec-tion against wind damage during storms. Estuar Coast Shelf Sci. 134:98–107.
Dawson N, Martin A. 2015. Assessing the contribution of ecosystem services to human wellbeing: a disaggregated study in western Rwanda. Ecol Econ. 117:62–72. Defourny P, Schouten L, Bartalev S, Bontemps S, Caccetta
P, Di Bella C, Gond V, Hazeu GW, Heinimann A, Herold M, et al.2009. Accuracy assessment of a 300 m global land cover map: the GlobCover experience. Proceedings of 33rd Int Symp Remote Sens Environ Sustain Millenn Dev Goals; May 4-8; Stresa, Italy. Delphin S, Escobedo FJ, Abd-Elrahman A, Cropper W.
2013. Mapping potential carbon and timber losses from hurricanes using a decision tree and ecosystem services driver model. J Environ Manage. 129:599–607.
Eastman R.2012. Idrisi Selva. [place unknown]: Clark Labs. EEA. 2006. The changing faces of Europe’s coastal areas
[Internet]. Copenhagen: European Environment
Agency. http://www.eea.europa.eu/publications/eea_
report_2006_6
EPA. 2009. Valuing the protection of ecological systems and services A Report of the EPA science advisory board. Washington, DC: US Environmental Protection Agency.
ESA.2015. GlobCover [Internet]. [Accessed 2015 Apr 22].
http://due.esrin.esa.int/page_globcover.php
ESRI.2014. ArcGIS [Internet].www.esri.com
FAO. 2012. The state of food and agriculture [Internet]. Rome: Food and Agriculture Organization of the United
Nations. http://www.fao.org/docrep/017/i3028e/i3028e.
FAO.2013. Mozambique BEFS Country Brief. Rome: Food
and Agriculture Organization of the United Nations.
FAO, IIASA, ISRIC, ISSCAS, JRC. 2012. Harmonized
World Soil Database (version 1.2) [Internet]. http://
webarchive.iiasa.ac.at/Research/LUC/External-World-soil-database/HTML/
Feger C, Cabral P, Basque D, Levrel H, Chambolle M.2015.
Grand cycle de l’eau, évaluation des services
écosystémiques et aménagement du territoire : un pre-mier retour d’expérience. Tech Sci Méthodes [Internet]. 56–67. doi:10.1051/tsm/201509056
Frélichová J, Vačkář D, Pártl A, Loučková B, Harmáčková
ZV, Lorencová E.2014. Integrated assessment of ecosys-tem services in the Czech Republic. Ecosyst Serv [Internet]. 8:110–117. Available fromhttp://linkinghub. elsevier.com/retrieve/pii/S2212041614000217
Geneletti D.2013. Assessing the impact of alternative land-use zoning policies on future ecosystem services.
Environ Impact Assess Rev [Internet]. 40:25–35.
Available from http://linkinghub.elsevier.com/retrieve/ pii/S0195925512001035
Goldstein JH, Caldarone G, Duarte TK, Ennaanay D, Hannahs N, Mendoza G, Polasky S, Wolny S, Daily GC. 2012. Integrating ecosystem-service tradeoffs into
land-use decisions. Proc Natl Acad Sci [Internet]. 109:7565–7570. doi:10.1073/pnas.1201040109
Gómez-Baggethun E, Barton DN. 2013. Classifying and
valuing ecosystem services for urban planning. Ecol Econ [Internet]. 86:235–245. http://linkinghub.elsevier. com/retrieve/pii/S092180091200362X
Grêt-Regamey A, Weibel B, Bagstad KJ, Ferrari M,
Geneletti D, Klug H, Schirpke U, Tappeiner U. 2014.
On the effects of scale for ecosystem services mapping. Thrush S, editor. PLoS One [Internet]. 9:e112601. doi:10.1371/journal.pone.0112601
Halpern BS, Walbridge S, Selkoe KA, Kappel CV, Micheli
F, D’Agrosa C, Bruno JF, Casey KS, Ebert C, Fox HE,
et al. 2008. A global map of human impact on marine
ecosystems. Science (80-) [Internet]. 319:948–952.
doi:10.1126/science.1149345
Hamel P, Bryant BP.2017. Uncertainty assessment in eco-system services analyses: seven challenges and practical responses. Ecosyst Serv [Internet]. 24:1–15.http://linkin ghub.elsevier.com/retrieve/pii/S221204161630359X
Hassan RM, Scholes R, Ash N. 2005. Ecosystems and
human well-being: current state and trends: findings of the condition and trends working group [Internet].
[place unknown]:Island Press. Available from http://
books.google.fr/books?id=UFVmiSAr-okC
Hijmans RJ, Cameron SE, Parra JL, Jones PG, Jarvis A.
2005. Very high resolution interpolated climate surfaces for global land areas. Int J Climatol [Internet]. 25:1965–
1978. doi:10.1002/joc.1276
Hou Y, Burkhard B, Müller F.2013. Uncertainties in land-scape analysis and ecosystem service assessment. J
Environ Manage [Internet]. 127:S117–S131. Available
from http://linkinghub.elsevier.com/retrieve/pii/ S0301479712006263
INE. 2007. População total Censo de 2007. Instituto
Nacional de Estatística [Internet]. Available from
http://www.portaldogoverno.gov.mz/por/Mocambique/ Populacao
INE. 2015. População Projectada por distritos, Maputo
Cidade 2007-2040 [Internet]. Available from: http://
www.ine.gov.mz/estatisticas/estatisticas-demograficas- e-indicadores-sociais/populacao/projeccoes-da-populacao
INE. 2016a. Recenseamento Geral da População e
Habitação [Internet]. Available from: http://www.ine.
gov.mz/operacoes-estatisticas/censos/censo-2007/rgph-2007
INE.2016b. Relatório final do inquérito ao orçamento famil-iar - IOF-2014/15 [Internet]. Maputo, Mozambique. Available from: http://www.ine.gov.mz/operacoes-estatisti cas/inqueritos/inquerito-sobre-orcamento-familiar/rela torio-final-do-inquerito-ao-orcamento-familiar-iof-2014-15/view
Jacobs S, Dendoncker N, Martín-López B, Barton DN, Gomez-Baggethun E, Boeraeve F, McGrath FL, Vierikko K, Geneletti D, Sevecke KJ, et al.2016. A new valuation school: integrating diverse values of nature in resource and land use decisions. Ecosyst Serv [Internet]. 22:213–
220. [cited 2016 Dec 9]. Available fromhttp://linkinghub. elsevier.com/retrieve/pii/S221204161630479X
Jiang C, Li D, Wang D, Zhang L.2016. Quantification and assessment of changes in ecosystem service in the Three-River Headwaters Region, China as a result of climate variability and land cover change. Ecol Indic. 66. Kareiva P, Tallis H, Ricketts TH, Daily GC, Polasky S.
2011. Natural capital: theory and practice of mapping ecosystem services [Internet]. New York:OUP Oxford.
Available from http://www.amazon.fr/Natural-Capital-Practice-Ecosystem-Services/dp/0199589003
Kindu M, Schneider T, Teketay D, Knoke T.2016. Changes of ecosystem service values in response to land use/land
cover dynamics in Munessa–Shashemene landscape of
the Ethiopian highlands. Sci Total Environ [Internet]. 547:137–147. Available from http://linkinghub.elsevier. com/retrieve/pii/S0048969715312821
Kubiszewski I, Costanza R, Anderson S, Sutton P. 2017.
The future value of ecosystem services: global scenarios and national implications. Ecosyst Serv [Internet]. Available from http://linkinghub.elsevier.com/retrieve/ pii/S2212041617300827
Kubiszewski I, Costanza R, Dorji L, Thoennes P, Tshering K. 2013. An initial estimate of the value of ecosystem services in Bhutan. Ecosyst Serv. 13.
Lal R.1998. Soil erosion impact on agronomic productivity and environment quality. CRC Crit Rev Plant Sci [Internet]. 17:319–464. doi:10.1080/07352689891304249
Lamarque P, Quétier F, Lavorel S. 2011. The diversity of the ecosystem services concept and its implications for their assessment and management. C R Biol [Internet]. 334:441–449. Available from http://linkinghub.elsevier. com/retrieve/pii/S1631069110002866
Langbein W, Iseri K. 1995. Science in your watershed
-general introduction and hydrologic definitions.
Washington:United States Geological Survey. Available fromhttp://water.usgs.gov/wsc/
Lavorel S, Colloff MJ, Mcintyre S, Doherty MD, Murphy HT, Metcalfe DJ, Dunlop M, Williams RJ, Wise RM, Williams KJ.2015. Ecological mechanisms underpinning climate adaptation services. Glob Chang Biol [Internet]. 21:12–31. doi:10.1111/gcb.12689
Leh MDK, Matlock MD, Cummings EC, Nalley LL.2013.
Quantifying and mapping multiple ecosystem services change in West Africa. Agric Ecosyst Environ [Internet]. 165:6–18. Available from http://linkinghub. elsevier.com/retrieve/pii/S0167880912004343
Leh MDK, Matlock MD, Cummings EC, Nalley LL. 2016.
Corrigendum to“Quantifying and mapping multiple eco-system services change in West Africa. Agric Ecosyst Environ [Internet]. 221:285. Available fromhttp://linkin ghub.elsevier.com/retrieve/pii/S0167880916300470
Lindborg R, Gordon LJ, Malinga R, Bengtsson J, Peterson G, Bommarco R, Deutsch L, Gren Å, Rundlöf M, Smith HG. 2017. How spatial scale shapes the generation and management of multiple ecosystem services. Ecosphere [Internet]. 8:e01741. doi:10.1002/ecs2.1741
Lovelock CE, Ball MC, Martin KC, Feller C.2009. Nutrient
Enrichment Increases Mortality of Mangroves.
Thompson R, editor. PLoS One [Internet]. 4:e5600. doi:10.1371/journal.pone.0005600
Maes J, Egoh B, Willemen L, Liquete C, Vihervaara P, Schägner JP, Grizzetti B, Drakou EG, La Notte A, Zulian G, et al. 2012. Mapping ecosystem services for policy support and decision making in the European Union. Ecosyst Serv [Internet]. 1:31–39. Available from
h t t p : / / l i n k i n g h u b . e l s e v i e r . c o m / r e t r i e v e / p i i / S2212041612000058
Mann L, Tolbert V, Cushman J. 2002. Potential
environ-mental effects of corn (Zea mays L.) stover removal with emphasis on soil organic matter and erosion. Agric Ecosyst Environ [Internet]. 89:149–166. Available from
h t t p : / / l i n k i n g h u b . e l s e v i e r . c o m / r e t r i e v e / p i i / S0167880901001669
Martínez ML, Pérez-Maqueo O, Vázquez G, Castillo-Campos G, García-Franco J, Mehltreter K, Equihua M,
Landgrave R.2009. Effects of land use change on biodi-versity and ecosystem services in tropical montane cloud forests of Mexico. For Ecol Manage [Internet]. 258:1856–1863. Available from http://linkinghub.else vier.com/retrieve/pii/S0378112709001364
Martínez-Harms MJ, Balvanera P.2012. Methods for
map-ping ecosystem service supply: a review. Int J Biodivers Sci Ecosyst Serv Manag [Internet]. 8:17–25. doi:10.1080/ 21513732.2012.663792
Martins VN, Pires R, Cabral P.2012. Modelling of coastal vulnerability in the stretch between the beaches of Porto de Mós and Falésia, Algarve (Portugal). J Coast Conserv. 16:503–510.
Mascarenhas A, Ramos TB, Haase D, Santos R. 2015.
Ecosystem services in spatial planning and strategic environmental assessment-A European and Portuguese profile. Land Use Policy [Internet]. 48:158–169. McLaughlin A, Mineau P.1995. The impact of agricultural
practices on biodiversity. Agric Ecosyst Environ. 55:201–
212.
MICOA.2007. Estratégia Ambiental para o Desenvolvimento
Sustentável de Moçambique Aprovada na IXa Sessão do
Conselho de Ministro, de 24 de Julho de 2007. Maputo: Ministério para a Coordenação da Acção Ambiental.
MICOA.2014. CBD Fifth National Report, Convention on
Biological Biodiversity in Mozambique, Ministry for the Coordination of Environmental Affairs.
Millenium Assessment. 2003. Ecosystems and their
ser-vices. In Ecosyst Hum Well-being A Framew Assess. Island Press; p. 49–70
Mooney HA, Cropper A, Capistrano D, Carpenter SR, Chopra K, Dasgupta P, Dietz T, Kumar A, Hassan R,
Kasperson R, et al. 2005. Millennium Ecosystem
Assessment Synthesis Report A Report of the Millennium Ecosystem Assessment.
Motta H, Pereira M, Gonçalves M, Ridgway T, Schleyer M
2002. Coral reef monitoring in Mozambique. II: 2000
report. MICOA/CORDIO/ORI/WWF.:31.
Mudaca JD, Tsuchiya T, Yamada M, Onwona-Agyeman S.
2015. Household participation in Payments for
Ecosystem Services: a case study from Mozambique. For Policy Econ. 55:21–27.
Nagabhatla N, Saimone F, Juizo D, Masiyandima M.2008.
Seasonality dynamics for investigating wetland agricul-ture nexus and its ecosystems service values in Chibuto, Mozambique. In: Humphreys E, Bayot RS, van Brakel M, Gichuki F, Svendsen M, White D, Wester P, Huber-Lee A, Cook S, Douthwaite B, et al. editors. Proc CGIAR Chall Progr Water Food 2nd Int Forum Water Food.
Addis Ababa, Ethiopia: International Water
Management Institute; p. 5.
NASA. 2012. ASTER Global Digital Elevation Map
[Internet]. Available from: http://asterweb.jpl.nasa.gov/ gdem.asp
Nelson E, Mendoza G, Regetz J, Polasky S, Tallis H, Cameron D, Chan KMA, Daily GC, Goldstein J,
Kareiva PM, et al. 2009. Modeling multiple ecosystem
services, biodiversity conservation, commodity produc-tion, and tradeoffs at landscape scales. Front Ecol Environ [Internet]. 7:4–11. doi:10.1890/080023
Newbold T, Hudson LN, Hill SLL, Contu S, Lysenko I, Senior RA, Börger L, Bennett DJ, Choimes A, Collen B, et al.2015. Global effects of land use on local terrestrial biodiversity. Nature [Internet]. 520:45–50. doi:10.1038/ nature14324
Nicholls RJ, Tol RSJ. 2006. Impacts and responses to sea-level rise: a global analysis of the SRES scenarios over the
twenty-first century. Philos Trans R Soc A Math Phys
Eng Sci [Internet]. 364:1073–1095. doi:10.1098/
rsta.2006.1754
Nunes P, Ghermandi A2015. Understanding and valuing
the marine ecosystem services of the Northern Mozambique Channel. Consultancy report commis-sioned for the Northern Mozambique Channel initiative. WWF International. [place unknown].
Olsson P, Folke C, Berkes F.2004. Adaptive comanagement for building resilience in social-ecological systems.
Environ Manage [Internet]. 34. doi:
10.1007/s00267-003-0101-7
IPCC.2014. Climate change 2014: synthesis report. In Core Writing Team, Pachauri RK, Meyer LA, eds. Contribution of working groups I, II and III to the fifth assessment report of the intergovernmental panel on climate change. Switzerland:Geneva.
Pereira H, Domingos T, Vicente L, Proença V. 2009.
Ecossistemas e Bem-Estar Humano Avaliação para
Portugal do Millennium Ecosystem Assessment
(Ecosystems and Human Well-Being: rating for
Portugal’s Millenium Ecosystem Assessment. [place
unknown]: Escolar Editora.
Polasky S, Nelson E, Pennington D, Johnson KA.2011.
The impact of land-use change on ecosystem services, biodiversity and returns to landowners: a case study in the state of Minnesota. Environ Resour Econ. 48:219–242.
Portela R, Rademacher I. 2001. A dynamic model of
pat-terns of deforestation and their effect on the ability of the Brazilian Amazonia to provide ecosystem services. Ecol Modell. 143:115–146.
Posner S, Verutes G, Koh I, Denu D, Ricketts T. 2016.
Global use of ecosystem service models. Ecosyst Serv. 17:131–141.
Power AG, Aizen MA, Garibaldi LA, Cunningham SA, Klein AM, Andow DA, Badgley C, Moghtader J,
Quintero E, Zakem E, et al. 2010. Ecosystem services
and agriculture: tradeoffs and synergies. Philos Trans R Soc Lond B Biol Sci [Internet]. 365:2959–2971. [cited
2016 Jul 20]. Available from http://www.ncbi.nlm.nih.
gov/pubmed/20713396
Raudsepp-Hearne C, Peterson GD.2016. Scale and ecosys-tem services: how do observation, management, and
analysis shift with scale—lessons from Québec. Ecol
Soc [Internet]. 21:art16. Available from http://www.eco logyandsociety.org/vol21/iss3/art16/
República de Moçambique. 2015a. Estratégia e plano de
acção nacional para restauração de mangal 2015-2020. Ministério da Terra, Ambiente e Desenvolvimento Rural, Centro de Desenvolvimento Sustentável para as Zonas Costeiras.:43.
República de Moçambique. 2015b. Estratégia Nacional de
Adaptação e Mitigação de Mudanças Climáticas 2013-2025, Ministério para a Coordenação da Acção
Ambiental [Internet].:71. Available from: http://www.
cgcmc.gov.mz/pt/politicas-estrategias/94-estrategia- nacional-de-adaptacao-e-mitigacao-de-mudancas-climaticas
República de Moçambique. 2016. Comunicado do
Secretariado do Conselho de Ministros, 9 de Fevereiro de 2016 [Internet]. Available from:http://www.portaldo governo.gov.mz/por/content/download/5330/38010/ver sion/1/file/COMUNICADO+DA+3.a+SOCM-2016.pdf Roose E.1996. Land husbandry: components and strategy.
Rome: Food and Agriculture Organization of the United Nations.
Schröter M, Albert C, Marques A, Tobon W, Lavorel S, Maes J, Brown C, Klotz S, Bonn A.2016. National Ecosystem Assessments in Europe: a review. Bioscience [Internet]. biw101. Available from doi:10.1093/biosci/biw101
SETSAN. 2016. Secretariado Técnico de Segurança
Alimentar e Nutricional. Maputo: Secretariado Técnico de Segurança Alimentar e Nutricional.
Swetnam RD, Fisher B, Mbilinyi BP, Munishi PKT, Willcock S, Ricketts T, Mwakalila S, Balmford A,
Burgess ND, Marshall AR, et al. 2011. Mapping
socio-economic scenarios of land cover change: a GIS method to enable ecosystem service modelling. J Environ Manage [Internet]. 92:563–574. Available from http:// linkinghub.elsevier.com/retrieve/pii/S0301479710002926
Tallis H, Polasky S.2009. Mapping and valuing ecosystem services as an approach for conservation and natural-resource management. Ann N Y Acad Sci [Internet]. 1162:265–283. doi:10.1111/j.1749-6632.2009.04152.x
Tallis H, Polasky S. 2011. Assessing multiple ecosystem services: an integrated tool for the real world. In Natural Capital Project[Internet]. Oxford University Press; p. 34–50. Available from http://www.oxfordscho larship.com/view/10.1093/acprof:oso/9780199588992. 001.0001/acprof-9780199588992-chapter-3
Tallis H, Rickets T, Guerry A, Wood S, Sharp R, Nelson E,
Chaplin-Kramer R, Ennaanay D, Vogl AL2015. InVEST
3.1.1 User’s Guide: integrated valuation of environmen-tal services and tradeoffs. The Natural Capienvironmen-tal Project [Internet]. Available from:http://ncp-dev.stanford.edu/~ dataportal/invest-releases/documentation/current_ release/
Tolessa T, Senbeta F, Kidane M.2017. The impact of land use/land cover change on ecosystem services in the cen-tral highlands of Ethiopia. Ecosyst Serv [Internet]. 23:47–54. Available from http://linkinghub.elsevier. com/retrieve/pii/S2212041616301103
Trabucco A, Zomer RJ.2009. Global Aridity Index (Global-Aridity) and Global Potential Evapo-Transpiration (Global-PET). Geospatial Database [Internet]. Available fromhttp://www.csi.cgiar.org
UNDP. 2015. Human Development Reports [Internet].
[cited 2016 May 23]. Available from: http://hdr.undp.
org/en/content/human-development-index-hdi
UNISDR.2016. DesInventar, Disaster Information System, United Nations Office for Disaster Risk Reduction [Internet]. Available from:http://www.desinventar.net/
Van Zanten BT, Van Beukering PJH, Wagtendonk AJ.
2014. Coastal protection by coral reefs: a framework
for spatial assessment and economic valuation. Ocean Coast Manag. 96:94–103.
Von Maltitz GP, Gasparatos A, Fabricius C, Morris A,
Willis KJ. 2016. Jatropha cultivation in Malawi and
Mozambique: impact on ecosystem services, local human wellbeing and poverty alleviation. Ecol Soc. 21. Wang Z, Mao D, Li L, Jia M, Dong Z, Miao Z, Ren C, Song
C. 2015. Quantifying changes in multiple ecosystem
services during 1992?2012 in the Sanjiang Plain of
China. Sci Total Environ [Internet]. 514:119–130.
Available from http://linkinghub.elsevier.com/retrieve/ pii/S0048969715000108
Wangai PW, Burkhard B, Müller F. 2016. A review of
studies on ecosystem services in Africa. Int J Sustain
Built Environ [Internet]. 5:225–245. Available from
h t t p : / / l i n k i n g h u b . e l s e v i e r . c o m / r e t r i e v e / p i i / S2212609015300935
Wischmeier S. 1978. Predicting rainfall erosion losses: A guide to conservation planning [Internet]. Washington,
DC:U.S. Department of Agriculture. Available from
http://topsoil.nserl.purdue.edu/usle/AH_537.pdf
Wong C, Roy M, Duraiappah AK.2005. Focus on
mozam-bique. In: Connecting poverty and ecosystem services: a series of seven country scoping studies [Internet]. Winniepeg: International Institute for Sustainable
Development. Available from https://www.iisd.org/pdf/
2005/economics_poverty_mozambique.pdf
Woodhouse P. 2014. Agricultura, Pobreza e a Receita do
PARP. In: Brito L, Castel-Branco CN, Chichava S,
Francisco A, editors. Desafios para Moçambique, 2012 (Vol. 2014). Maputo: IESE; p. 165–183.
World Bank.2016. Mozambique [Internet]. [Accessed 2016
Mar 19]. http://data. worldbank.org/country/
mozambique
Zhang Y, Holzapfel C, Yuan X. 2013. Scale-dependent
Ecosystem Service. In Wratten S, Sandhu H, Cullen R, Costanza R, editors. Ecosyst Serv Agric Urban Landscapes [Internet]. Oxford: A John Wiley & Sons;p. 105–121. Available from doi:10.1002/9781118506271.ch7