ABSTRACT: Soils of a large tropical area with differentiated landscapes cannot be treated uni-formly for ecological applications. We intend to develop a framework based on physiography that can be used in regional applications. The study region occupies more than 1.1 million km2 and is located at the junction of the savanna region of Central Brazil and the Amazon forest. It includes a portion of the high sedimentary Central Brazil plateau and large areas of mostly peneplained crystalline shield on the border of the wide inner-Amazon low sedimentary plain. A first broad subdivision was made into landscape regions followed by a more detailed subdivi-sion into soil regions. Mapping information was extracted from soil survey maps at scales of 1:250000-1:500000. Soil units were integrated within a homogenized legend using a set of selected attributes such as taxonomic term, the texture of the B horizon and the associated vegetation. For each region, a detailed inventory of the soil units with their area distribution was elaborated. Ten landscape regions and twenty-four soil regions were recognized and delineated. Soil cover of a region is normally characterized by a cluster composed of many soil units. Soil diversity is comparable in the landscape and the soil regions. Composition of the soil cover is quantitatively expressed in terms of area extension of the soil units. Such geographic divisions characterized by grouping soil units and their spatial estimates must be used for regional eco-logical applications.
Keywords: Brazil, Rondônia, Mato Grosso, regional soil diversity
Introduction
The Amazon Basin is usually regarded as homo-geneous environment, having uniform wet climates, similar soils, and uniform wet forest biomes (Bernoux and Volkoff, 2006; Cerri et al., 2007). However, at sub-continental scale, it is not entirely homogenous, particu-larly with respect to soils. The soil cover appears homo-geneous at major taxonomic groups, but this overlooks the substantial heterogeneity that is documented by the Brazilian soil exploratory maps published to date (Pro-jeto Radambrasil, 1973-1986; Embrapa, 1981). In these maps, mapping units include not only various subdivi-sions of the major soil taxonomic groups but also several other associated secondary soil types. Therefore, this area involves great soil spatial variability, mainly regard-ing to soil texture which is highly related to ecological processes. It was not highlighted in previous ecological modeling studies, mainly those related to soil organic matter dynamics (Bernoux et al., 2002; Batjes and Dijk-dynamics (Bernoux et al., 2002; Batjes and Dijk-shoorn, 1999; Batjes, 2005; Cerri et al., 2007; Cochrane and Cochrane, 2006; Holmes et al., 2006; Moraes et al., 1995; Schaefer et al., 2008).
As soils are closely linked to its local and regional physiography (Webster, 2000; Heuvelink and Webster, 2001), the soil properties in tectonically stable parts of South America, which developed within the uppermost part of old, highly weathered bed rock and have under-gone multiple important transformations and transports (Balan et al., 2005; Horbe and Costa, 2005), need to be taken into account by considering the regional
physi-cal environment in addition to their general taxonomic definition. Regions having homogeneous geomorphic sequence contain specific soil associations and analo-gous soils. Therefore, soils must be spatially grouped according to geomorphic or geological criteria and their properties diversity should then be assessed within each regional subdivision.
In order to carry out regional studies successfully, attention should be paid to the soils by using a detailed classification that does not reduce the complexity of the original maps and the geographical location. Therefore, the objective of this research was to identify relevant in-formation from the soil maps of the states of Rondônia and Mato Grosso (1:250000 scale) along with geological and geomorphologic maps in order to develop regional-scale applications. Ecological regionalization methods were discussed in an array of studies (Omernik and Bai-ley, 1997; Loveland and Merchant, 2004; Mackey et al., 2008; Snelder et al., 2010); and they may provide a frame-work to generate landscape and soil regionalization.
Materials and Methods
Rondônia-Mato Grosso Region Characterization
The Rondônia-Mato Grosso region extends from Latitude 8° - 18° S. It conforms to the south-western border of the Amazon region (Figure 1). The entire area is considered to be part of the Amazon for legal and ad-ministrative purposes, but in reality, it is located at the junction of the Amazon forest and the Central Brazil sa-vanna region (Figure 2). Rondônia has an area of 0.23
Received October 07, 2010 Accepted January 17, 2012
1Institut de Recherche pour le Développement (IRD), BP 64501 – 3439 – Cedex 5 – Montpellier – France. 2USP/CENA – Lab. de Biogeoquímica Ambiental, C.P. 96 – 13416-000 – Piracicaba, SP – Brasil. 3Instituto Federal de Alagoas – Campus Piranhas, Av. Sergipe, s/n. – Piranhas, AL – Brasil. 4USP/ESALQ – Depto. de Ciência do Solo, C.P. 09 – 13418-900 – Piracicaba, SP – Brasil. *Corresponding author <[email protected]>
Edited by: Jussara Borges Regitano / Daniel Scherer de Moura
Landscape and soil regionalization in southern Brazilian Amazon and contiguous
Boris Volkoff1,2, Francisco Fujita de Castro Mello2, Stoécio Malta Ferreira Maia3, Carlos Eduardo Pellegrino Cerri4*
million km2, and the state of Mato Grosso 0.9 million
km2, totalling 1.13 million km2 (IBGE, 2011) and
repre-senting 13.2 % of the Brazilian territory. A detailed and individualized analysis of its climate, vegetation, geol-ogy, geomorpholgeol-ogy, and soils can be found in the re-gional survey reports of the Radam project (Projeto Pro-jeto Radambrasil, 1973-1986).
At a broad regional scale, the studied area consists of two stepped land surfaces with significant vertical separation, which is the result of successive cycles of erosion (King, 1956; King, 1962). Extensive tablelands (called Chapadas) and plateaus with elevation ranging from 800 to 1200 m in the sedimentary Phanerozoic
Paraná Basin and Parecis Basin cover much of central and southern Mato Grosso and extend to the northeast-ern part of Rondônia. Exposed rocks are generally Cre-taceous sandstone. Folded rocks consisting of interbed-ded layers of schist, quartzite, and metacarbonate rocks from the Pre-Cambrian Brazilian (i.e., Neoproterozoic) orogenic belt (i.e., Paraguay-Araguaia Belt) are exposed between the Parecis and Paraná basins and along their eastern borders. The central and northern Rondônia and northern Mato Grosso plains and hills form a complex mosaic of peneplain surfaces interspersed with rocky hills, including a range of steep sandstone hills that are remnants of the Precambrian clastic covers of the Brazil-ian shield.
The Precambrian Guapore shield is exposed to the north in a western depression along the Guaporé-Mamoré-Madeira Rivers. Yet, in the south of Mato Gros- Rivers. Yet, in the south of Mato Gros-so state, an extensive Holocene alluvial plain, the “Pan-tanal”, shares the border with Bolivia along the Paraguay River. To the east, a flat plain covered by Cenozoic De-posits (Araguaia formation) and eastward by Holocene alluvial deposits, extends along the Araguaia River.
Annual rainfall varies between 1250 and 2000 mm. The northwest has a more humid climate with a 9 to 10 month wet season and a mean temperature of over 23.5 °C. This climate shifts into a drier tropical seasonal cli-mate in the southern and south-eastern parts with 1250 to 1500 mm precipitation, a 6 to 8 months wet season with an average monthly temperature of over 23.5 °C and a dry period from May through September.
Native vegetation cover ranged from: evergreen to semi-evergreen and almost evergreen seasonal forests; semi-deciduous and deciduous seasonal forests; wetland savannas and dry savannas (called “Cerrados” in Brazil); and tropical swamp (Figure 2). Throughout its range, Cerrado vegetation varied from treeless grassland (“cam- cam-po limcam-po”) to a tall closed forest (called “Cerradão”).
Sources and basic information
Spatial data were extracted from SEPLAN-RO (1998) and SEPLAN-MT (2002) as sets of digital files that included hypsometry, geology, geomorphology, hydrog-raphy, vegetation, and soil maps at scales of 1:250000 and 1:500000.
For Mato Grosso, a single soil layer was derived by assembling 66 soil maps (1:250000 scale). Because most of the soil units of each map were similarly named but differed in terms of soil content, all units were main-tained and coded as defined in the original source map. The soil components of each map unit were character-ized by their texture, vegetation, slope class attributes, and Brazilian taxonomic type, which is a member of a hierarchical system with a Great group name and addi-tional characteristics, such as color and base saturations (Projeto Radambrasil, 1973-1986).
For Rondônia, the study used a single map (Co-chrane and Co(Co-chrane, 1998; SEPLAN-RO, 1998), which provided spatial units delineated on Landsat-5 TM satel-Figure 1 – Location map.
lite images at the 1:250000 scale. They were differentiat-ed by a landform type comprisdifferentiat-ed of various topographic elements that were characterized by one soil association. A Brazilian taxonomic classification of the soil compo-nents and their relative proportions in the associations were available from digital tables (SEPLAN-RO, 1998). Texture, slope, and vegetation parameters were not di-rectly referenced. Slope and vegetation attributes and soil texture were assessed through a soil profile data-base. It should be noted that on the Rondônia soil map, map units may consist of a relatively large number of soil components.
Delineation of geographic zones (Landscape and Soil Regions)
The landscape regions were first roughly delimited based on geological, geomorphologic, and topographic data (Projeto Radambrasil, 1973-1986; SEPLAN-RO, 1998; SEPLAN-MT, 2002). Their boundaries were then improved by crossing the soil map using a geographic information system (GIS) tool (ESRI ArcGIS 9™). The polygons of the soil layers were not divided. Additional-ly, landscape regions were divided into smaller regions, called “soil regions”. Soil regions are normally related to variations in the landform or the lithology within the landscape regions, and they were delineated by the same technique used for landscape regions. The validity of the proposed divisions was then verified through extensive field controls along main roads crossing from northern to southern Rondônia and southwest to northeast Mato Grosso and along an east-west transect in northern Rondônia and northern Mato Grosso.
Homogenization of soil map legends
As previously stated, map units of the available soil maps were created as groupings of soil units defined by the soil taxonomic name plus attributes related to the texture phase, vegetation, and slope gradient. On the Mato Grosso maps, all attributes were explicitly marked in the map legend. Attributes were not present in the Rondônia legend but were extracted from additional digi-tal tables (SEPLAN-RO, 1998). For this study’s purpose, a single legend was built that included the vegetation and texture phase without the slope gradient. It was assumed that the slope factor would be implicit in the landscape definition. Some of the attributes used in soil taxonomy, such as Ta, Tb (i.e., high activity and low activity clay), or Horizon A types were eliminated because they were considered not to have significance at the regional scale for the studied zone.
A single list of vegetation types was developed summarizing the vegetation classes in the Mato Grosso and Rondônia soil legends. For Rondônia, vegetation types were assigned to the terrain components where the soils are located. The list was greatly simplified; it considered only seven main types of vegetation and ex-cluded all transitional forms. The resulting list of vegeta-tion types identified 28 types; this number is relatively
high due to the many associations on the Rondônia map. Soil textures, which were missing from the Rondônia map, were extracted from the soil profile database. They were ascribed to one of the four classes (i.e., sandy, me-dium, clayey, and heavy clayey textures) defined accord-ing to Projeto Radambrasil (1973-1986), usaccord-ing B Horizon B textural analysis result.
Analysis of geographic zone soil content
For each geographic region, all polygons were ex-tracted from soil layers using a GIS tool (ESRI ArcGIS 9™). Each soil component was reclassified according to the new classification. The areas of each polygon were extracted individually, and they were then summarized for each geographic region. This procedure was applied first by using a complete classification with vegetation attributes and then using a more simplified classification without vegetation attributes. In the text, we use the term “soil unit” to designate soil types characterized by their taxonomic name and the texture of their B horizon without reference to their associated vegetation type.
Results
Landscape regions
Ten landscape regions were delimited based on mean elevation and similarities in land-surface form and geological characteristics (Figure 3; Table 1). The north-ern Rondônia Peneplain consists of 69 soil units (Table 1). There is no dominant soil unit (Figure 4). The five most represented soil units occupy 50 % of the total region area. Regarding soil cover, the northern Mato Grosso Pe-neplain is very homogeneous and clearly differentiated from the North Rondônia Peneplain. More than 80 % of the region surface is covered by a single dominant soil unit (Figure 4).
In the northeastern Mato Grosso Peneplain, a sin-gle soil unit occupies 50 % of the area. It is associated with 23 other soil units (Table 1). At least five of them
are significantly represented (Figure 4). Due to differenc-es in parent rocks, slope and incipient pediment devel-opment, soils of the Rondônia and North Mato Grosso Uplands vary considerably, and the total number of soil units is very large at 100 units (Table 1). Note that if a topographic parameter was considered in the definition of the soil units, the number of soil units should be sig-nificantly increased in this region because similar soil types will probably occur on both plain surfaces and the slopes of the rounded hills. In addition, there is not one but many dominant soils. The top seven soil units of this region account for only 50 % of the region area (Figure 4). The Parecis Sedimentary Basin is a wide chapada. It has a fairly large number of soil units (65), but it is almost completely covered by five significantly repre-sented soil units (Figure 4).
The Guapore Depression is a very heterogeneous peneplain with 86 soil units (Table 1). None are signifi-cantly represented (Figure 4). This can be explained by the large latitudinal extension from the rain forest in the north to the savannas in the south and by the regular oc-currence of large areas of poorly drained lowlands. The Araguaia Depression is another heterogeneous region (Figure 4) with similar characteristics; however, there are only two main soil units that are representative of the widespread, poorly drained lowlands of this region.
The Cuiaba Paranatinga Depression region com-prises leveled areas in the west, a central mountainous area, and hilly eastern parts, which explains the soil cov-er complexity (with 86 soil units) and the absence of any clearly prevailing soil types (Figure 4). The Paraná Sedi-mentary Basin region is a chapada, much like the Pare-cis Sedimentary Basin region. In this region, the top soil units are not as important as in the Parecis Sedimentary Basin region (Figure 4). This difference is explained by the occurrence of soils developed from exposed underly-ing Paleozoic layers of the sedimentary basin on eroded parts of the plateau. In the Pantanal Depression, only 2 soil units among the 32 listed account for almost 75 % of the surface (Figure 4).
Overall, the soil cover of a landscape region is usu-ally an association of many soil units. One or several major soil units may characterize a relatively high pro-portion (up to 75 %) of an area. These top units are as-sociated with a broad range of secondary soil units.
Soil regions
Each landscape region was divided into physio-graphically homogenous regions, called “soil regions”. Twenty-four soil regions were defined (Figure 5; Table 2). Some were designated with the term “pediplain”, which has a more restricted definition than the term used for landscape regions. A pediplain is comprised predomi-nantly of coalescing pediment surfaces. It is a land sur-face with low relief that is widely covered by a residual or transported mantle (King, 1962). For example, land-scape regions 1 and 2 were divided according to topogra-phy, and region 4 was divided according to topography and lithology. Obviously, the new regions obtained were not perfectly homogeneous, requiring further subdivi-sions into even smaller regional units. Table 3 lists some characteristics of the soil regions.
Although we expected the soil regions to be more homogenous, this was not the case. There was no sig-nificant decrease in the number of soil units in the large landscape regions compared with the smaller soil regions (Tables 1 and 2). A single, largely dominant soil unit was
Table 1 – The Landscape regions (total and relative area, number of soil units).
Landscape regions Area PROP* Soil units** km2 %
1. North Rondônia Peneplain 93,131 8 69 2. North Mato Grosso Peneplain 111,451 10 40 3. Northeastern Mato Grosso Peneplain 29,059 3 24 4. Rondônia and North Mato Grosso Uplands 156,779 14 100 5. Parecis Sedimentary Basin 339,182 30 65
6. Guaporé Depression 95,892 8 86
7. Araguaia Depression 71,927 6 30
8. Cuiabá Paranatinga Depression 93,823 8 51 9. Paraná Sedimentary Basin 97,451 9 42
10. Pantanal Depression 50,483 4 32
*Percent total Rondônia-Mato Grosso area. **Total number of soil units in the landscape region.
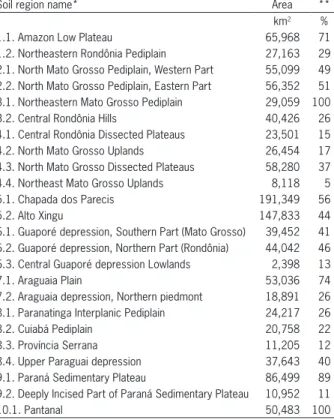
Table 2 – Soil Region list with total and relative area.
Soil region name* Area **
km2 %
1.1. Amazon Low Plateau 65,968 71
1.2. Northeastern Rondônia Pediplain 27,163 29 2.1. North Mato Grosso Pediplain, Western Part 55,099 49 2.2. North Mato Grosso Pediplain, Eastern Part 56,352 51 3.1. Northeastern Mato Grosso Pediplain 29,059 100
3.2. Central Rondônia Hills 40,426 26
4.1. Central Rondônia Dissected Plateaus 23,501 15 4.2. North Mato Grosso Uplands 26,454 17 4.3. North Mato Grosso Dissected Plateaus 58,280 37 4.4. Northeast Mato Grosso Uplands 8,118 5
5.1. Chapada dos Parecis 191,349 56
5.2. Alto Xingu 147,833 44
6.1. Guaporé depression, Southern Part (Mato Grosso) 39,452 41 6.2. Guaporé depression, Northern Part (Rondônia) 44,042 46 6.3. Central Guaporé depression Lowlands 2,398 13
7.1. Araguaia Plain 53,036 74
7.2. Araguaia depression, Northern piedmont 18,891 26 8.1. Paranatinga Interplanic Pediplain 24,217 26
8.2. Cuiabá Pediplain 20,758 22
8.3. Província Serrana 11,205 12
8.4. Upper Paraguai depression 37,643 40 9.1. Paraná Sedimentary Plateau 86,499 89 9.2. Deeply Incised Part of Paraná Sedimentary Plateau 10,952 11
10.1. Pantanal 50,483 100
Table 3– Sketch characteristics of the Soil Regions (SR: soil region).
SR Landscape Vegetation Lithology
1.1 Peneplain Forest Basement and Quaternary
1.2 Peneplain Forest Basement and Proterozoic sediments
2.1 Peneplain Forest Basement
2.2 Peneplain Forest Basement
3.1 Peneplain Cerradão (Forest) Basement
4.1 Hills Forest Basement mainly and Paleozoic sediments
4.2 Dissected plateau Forest and Cerrado Basement. Proterozoic and Paleozoic sediments
4.3 Hills Forest Basement
4.4 Dissected plateau Forest and Cerrado Proterozoic mainly and Proterozoic sediments
4.5 Plateau Forest Basement
5.1 Plateau Forest and Cerrado Mesozoic sediments
5.2 Plateau Forest Mesozoic sediments
6.1 Peneplain Forest Quaternary. Basement and Mesozoic sediments
6.2 Peneplain Forest Quaternary and Basement
6.3 Peneplain Cerrado* Quaternary
7.1 Plain Cerrado Quaternary
7.2 Hills and Pediplain Cerrado Neoproterozoic folded belt
8.1 Peneplain Cerrado Neoproterozoic folded belt
8.2 Peneplain Cerrado Neoproterozoic folded belt
8.3 Hills Cerrado Neoproterozoic folded belt
8.4 Peneplain Forest Basement and Quaternary
9.1 Plateau Cerrado Paleozoic and Mesozoic sediments
9.2 Dissected plateau Forest Paleozoic and Mesozoic sediments
10.1 Plain Forest and Cerrado Quaternary
*Poorly drained.
rarely observed, and consequently, several soil units were necessary to cover the majority of a region (Table 4). The finding that three to five top soils characterized the soil cover of a soil region should not have been so common across this entire landscape region. Therefore, the division of landscape regions into soil regions did not considerably decrease the spatial soil variability. At the soil region level, diversity remains high, but soil groups should change considerably.
An additional subdivision of the soil regions did not significantly modify spatial heterogeneity. Soil sub-regions can be defined based on minor variations in rock type, the degree of pediplenation, and/or the incidence of specific soil characteristics such as the occurrence of extensive ferricretes. Similar to the division of landscape regions into soil regions, the number of soil units may decrease, but this is not a general rule. The dominant soil units change only if the soil units are not homoge-neously distributed within the regions. As such, some units that rarely appear in a large region become domi-nant in a smaller region. The decrease occurs mainly for sedimentary inclusions.
Discussion
the 1:250000-1:500000 scales; the findings indicate that a single dominant soil unit is found in the northern Mato Grosso Peneplain, which corresponds to more than 80 % of this region’s total area. Usually, at least four soil units are required to represent 75 % of an area in relatively homogeneous sedimentary regions, such as the Parecis Plateau or the Pantanal Depression. In other regions, the number of soil units increases significantly. A maximum number is found in the Rondônia and Mato Grosso Up-lands regions.
The landscape regions are not homogeneous areas, as some areas may have enough particularities to differ-entiate them from the dominant attributes that charac-terize the region. Thus, landscape regions were divided according to specific or secondary characteristics related to topography, geomorphic evolution, or geology. Each region might have had different geomorphic and soil evolution traits as a result of a) its location (e.g., pied-monts bordering depressions), b) pediplenation grade variation, or c) differences in structure and rock types. These sub-regions (i.e., the soil regions) were expected to have less soil variability and, consequently, a smaller range of soil units.
There were 24 soil regions, with areas ranging from 10,000 to 200,000 km2 (Table 2). The soil cover of
each soil region consisted of a variety of soil units, the number of which always remained high because the re-gion encompassed several mapping units. A single soil unit may represent more than 75 % of the area, but not as a general rule. Usually, the most common soil had an area that was frequently less than 20 % of the total area; in no case did this value exceed 50 % (Figure 4). There are variable amounts of less common soil units and a very large spectrum of non-representative soil units. Al-though their individual area is very small, their overall surface cannot be disregarded. There is no simple way to characterize this multiplicity of apparently random occurrences.
The number of soil units does not seem to be re-lated to the size of the area. Comparable spatial hetero-geneity was observed at the landscape region and soil re-gion levels. This can be explained by normal soil changes in the landscape along topo-sequences due to slope dif-ferentiation (i.e., color and texture difdif-ferentiations) and by variability in the parent material, which was clearly expressed in crystalline basement areas. In soil regions, soil cover was slightly more homogeneous in terms of the number and hierarchy of soil types. In these cases, there was a more specific spatial arrangement of soil components along with either the emergence or absence of certain prevailing soil types.
Overall, an entire soil region cannot be repre-sented by a single soil unit. In general, soil cover is a set of soil units; the composition of these units can be quantitatively expressed in terms of area (Lin et al., 2005; Phillips and Marion, 2007). Additional subdivi-sions into smaller zones do not greatly modify spatial heterogeneity (Cerri et al., 2004).
The number of soil units necessary for a satis-factory representation of a regional area of size 10000 to 50000 km2 is normally large, at about four-times to
six-times (and sometimes up to ten-fold more) as many units compared to some soil regions. This implies that the spatial characterization of any region, from the high-est to the lowhigh-est subdivision, requires data pertaining on a variable number of soil types that make up its natu-ral soil cover. This characterization is possible because the number and weight of the relevant soil types can be evaluated (Caniego et al., 2006).
At different spatial levels, various regional soil properties, particularly those related to the definition of the basic soil units (i.e., texture and base saturation), are obtained directly from map data. These properties are assumed to be spatially homogeneous. Soil units can be used such that the spatial estimate of the mean regional soil property is that of their total area-weighted values (Bernoux et al., 2002). However, although they are con-sidered to be spatially homogeneous, these properties vary significantly because the definition of the classes is very broad. For accurate estimates of the properties of each class and the inter-classes comparisons, legend information is not enough. These accurate estimates must be obtained through the statistical analysis of separate sets of selected profiles from the database, which are located in the region and grouped accord-ing to the same classification as the soil units (Brejda et al., 2001). Because of the large number of soil units within a region and the broad inner-class spatial varia-tion, a large database is required; however, this is not always available, especially for remote regions (Batjes et al., 2007). Other properties, such as those linked to biological processes, are not explicitly contained within soil maps but are extracted from related databases. As they are spatially very heterogeneous, the variability within a single soil type is usually high and can equal the variability of the whole region (Rasmussen, 2006). Their characterization by a mean value and a defined uncertainty is much more difficult, and it requires a higher number of observations (Laurance et al., 1999; Galbraith et al., 2003; Amichev and Galbraith, 2004; Maia et al., 2009).
Conclusion
In tectonically stable tropical zones, such as the southern edge of the Amazon Basin, the long-term evolu-tion of landforms and soils has generated local and re-gional heterogeneities that are masked by the relative uniformity of the present bioclimatic environment.
A useful hierarchical classification of land in land-scape regions, soil regions, and soil sub-regions can be es-tablished based on physiographic factors. This classifica-tion is justified because of the direct positive correlaclassifica-tion between physiographic factors and the associated soils. The regionalization of the soil data extracted from existing traditional semi-detailed soil maps can serve as a valuable tool for regional-scale environment applications.
The regionalization of the soil units extracted from the soil maps provides a framework for the stratification of spatial soil data using a new hierarchical classification to assess the stratification of the basic soil database. This makes it possible to select the most relevant stratum to study the environment properties of interest.
Acknowledgements
This work was supported by Fundação de Amparo a Pesquisa do Estado de São Paulo (FAPESP) projects number 05/59012-1 and 2005/60255-6. We thank Secre-We thank Secre-taria de Planejamento do Estado de Rondônia (SEPLAN-RO) and Secretaria de Planejamento do Estado do Mato Grosso (SEPLAN-MT) for making available the data from their Zoneamentos Sócio Econômico Ecológicos. We acknowledge CNPq for the fellowship provided to the last author (PQ-1D). We also thank Dr. Martial Ber-noux, Dr. Brigitte J. Feigl and Dr. Carlos Clemente Cerri for their comments and suggestions during the work de-velopment.
References
Amichev, B.Y.; Galbraith, J.M. 2004. A revised methodology for estimation of forest soil carbon from spatial soils and forest inventory data sets. Environmental Management 33: 74–86.
Balan, E.; Allard, T.; Fritsch, E.; Sélo, M.; Falguères, C.; Chabaux, F.; Pierret, M.-C.; Calas, G. 2005. Formation and evolution of lateritic profiles in the middle Amazon basin: Insights from radiation-induced defects in kaolinite. Geochimica et Cosmochimica Acta 69: 2193–2204.
Batjes, N.H. 2005. Organic carbon stocks in the soils of Brazil. Soil Use and Management 21: 22–24.
Batjes, N.H.; Al Adamat, R.; Bhattacharyya, T.; Bernoux, A.; Cerri, C.E.P.; Gicheru, P.; Kamoni, P.; Milne, E.; Pal, D.K.; Rawajfih, Z. 2007. Preparation of consistent soil data sets for modelling purposes: Secondary SOTER data for four case study areas. Agriculture Ecosystems and Environment 122: 26–34.
Batjes, N.H.; Dijkshoorn, J.A. 1999. Carbon and nitrogen stocks in the soils of the Amazon Region. Geoderma 89: 273–286.
Bernoux, M.; Carvalho, M.D.S.; Volkoff, B.; Cerri, C.C. 2002. Brazil’s soil carbon stocks. Soil Science Society of America Journal 66: 888–896.
Bernoux, M.; Volkoff, B. 2006. Soil carbon stocks in soil ecoregions of Latin America. p. 65–75. In: Lal, R.; Cerri, C.C.; Bernoux, M.; Etchevers, J.; Cerri, E., eds. Carbon sequestration in soils of Latin America, Haworth Press, New York, NY, USA.
Brejda, J.J.; Mausbach, M.J.; Goebel, J.J.; Allan, D.L.; Dao, T.H.; Karlen, D.L.; Moorman, T.B.; Smith, J.L. 2001. Estimating surface soil organic carbon content at a regional scale using the national resource inventory. Soil Science Society of America Journal 65: 842–849.
Caniego, J.; Ibanez, J.J.; Martinez, F.S. 2006. Selfsimilarity of pedotaxa distributions at the planetary scale: a multifractal approach. Geoderma 134: 306–317.
Cerri, C.E.P.; Bernoux, A.; Chaplot, V.; Volkoff, B.; Victoria, R.L.; Melillo, J.M.; Paustian, K.; Cerri, C.C. 2004. Assessment of soil property spatial variation in an Amazon pasture: basis for selecting an agronomic experimental area. Geoderma 123: 51–68. Cerri, C.E.P.; Easter, M.; Paustian, K.; Killian, K.; Coleman, K.;
Bernoux, M.; Falloon, P.; Powlson, D.S.; Batjes, N.H.; Milne, E.; Cerri, C.C. 2007. Predicted soil organic carbon stocks and changes in the Brazilian Amazon between 2000 and 2030. Agriculture Ecosystems and Environment 122: 58–72. Cochrane, T.T.; Cochrane, T.A. 1998. SIGTERON: Geographic
Information System of Land and Soils for Rondônia State, Brazil: Consultancy Cconsortium TECNOSOLO-DHV report. TECNOSOLO-DHV, Porto Velho, RO, Brazil (in Portuguese). Cochrane, T.T.; Cochrane, T.A. 2006. Diversity of the land
resources in the Amazonian State of Rondônia, Brazil. Acta Amazônica 36: 91–101.
Empresa Brasileira de Pesquisa Agropecuária [EMBRAPA]. 1981. Soil Map of Brazil at 1:5,000,000 Scale. Serviço Nacional de Levantamento e Conservação de Solos/Embrapa, Rio de Janeiro, RJ, Brazil (in Portuguese).
Galbraith, J.M.; Kleinman, P.J.A.; Bryant, R.B. 2003. Sources of uncertainty affecting soil organic carbon estimates in northern New York. Soil Science Society of America Journal 67: 1206–1212.
Goidts, E.; van Wesemael, B. 2007. Regional assessment of soil organic carbon changes under agriculture in Southern Belgium (1955–2005). Geoderma 141: 341–354.
Heuvelink, G.B.M.; Webster, R. 2001. Modelling soil variation: past, present, and future. Geoderma 100: 269–301.
Holmes, K.W.; Chadwick, O.A.; Kyriakidis, P.C.; Silva de Filho, E.P.; Vianei Soares, J.; Roberts, D.A. 2006. Large-area spatially explicit estimates of tropical soil carbon stocks and response to land-cover change - art. no. GB3004. Global Biogeochemical Cycles 20: 14–25.
Horbe, A.M.C.; Costa, M.L. 2005. Lateritic crusts and related soils in eastern Brazilian Amazonia. Geoderma 126: 225–239. Instituto Brasileiro de Geografia e Estatística [IBGE]. 1988.
Vegetation Map of Brazil at 1:5,000,000 Scale. IBGE, Rio de Janeiro, RJ, Brazil (in Portuguese).
King, L.C. 1962. The Morphology of the Earth: A Study and Synthesis of World Scenary. Oliver and Boyd, Edinburgh, Scotland, UK.
King, L.C. 1956. Geomopholy of eastern Brazil. Revista Brasileira de Geografia. 18: 147–265.
Laurance, W.F.; Fearnside, P.M.; Laurance, S.G.; Delamonica, P.; Lovejoy, T.E.; Rankin-de Merona, J.M.; Chambers, J.Q.; Gascon, C. 1999. Relationship between soils and Amazon forest biomass: a landscape-scale study. Forest Ecology and Management 118: 127–138.
Lin, H.S.; Wheeler, D.; Bell, J.; Wilding, L. 2005. Assessment of soil spatial variability at multiple scales. Ecological Modelling 182: 271–290.
Loveland, T.R.; Merchant, J.M. 2004. Ecoregions and ecoregionalization: geographical and ecological perspectives. Environmental Management 34: 1–13.
Mackey, B.G.; Berry, S.L.; Brown, T. 2008. Reconciling approaches to biogeographical regionalization: a systematic and generic framework examined with a case study of the Australian continent. Journal of Biogeography 35: 213–229. Maia, S.M.F.; Ogle, S.M.; Cerri, C.E.P.; Cerri, C.C. 2009. Effect
of grassland management on soil carbon sequestration in Rondônia and Mato Grosso states, Brazil. Geoderma 149: 84–91.
Moraes, J.L.; Cerri, C.C.; Melillo, J.M.; Kicklighter, D.; Neill, C.; Skole, D.L.; Steudler, P.A. 1995. Soil Carbon stocks of the Brazilian Amazon basin. Soil Science Society of America Journal 59: 244–247.
Omernik, J.M.; Bailey, R.G. 1997. Distinguishing between watersheds and ecoregions. Journal of the American Water Resources Association 33: 935–949.
Phillips, J.D.; Marion, D.A. 2007. Soil geomorphic classification, soil taxonomy, and effects on soil richness assessments. Geoderma 141: 89–97.
Projeto Radambrasil. 1973-1986. Survey of Natural Resources. Departamento Nacional de Produção Mineral. Rio de Janeiro, RJ, Brazil (in Portuguese, with abstract in English).
Rasmussen, C. 2006. Distribution of soil organic and inorganic carbon pools by biome and soil taxa in Arizona. Soil Science Society of America Journal 70: 256–265.
Schaefer, C.; Amaral, E.F.; Mendonca, B.A.F.; Oliveira, H.; Lani, J.L.; Costa, L.M.; Fernandes Filho, E.I. 2008. Soil and vegetation carbon stocks in Brazilian Western Amazonia: relationships and ecological implications for natural landscapes. Environmental Monitoring and Assessment 140: 279–289.
Secretaria de Estado de Planejamento do Mato Grosso. [SEPLAN-MT]. 2002. Socio Economic and Ecological Secretaria de Estado de Planejamento Zoning of Mato Grosso State., SEPLAN-MT, Cuiabá, MT, Brazil (in Portuguese). Secretaria de Estado de Planejamento de Rondônia
[SEPLAN-RO]. 1998. Socio economic and ecological zoning of Rondonia state. SEPLAN-RO, Porto Velho, RO, Brazil (in Portuguese). Snelder, T.; Lehmann, A.; Lamouroux, N.; Leathwick, J.;
Allenbach, K. 2010. Effect of classification procedure on the performance of numerically defined ecological regions. Environmental Management 45: 939–952.
Webster, R. 2000. Is soil variation random? Geoderma 97: 149–163.