SAMPLE SIZE FOR SINGLE, DOUBLE AND THREE-WAY
HYBRID CORN EAR TRAITS
Lindolfo Storck1*; Sidinei José Lopes1; Alberto Cargnelutti Filho2; Luiz Fernando Dias Martini1; Melissa Pisaroglo de Carvalho1
1
UFSM - Depto. de Fitotecnia - 97105-900 - Santa Maria, RS - Brasil. 2
UNESP/FCA - Depto. Ciências Exatas - 14884-900 - Jaboticabal, SP - Brasil. *Corresponding author <lindolfo@smail.ufsm.br>
ABSTRACT: Using adequate sample size in experimental units improves the efficiency of the research. In the agricultural year of 2004/2005, an experiment was conducted in Santa Maria, Rio Grande do Sul State, Brazil, with the objective of estimating sample size for the following traits: ear length, ear and cob diameter, ear weight, weight of grains per ear, cob weight and the weight of 100 grains, number of grain rows per ear, number of grains per ear and length of grains for two single hybrids (P30F33 and P Flex), two three-way hybrids (AG8021 and DG501) and two double hybrids (AG2060 and DKB701) of maize. For a 5% (D5) precision, the weight traits (dehusked ear weight, weight of grains per ear, cob weight and weight of 100 grains) can be sampled with 21 ears; the size traits (ear length, ear diameter, cob diameter and grain length) with eight ears; and the number traits (number of grain and rows) with 13 ears. Sample size varies as a function of ear trait and the type of hybrid i.e. single, three-way or double. Genetic variability among ears does not correspond to the increasing genetic variability i.e. single, three-way and double for the sample size of traits per ear.
Key words: Zea mays L., experimental accuracy, sampling
TAMANHO DE AMOSTRA PARA CARACTERÍSTICAS DE
ESPIGAS DE MILHO HÍBRIDO SIMPLES, DUPLO E TRIPLO
RESUMO: O uso dos tamanhos de amostras adequados nas unidades experimentais melhora a eficiência da pesquisa. Foi conduzido um experimento no ano agrícola 2004/2005 em Santa Maria, Rio Grande do Sul, com o objetivo de estimar o tamanho de amostra para o comprimento de espiga, o diâmetro de espiga e de sabugo, o peso da espiga, dos grãos por espiga, do sabugo e de 100 grãos, o número de fileiras de grãos por espiga, o número de grãos por espiga e o comprimento dos grãos de dois híbridos simples (P30F33 e P Flex), dois híbridos triplos (AG8021 e DG501) e dois híbridos duplos (AG2060 e DKB701) de milho. Para uma precisão de 5% (D5), características de peso (peso de espiga despalhada, de grãos, de sabugo e de 100 grãos) podem ser amostradas com 21 espigas, características de tamanho (comprimento de espiga e de grão, diâmetro de espiga e de sabugo) com oito espigas, e dados de contagem (número de grãos e de fileiras) com 13 espigas. O tamanho de amostra é variável em função da característica da espiga e do tipo de híbrido: simples, triplo ou duplo. A variabilidade genética existente entre os híbridos de milho, na forma crescente: simples, triplo e duplo, não reflete na mesma ordem no tamanho de amostra de caracteres da espiga.Palavras-chave: Zea mays L., precisão experimental, amostragem
INTRODUCTION
The assessment of genotypes in maize im-provement programs is made difficult due to the large number of measurements in each experimental unit. Although sampling number is an alternative, it is nec-essary to know beforehand the population variance and the desired accuracy degree for each trait to be as-sessed, as well as possible genetic interferences (Mar-tin et al., 2005a; 2005b) when crea(Mar-ting a single ran-dom sampling.
In finite populations there are three basic al-ternatives for sampling: random sampling, systematic sampling and arbitrary sampling (Steel et al., 1997). Therefore, the difference between the amount esti-mated in the sample and the amount of the same pa-rameter in the population is known as sampling error, which obviously decreases as the sample size in-creases.
produced information on different methods of random sampling, for the variable height of plants, ear insertion and number of tassel branches. Apart from these authors, Silva et al. (1998), using simple sampling, concluded that 11 ears are required per plot to estimate the number of grains per ear, cob length and weight. Martin et al. (2005b), using simple sampling, concluded that 24 ears per plot are required in six replications per genotype, thus obtaining the semi-amplitude of the confidence intervals bellow 10% of the average, to assess the ear length and diameter, yield of grains and weight of 100 grains. Also, the simple sampling of ears in plots with the same number of plants distributed in two or three rows provided more experimental accuracy than when distributed in a single row (Palomino et al., 2000).
The objective of this study is to estimate sample sizes to assess different traits of single, double and three-way hybrid maize ears.
MATERIAL AND METHODS
The experiment was conducted between Octo-ber 21, 2004 (sowing) and March 18, 2005 (harvest), in Santa Maria, State Rio Grande do Sul, Brazil (29°43’ S; 53°45’ W, altitute 95 m) in a Typic Hapludalf - Brunizem Hidromórfico (Embrapa, 1999). Six treatments were comprised of two single hybrids (P30F33 and P Flex), two three-way hybrids (AG8021 and DG501) and two double hybrids (AG2060 and DKB701), all representing early maize varieties. The management of the crop was according to a technical recommendation for the conventional cultivation of maize in the state of Rio Grande do Sul (Embrapa, 2006). The experiment was implemented according to a randomized complete block design with three repli-cations, using plots of two rows of five meters length,
0.8 meters between rows and 55,000 plants ha-1
den-sity, approximately 40 plants plot-1.
Plots were evaluated in relation to the number of days from sowing until 50% of blooming plants, plant height and ear insertion (mean of five plants), number of plants and ears, as well as yield of grains at 13% humidity. These variables were submitted to analysis of variance.
In each plot, five corn ears were randomly sampled for the assessment of the ear length (EL), ear diameter (ED) and cob diameter (CD), dehusked cob weight (EW), grain weight per ear (WG), cob weight (CW), weight of 100 grains (W100), number of grain rows per ear (NR), number of grains per ear (NG) and average length of grains (LG), estimated as being half of the difference between the dehusked ear diameter
and the cob. These variables were submitted to analy-sis of variance according to the same experimental de-sign with sampling. The average variance and coeffi-cient of variation (average of the three blocks) were also estimated for each hybrid. For each hybrid, the variance was estimated as the variation between ears within the block, with 12 degrees of freedom.
Estimates of the sample size were obtained
according to the formula 2 2 2
á/2
0 /D
n =t CV , following
the study of Martin et al. (2005b), where CV is the co-efficient of variation of the sampling error (in percent-age), D is the half-amplitude of the confidence inter-val (in percentage) for the average (it was established that D=5% and D=10%) and t is the critical value of the t distribution, at a 5% (two sides) level of error probability. The size of estimated samples refers to the estimate, at 5% precision (D5) or 10% (D10) of the estimated mean, in the experimental unit. Considering that the plants population (or the ears population) in the experimental units (plot) is finite (N, approxi-mately, equal to 40), the size of the sample was
ad-justed (using N=40) for n=n0/(1+n0/N).
RESULTS AND DISCUSSION
No differences were observed for yield of grains between the six hybrids assessed, whose
av-erage was equal to 8.75 t ha-1. The adequate
manage-ment (fertilization, irrigation and weed control), the adequate plant average density (54.3 thousand plants
ha-1) which is close to the average number of ears
(52.4 thousand ha-1), and of the population installed
in the experiment (55000 plants ha-1), resulted in this
yield, and could be the reason why these hybrids pre-sented a similar yield of grains (Table 1) although having significant differences between the number of days from sowing to flower and plant height. Because plant density among hybrids was uniform, the sample size was adjusted using de same value (N = 40) for any plot.
The coefficient of variation of grain yield (17.1%) is considered as average, according to the clas-sification of Lúcio et al. (1999). This is explained by the significant interaction block x hybrid (experimen-tal error) for the variable weight of grains per ear (Table 2) as a negative aspect. Therefore, differences in relation to the weight of ear grains can vary accord-ing to the block (environment) for one hybrid and does not vary among hybrids.
*Significant through the F test at 5%. nsNon significant.
Table 1 - Analysis of variance, mean, minimum and maximum value and coefficient of variation (CV) in relation to the number of days from sowing to flower (Days), to the plant height (PH) and ear insertion (EI, cm), the number of
plants (NP) and ears (NE, thousands ha-1) and the yield of grains (t ha-1) of six hybrids (two single, two
three-way and two double) of early corn.
f o s e c r u o S s n o i t a i r a V f o s e e r g e D m o d e e r F e r a u q S n a e M s y a
D PH EI NP NE Yield
s k c o l
B 2 0.39 62.0 8.7 17.3 12.8 4.24
s d i r b y
H 5 3.79* 435.5* 116.6ns 18.9ns 45.5ns 3.94ns
r o r r
E 10 0.65 100.1 42.3 8.1 27.7 2.23
n a e
M 73.6 230.0 143.3 54.3 52.4 8.75
m u m i n i
M 71 196 128 46.5 38.7 4.27
m u m i x a
M 76 250 160 62.5 62.5 10.92
) % ( V
C 1.1 4.3 4.5 5.2 10.1 17.1
f o s e c r u o S n o i t a i r a
V DF
e r a u q S n a e M L
E ED CD EW WG CW W100 NR NG LG
-m m
-- --- g--- mm
s k c o l
B 2 3144 22.6 1.7 9988 7908 131.7 106.2 2.2 9529 3.55
s d i r b y
H 5 616* 102.5* 112.9* 6015ns 4667ns 806ns 26.9ns 18.8* 69495* 13.66*
r o r r E . p x
E 10 944* 28.1* 4.92ns 6078* 4691* 273.9* 61.5* 2.2ns 7821ns 4.14*
r o r r E . l p m a
S 72 183 5.7 2.86 1150 890 138.5 19.6 2.2 6170 0.865
n a e
M - 174.6 48.8 28.1 231.1 196.2 34.9 32.4 15.9 606.5 10.3
V C . p x
E - 17.6 10.8 7.8 33.7 34.9 47.4 24.2 9.3 14.6 19.7
V C m
A - 7.7 4.9 6.0 14.6 15.2 33.7 13.6 9.3 12.9 9.0 *Significant for the F test at 5%. nsNon significant. DF = degrees of freedom.
Table 2 - Analysis of variance, mean and coefficient of variations (CV, %) for ear length (EL), ear diameter (ED) and cob diameter (CD), ear weight (EW), weight of grains per ear (WG), cob weight (CW), weight of 100 grains (W100), number of grain rows per ear (NR), number of grains per ear (NG) and length (mm) of grains (LG) of six hybrids (two single, two three-way and two double) of early corn.
effect was observed for the number of plants and ears. This result was expected because of the initial
popu-lation of plants (55,000 plants ha-1) is the same for all
hybrids and the unlimited conditions of water and nu-trients.
For 70% of the assessed traits in corn ears, the experimental error (variation between plots) was sig-nificant at a 5% level of probability (Table 2). In such cases, the use of a greater number of replications due to a smaller number of corn ears per experimental unit (by keeping the total number of corn ears per hybrid) is more efficient for the reduction of the estimated av-erage variance for a certain hybrid (Barbin, 2003). As a result, it is possible to redesign the experimental de-sign to a greater number of replications (Martin et al., 2005b).
In relation to ear traits i.e. weight, grain weight, cob weight and weight of 100 grains, the ef-fect of the hybrid was not significant, probably due to
the significance of the experimental error, increased by
block × hybrid interaction (Table 2). In these cases,
dif-ferences in ear traits among hybrids depend on the block (environment), which makes the sample size de-pendent on the genotype (Martin et al., 2005b). For the variables of which the experimental error effect was significant, the estimated sample size (Table 3) was much greater (average of 21 ears, for D5) than for the other six traits with hybrids with significant differences (average of 10 ears, for D5). This fact shows the in-fluence of the environmental variation over these traits and therefore requires more attention from research-ers.
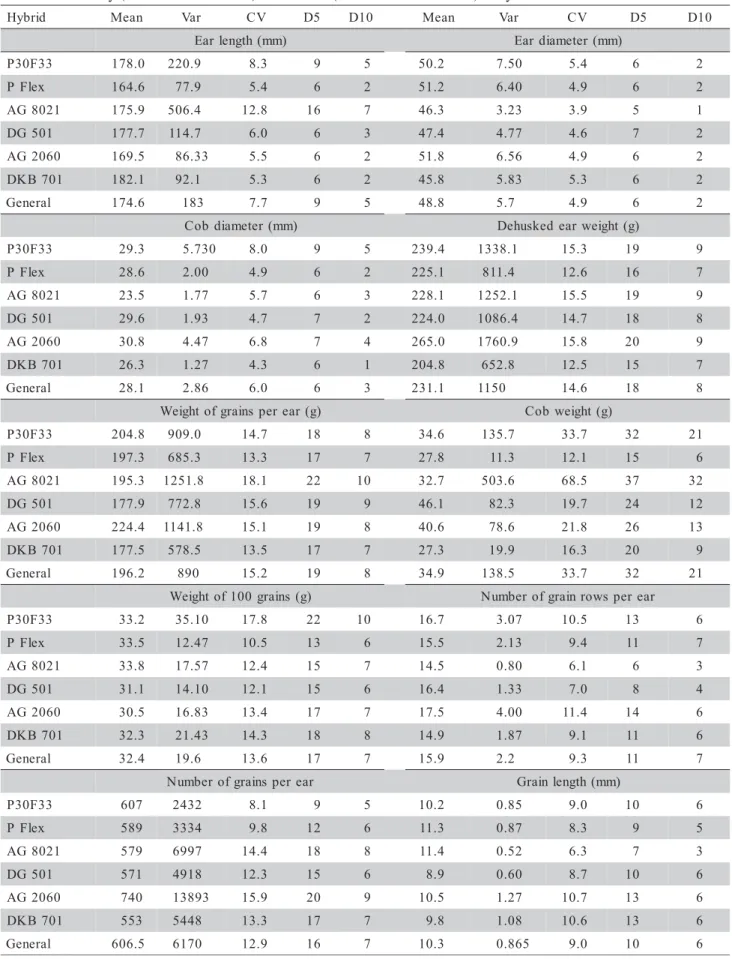
Table 3 - Mean, variance (Var), coefficient of variation (CV %) and sample size for each hybrid, for the half 95% confidence interval, equal to 5% (D5) and 10% (D10) of the mean, for single hybrid maize ear traits (P30F33 and P Flex), three-way (AG8021 and DG501) and double (AG2060 and DKB701) early corn.
d i r b y
H Mean Var CV D5 D10 Mean Var CV D5 D10
) m m ( h t g n e l r a
E Eardiameter(mm)
3 3 F 0 3
P 178.0 220.9 8.3 9 5 50.2 7.50 5.4 6 2
x e l F
P 164.6 77.9 5.4 6 2 51.2 6.40 4.9 6 2
1 2 0 8 G
A 175.9 506.4 12.8 16 7 46.3 3.23 3.9 5 1
1 0 5 G
D 177.7 114.7 6.0 6 3 47.4 4.77 4.6 7 2
0 6 0 2 G
A 169.5 86.33 5.5 6 2 51.8 6.56 4.9 6 2
1 0 7 B K
D 182.1 92.1 5.3 6 2 45.8 5.83 5.3 6 2
l a r e n e
G 174.6 183 7.7 9 5 48.8 5.7 4.9 6 2
) m m ( r e t e m a i d b o
C Dehuskedearweight(g)
3 3 F 0 3
P 29.3 5.730 8.0 9 5 239.4 1338.1 15.3 19 9
x e l F
P 28.6 2.00 4.9 6 2 225.1 811.4 12.6 16 7
1 2 0 8 G
A 23.5 1.77 5.7 6 3 228.1 1252.1 15.5 19 9
1 0 5 G
D 29.6 1.93 4.7 7 2 224.0 1086.4 14.7 18 8
0 6 0 2 G
A 30.8 4.47 6.8 7 4 265.0 1760.9 15.8 20 9
1 0 7 B K
D 26.3 1.27 4.3 6 1 204.8 652.8 12.5 15 7
l a r e n e
G 28.1 2.86 6.0 6 3 231.1 1150 14.6 18 8
) g ( r a e r e p s n i a r g f o t h g i e
W Cobweight(g)
3 3 F 0 3
P 204.8 909.0 14.7 18 8 34.6 135.7 33.7 32 21
x e l F
P 197.3 685.3 13.3 17 7 27.8 11.3 12.1 15 6
1 2 0 8 G
A 195.3 1251.8 18.1 22 10 32.7 503.6 68.5 37 32
1 0 5 G
D 177.9 772.8 15.6 19 9 46.1 82.3 19.7 24 12
0 6 0 2 G
A 224.4 1141.8 15.1 19 8 40.6 78.6 21.8 26 13
1 0 7 B K
D 177.5 578.5 13.5 17 7 27.3 19.9 16.3 20 9
l a r e n e
G 196.2 890 15.2 19 8 34.9 138.5 33.7 32 21
) g ( s n i a r g 0 0 1 f o t h g i e
W Numberofgrainrows per ear
3 3 F 0 3
P 33.2 35.10 17.8 22 10 16.7 3.07 10.5 13 6
x e l F
P 33.5 12.47 10.5 13 6 15.5 2.13 9.4 11 7
1 2 0 8 G
A 33.8 17.57 12.4 15 7 14.5 0.80 6.1 6 3
1 0 5 G
D 31.1 14.10 12.1 15 6 16.4 1.33 7.0 8 4
0 6 0 2 G
A 30.5 16.83 13.4 17 7 17.5 4.00 11.4 14 6
1 0 7 B K
D 32.3 21.43 14.3 18 8 14.9 1.87 9.1 11 6
l a r e n e
G 32.4 19.6 13.6 17 7 15.9 2.2 9.3 11 7
r a e r e p s n i a r g f o r e b m u
N Grainlength(mm)
3 3 F 0 3
P 607 2432 8.1 9 5 10.2 0.85 9.0 10 6
x e l F
P 589 3334 9.8 12 6 11.3 0.87 8.3 9 5
1 2 0 8 G
A 579 6997 14.4 18 8 11.4 0.52 6.3 7 3
1 0 5 G
D 571 4918 12.3 15 6 8.9 0.60 8.7 10 6
0 6 0 2 G
A 740 13893 15.9 20 9 10.5 1.27 10.7 13 6
1 0 7 B K
D 553 5448 13.3 17 7 9.8 1.08 10.6 13 6
l a r e n e
the other three traits (number of grain rows per ear, number of grains per ear and average size of grains), the double hybrid has the greatest sample size. For the final trait (ear diameter and weight of 100 grain) there was a draw between the single and double hybrids. These results show that there is variability among hy-brids, which does not follow a tendency of genetic variability between single, three-way and double hy-brids. Naspolini Filho (1975) confirms that the theory of variance for grain yield is increasing from the single hybrid towards three-way and double hybrids and the cultivated variety. Martin et al. (2005a) also observed the influence on the type of hybrid over the estimated number of replications in experiments, without, how-ever, confirming the increase in sample size in the logi-cal tendency of variability of single, three-way and double hybrids, and the cultivated variety. There is a hybrid type effect that researchers should take into con-sideration with respect to the genotype to be used for dimensioning the sample size for an accurate assess-ment of corn ear traits.
Considering that sample size varies as a func-tion of hybrid and trait, and that the average sample size contemplates, in general, a larger number of traits, it would be possible to use an average sample size classified by groups of observed traits. So, for an accuracy of 5% (D5), the weight traits (dehusked ear weight, weight of grains per ear, cob weight and weight of 100 grains) can be sampled with 21 ears; the size traits (ear length, ear diameter, cob diameter and grain length) can be sampled with eight ears; and the number traits (number of grain and rows) with 13 ears.
It would also be possible to opt for the sample size of the most important trait for the experiment. As three replications were used in the study and the in-crease in the number of replications is more efficient than the increase in the sample size to improve experi-mental accuracy, the use of four or five replications and a smaller sample size could improve experimental ac-curacy for future experiments. This study found a lower lesser sample size in relation to those found by Mar-tin et al. (2005b), which estimated the sample size equal to 24 ears per plot, using six replications per genotype, in relation to the traits of ear length and di-ameter, yield of grains and weight of 100 grains with 10% precision (D10). On the other hand, Fernandes & Silva (1996) concluded that the sample size for the ear length and diameter and the number of grains per corn ear should be 11 ears per plot, without specifying ac-curacy.
In a study with half-sib families of a corn va-riety, Resende & Souza Jr. (1997) found the same level of precision for the variables of plant height and ear
insertion height. This result was confirmed with the hy-brids from this experiment. In the same study, the en-vironment influenced the accuracy of the variables on a differentiated basis i.e. in the best environmental con-dition (fertile soils) the yield of grains was benefici-ated by the experimental precision, while the plant height and the ear insertion were damaged. Under acid soil conditions the contrary effect was observed.
Since the number of replications is more important to reduce the estimated average variance, it is possible to redistribute the sample size estimated for a number of replications. For instance, nine ears could be used in seven replications instead of using 21 ears per plot in three replications, thus keep-ing the total number (63) of ears per hybrid in the ex-periment unchanged. It is not possible to estimate, in this case, the exact gain in the precision by using this rearrangement of the experimental and sampling plans.
CONCLUSION
Sample size is variable as a function of the trait assessed in the corn ear and the hybrid type: single, three-way or double.
The existing genetic variability among maize hybrids on an increasing basis: single, three-way and double does not occur in the same order as in the sample size of traits of the ear.
REFERENCES
BBARBIN, D. Planejamento e análise estatística de experimentos agronômicos. Arapongas: Midas, 2003. 208p.
CONCEIÇÃO, M.M.; SILVA, P.S.L.; MACHADO, A.A. Efeitos de bordadura e amostragem em experimentos com milho. Ciência Agronômica, v.24, p.63-69, 1993.
EMPRESA BRASILEIRA DE PESQUISA AGROPECUARIA. Centro Nacional de Pesquisa de Solos. Sistema brasileiro de classificação dos solos. Brasília: Embrapa Solos, 1999. 412p.
EMPRESA BRASILEIRA DE PESQUISA AGROPECUARIA.
Indicações técnicas para o cultivo de milho e de sorgo no Rio Grande do Sul. Passo Fundo: Embrapa Trigo, 2006. 184p. FERNANDES, E.N.; SILVA, P.S.L. Tamanho de amostra e método de
amostragem para caracteres da espiga do milho. Ciência e Agrotecnologia, v.20, p.252-256, 1996.
LÚCIO, A.D.; STORCK, L.; BANZATTO, D.A. Classificação dos experimentos de competição de cultivares quanto a sua precisão.
Pesquisa Agropecuária Gaúcha, v.5, p.99-103, 1999.
MARTIN, T.N.; STORCK, L.; LÚCIO, A.D.; CARVALHO, M.P.; SANTOS, P.M. Bases genéticas de milho e alterações no plano experimental.
Pesquisa Agropecuária Brasileira, v.40, p.35-40, 2005a.
MARTIN, T.N.; STORCK, L.; LÚCIO, A.D.; LORENTZ, L.H. Plano amostral em parcelas de milho para avaliação de atributos de espigas.
Ciência Rural, v.35, p.1257-1262, 2005b.
NASPOLINI FILHO, V. Variabilidade fenotípica e estabilidade em híbridos simples, híbridos duplos, variedades e compostos de milho (Zea mays L.). Piracicaba: USP/ESALQ, 1975. 68f. (Dissertação -Mestrado em Agronomia).
PALOMINO, E.C.; RAMALHO, M.A.P.; FERREIRA, D.F. Tamanho da amostra para avaliação de famílias de meios-irmãos de milho.
RESENDE, M.D.V.; SOUZA JR., C.L. Numero de repetições e tamanho da parcela para seleção de progênies de milho em solos sob cerrado e fértil. Pesquisa Agropecuária Brasileira, v.32, p.1101-1108, 1997. SILVA, J.; SILVA, P.S.L.; RAIMUNDO, P.N. Amostragem e tamanho da amostra na estimação de caracteres da espiga do milho. Pesquisa Agropecuária Brasileira, v.33, p.1983-1988, 1998.
SILVA, P.S.L.; SOUSA, R.P. Técnicas experimentais para o milho. Mossoró: Fundação Guimarães Duque; ESAM, 1991. 192p. SILVA, P.S.L.; SILVA, G.S.; RODRIGUES, M.V.; MACHADO, A.A.
Método de amostragem e tamanho de amostra para alguns caracteres de milho. Ciência Agronômica, v.24, p.5-10, 1993.
STEEL, R.G.D.; TORRIE, J.H.; DICKEY, D. Principles and procedures of statistics: a biometrical approach. 3.ed. New York: McGraw-Hill, 1997. 666p.