ABSTRACT
A model to estimate yield loss caused by Asian soybean rust (ASR) (Phakopsora pachyrhizi) was developed by collecting data from field experiments during the growing seasons 2009/10 and 2010/11, in Passo Fundo, RS. The disease intensity gradient, evaluated in the phenological stages R5.3, R5.4 and R5.5 based on leaflet incidence (LI) and number of uredinium and lesions/cm2, was generated by applying azoxystrobin 60 g a.i/ha + cyproconazole 24 g a.i/ha + 0.5% of the adjuvant Nimbus. The first application occurred when LI = 25% and the remaining ones
Danelli, A.L.D.; Reis, E.M.; Boaretto, C. Critical-point model to estimate yield loss caused by Asian soybean rust. Summa Phytopathologica, v.41, n.4, p.262-269, 2015.
at 10, 15, 20 and 25-day intervals. Harvest occurred at physiological maturity and was followed by grain drying and cleaning. Regression analysis between the grain yield and the disease intensity assessment criteria generated 56 linear equations of the yield loss function. The greatest loss was observed in the earliest growth stage, and yield loss coefficients ranged from 3.41 to 9.02 kg/ha for each 1% LI for leaflet incidence, from 13.34 to 127.4 kg/ha/1 lesion/cm2 for lesion density and from 5.53 to 110.0 kg/ha/1 uredinium/cm2 for uredinium density.
Critical-point model to estimate yield loss caused by Asian soybean rust
Anderson Luiz Durante Danelli
1, Erlei Melo Reis
2and Cristina Boaretto
31,2,3
Laboratório de Fitopatologia - Micologia, Faculdade de Agronomia e Medicina Veterinária, Curso de Pós-graduação em Agronomia, Universidade de Passo Fundo, 99001-970, Passo Fundo, RS, Brasil. 1Dissertação de mestrado (2012), Bolsista Capes/Prosup/UPF. 2Bolsista do CNPq. Autor para correspondência: Anderson Luiz Durante Danelli ([email protected])
Data de chegada: 09/05/2014. Aceito para publicação em: 14/09/2015.
10.1590/0100-5405/2003
Um modelo para estimar os danos causados pela ferrugem asiática da soja (FAS) (Phakopsora pachyrhizi), foi desenvolvido a partir de dados experimentais de campo coletados nas safras 2009/10 e 2010/11, em Passo Fundo, RS. O gradiente da intensidade da doença, avaliado nos estádios fenológicos R5.3, R5.4, e R5.5, através de incidência foliolar (IF) e do número de urédias e de lesões/cm2, foi gerado pela aplicação de azoxistrobina 60 g i.a/ha + ciproconazol 24 g de i.a/ha + 0,5% do adjuvante Nimbus. A primeira pulverização foi realizada com uma IF = 25% e as demais espaçadas de 10, 15, 20 e 25 dias. A colheita
Danelli, A.L.D.; Reis, E.M.; Boaretto, C. Modelo de ponto crítico para estimar danos causados pela ferrugem asiática em soja. Summa Phytopathologica, v.41, n.4, p.262-269, 2015.
Palavras-chave: Glycine max, Phakopsora pachyrhizi, limiar de dano econômico.
RESUMO
foi realizada na fase de maturação fisiológica, seguido por secagem de grãos e de limpeza. A análise de regressão realizada entre o rendimento de grãos e os critérios de avaliação da intensidade da doença, gerou 56 equações lineares da função de dano. Os maiores danos foram observados no estádio mais precoce de avaliação, sendo que para incidência foliolar os coeficientes de danos variaram de 3,41 a 9,02 kg/ha para cada 1% de IF, para a densidade de lesões variaram de 13,34 a 127,4 kg/ha/1 lesão/cm2 e para densidade urédias variaram de 5,53 a 110,0 kg/ha/1 uredia/cm2.
Keywords: Glycine max, Phakopsora pachyrhizi, economic yield loss threshold.
Soybean [Glycine max (L.) Merrill] crop has been affected by several diseases caused by fungi, bacteria, viruses, and nematodes. Among them, the Asian soybean rust (ASR) caused by Phakopsora pachyrhizi Sydow & Sydow., is important for its widespread occurrence and high potential to cause significant yield losses (4, 8, 17).
In the available literature, there are no scientific reports on the quantification of yield loss caused by ASR in Brazil, although Godoy et al. (6) have reported that it can reach up to 80% in some regions.
There are few effective measures to control ASR. So far, the main tool to prevent economic loss in the crop has been the application of fungicides to soybean foliage (13). However, in many cases, fungicide are applied when not needed or without any scientific support (11).
Considering plant disease epidemics, damage quantification should be a first priority, however, few studies have quantified the disease effects on soybean grain yield. One study has been published showing
the relationship between the loss caused by plant diseases to healthy leaf area and the absorption of solar radiation by healthy leaf area (19). The critical-point type model is particularly useful when a specific plant growth stage in which disease intensity is highly correlated to future loss can be identified (1, 8, 9). Thus, in practice, a simple model can be applied to estimate the loss caused to the host by a specific disease according to the host’s phenological stage and the disease intensity.
and defoliation can have causes than ASR.
The relationship between yield and disease intensity should be established in order to obtain the loss function, which can assist in decision making for fungicide application.
Our hypothesis is that, although loss due to ASR is considered high, it can be scientifically established by using the critical-point model. The aims of this study were to relate soybean rust intensity (leaflet incidence, lesion and uredinium densities) to grain yield in different phenological stages of the crop based on the critical-point model.
MATERIAL AND METHODS
The experiments were conducted at the experimental field of Faculty of Agronomy and Veterinary Medicine, University of Passo Fundo, RS, at two sowing times and in the growing seasons 2009/2010 and 2010/2011. In the growing season 2009/2010, the first and second sowing time were 11/26/2009 and 12/11/2009, respectively, while in the growing season 2010/2011, the first and the second sowing times were 11/12/2010 and 12/01/2010, respectively.
The soybean cultivars used in this study were BRS GO 7560 resistant to ASR and belonging to the 7.5 maturation group, and BRS 246 RR, susceptible and belonging to 7.2 maturation group.
Soybean seeds were treated with thiamethoxam (0.15 L/100 kg seed) + fludioxonil + metalaxyl (0.10 L/100 kg seed + 0.10 L/100 kg seed) and directly sown into oat straw. The soil was fertilized with 300 kg/ha of 05-20-20 (N-P2O5-K2O). Manual weed control for BRS GO 7560, was conducted in the vegetative stage V3 and V8 ( 15) in both years and the two sowing times. For BRS 246 RR, weed control was performed by means of two applications of glyphosate at 2.0 L/ ha, in the vegetative stages V3 and V8. For insect control, insecticide thiamethoxam + lambda-cyhalothrin at 0.25 L/ha was applied in the reproductive stage R1 and in the stage R5.
For loss quantification, it was necessary to generate an ASR infection intensity gradient. This was accomplished through the applying of azoxystrobin (60 g a.i/ha) + cyproconazole (24 g a.i/ha) + 0.5% of the adjuvant Nimbus, combined with different spray intervals (16). Fungicide applications were performed with a precision sprayer, with a constant pressure of 30 L/pol2
generated by CO2 gas. The device contained a 3 m-long boom with six XR 110 015 spray nozzles spaced at 0.5 m, delivering 150 L/ha.
Experimental units were composed of seven 8-m rows spaced by 0.45 m. Disease assessment was performed for the central three rows of each plot. The experiments were carried out in a randomized block design with four replications, as 2 (cultivar) x 5 (interval between applications) factorial arrangement.
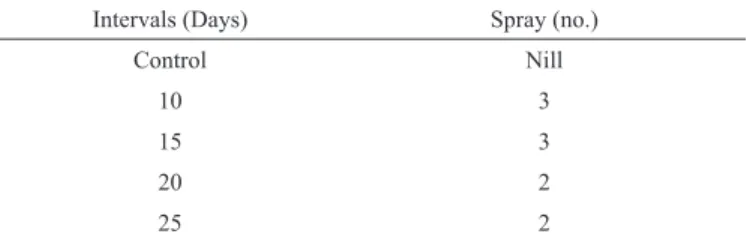
Treatments were composed of a control, which did not receive any fungicide application, and four intervals between applications of 10, 15, 20 and 25 days. In the 10 and 15-day intervals, fungicides were applied three times, while in the 20 and 25-day, they were sprayed twice (Table 1). The first spray was done based on LI = 25% (LI=leaflet incidence). Five plants were sampled per plot in growth stages R5.3, R 5.4 and R 5.5. ASR intensity was assessed according to the leaflet incidence, number of lesion and uredinium/cm2 for central leaf leaflets in the main stem. Lesions and uredinium were counted within two circles of 1.0 cm diameter marked with a cork-borer on the central of each leaflet and evaluated under a binocular stereoscopic 40 X magnification. The last evaluation was performed at 20 days after the last fungicide application to know the final rust intensity.
Grains were mechanically harvested when water content was near
13%. Only the three central rows of each plot were harvested. Regression analyses were performed between grain yield, as dependent variable, and leaflet incidence (LI), lesion (L) and uredinium (U) density (independent variables) for cultivars, growing seasons, sowing time and phenological stages R5.3, R5.4 and R5.5. Equations were expressed as Y = 1000 – a(LI), where a is the loss coefficient
(kg/leaflet incidence); hereafter units not indicated; Y = 1000 – a(L); Y = 1000 – a(U); Y is the grain yield normalized to 1,000 kg/ha. Unregulated regressions were represented by graphs, for each variable, leaflet incidence, lesion and uredinium number/cm2, and the average for both cultivars and the three phenological stages was presented. Equations represent the critical-point model as investigated in this study. The economic loss threshold (ELT) was calculated according to the formula proposed by Munford & Norton´s (10): DI = Cc/(Pp x Dc x Ce), where: DI = disease intensity; Cc = control cost (U$)/ha; Pp = product price, i.e. soybean ton price (U$); LC = yield loss coefficient; and Ce = fungicide treatment efficiency (percentage of control).
RESULTS AND DISCUSSION
The environmental conditions were favorable to both the crop and the disease development in the two growing seasons. Disease onset in the growing season 2009/10 was registered on 01/22/2010 for BRS GO 7560 (resistant) and BRS 246 RR (susceptible) considering first sowing time, and on 02/11/2010 for BRS GO 7560 and on 01/25/2010 for BRS 246 RR considering the second sowing time. In the growing season 2010/11, disease onset was recorded on 01/25/2011 for BRS GO 7560 and on 03/02/2011 for BRS 246 RR considering the first sowing time, and on 01/25/2011 for BRS GO 7560 and on 02/07/2011 for BRS 246 RR considering the second sowing date.
Due to the low lesions and uredinium densities in the phenological stage R5.3, only two equations were obtained for each cultivar and sowing dates in the stages R5.4 and R5.5.
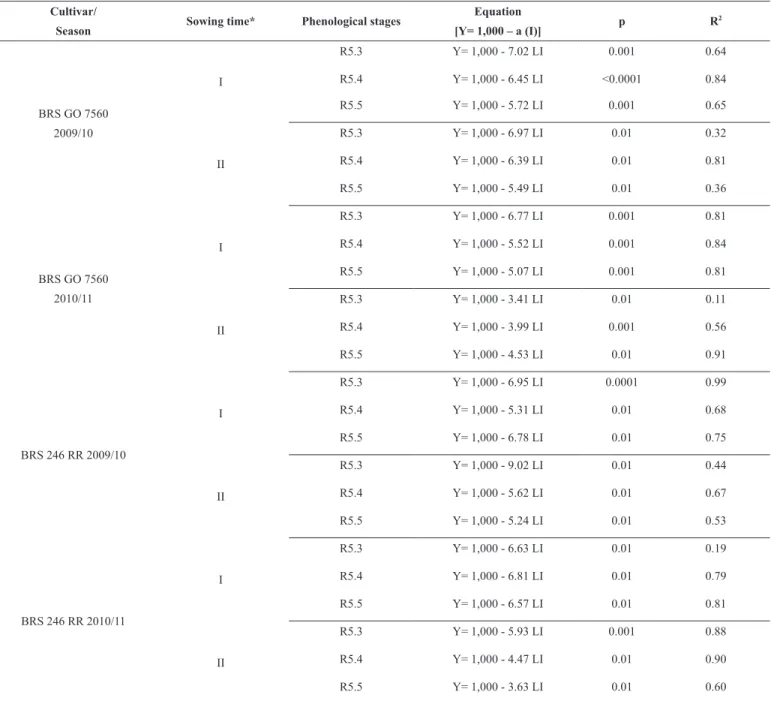
Fifty-six regression equations of the loss function were generated for LI, and lesion and uredinium density. In addition to the equations, the level of significance level (p) and coefficient of determination (R2) were calculated. The loss functions were represented by the equation normalized to 1,000 kilograms of soybeans/ha yield (Tables 2, 3, 4 e Figure 1, 2 and 3).
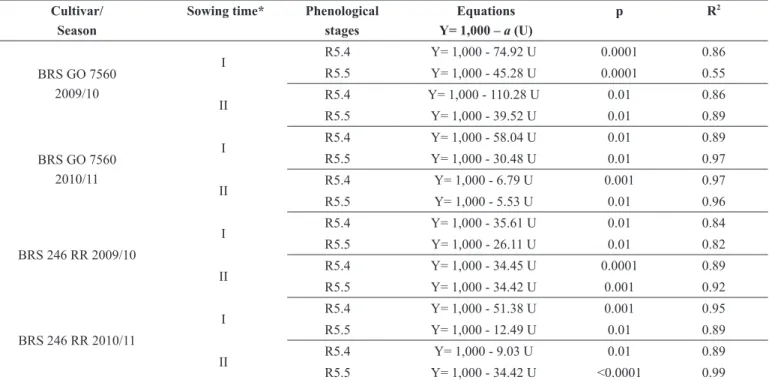
The loss coefficients (LCs) varied from 3.41 (R5.3) to 9.02 (R5.3) kg/ha for each 1% LI and the overall mean was 5.61 LI BRS GO 7560 and 6.08 kg/ha for BRS 246 RR for each 1% LI, based on the means of 12 equations (Tables 2). The loss coefficients for lesion density varied from 13.34 (R5.5) to 127.4 (R5.4) kg/lesion/cm2; the overall mean for BRS GO 7560 was 86,63 and for BRS 246 RR, 60.5 kg/ lesion/cm2, representing the means of eight equations (Table 3). The loss coefficients for uredinium density varied from 5.53 (R5.5) to 110.0 (R5.3) kg/ha/1 uredinium/cm2; the overall mean for BRS GO
Intervals (Days) Spray (no.)
Control Nill
10 3
15 3
20 2
25 2
Cultivar/
Season Sowing time* Phenological stages
Equation
[Y= 1,000 – a (I)] p R
2
BRS GO 7560 2009/10
I
R5.3 Y= 1,000 - 7.02 LI 0.001 0.64
R5.4 Y= 1,000 - 6.45 LI <0.0001 0.84
R5.5 Y= 1,000 - 5.72 LI 0.001 0.65
II
R5.3 Y= 1,000 - 6.97 LI 0.01 0.32
R5.4 Y= 1,000 - 6.39 LI 0.01 0.81
R5.5 Y= 1,000 - 5.49 LI 0.01 0.36
BRS GO 7560 2010/11
I
R5.3 Y= 1,000 - 6.77 LI 0.001 0.81
R5.4 Y= 1,000 - 5.52 LI 0.001 0.84
R5.5 Y= 1,000 - 5.07 LI 0.001 0.81
II
R5.3 Y= 1,000 - 3.41 LI 0.01 0.11
R5.4 Y= 1,000 - 3.99 LI 0.001 0.56
R5.5 Y= 1,000 - 4.53 LI 0.01 0.91
BRS 246 RR 2009/10
I
R5.3 Y= 1,000 - 6.95 LI 0.0001 0.99
R5.4 Y= 1,000 - 5.31 LI 0.01 0.68
R5.5 Y= 1,000 - 6.78 LI 0.01 0.75
II
R5.3 Y= 1,000 - 9.02 LI 0.01 0.44
R5.4 Y= 1,000 - 5.62 LI 0.01 0.67
R5.5 Y= 1,000 - 5.24 LI 0.01 0.53
BRS 246 RR 2010/11
I
R5.3 Y= 1,000 - 6.63 LI 0.01 0.19
R5.4 Y= 1,000 - 6.81 LI 0.01 0.79
R5.5 Y= 1,000 - 6.57 LI 0.01 0.81
II
R5.3 Y= 1,000 - 5.93 LI 0.001 0.88
R5.4 Y= 1,000 - 4.47 LI 0.01 0.90
R5.5 Y= 1,000 - 3.63 LI 0.01 0.60
Table 2. Linear regression equations relating soybean grain yield (Y), normalized to 1,000 kg/ha to the leaflet incidence (LI) of Asian rust, in the
phenological stage R5.3, R5.4 and R5.5, showing the significance level (p) and the coefficient of determination (R2
) for cultivars BRS GO 7560 and BRS 246 RR. Passo Fundo, Rio Grande do Sul State, Brazil
* For the growing season 2009/2010, the first sowing time (I) was 11/26/2009 and the second sowing time (II) was 12/16/2009, for the growing season 2010/2011, the first sowing time (I) was 11/12/2010 and the second sowing time (II) was 01/01/2010.
7560 was 46.35 and for BRS 246 RR, 29.74, based on the means of eight equations (Table 4).
The current recommendation for fungicide application is when the epidemic plants incidence reaches 1% or, preventively, when rust occurs in the region; thus, with little scientific support (14).
The yield loss coefficient, a, representing the kilograms one LI, lesion or uredinium needs to reduces normalized grain yield, varied according to the cultivar, the growing season and sowing time.
Based on these relationships, for a farm with an estimated yield of 2,800 kg/ha, growing a cultivar with ASR susceptibility similar to that of BRS 246 RR, each (mean of 12 equations) LI occurring at the early R5.5 would have a loss potential of 153.3 kg/ ha. Nevertheless, it is
necessary to know the yield potential of a farm to convert the 1,000 kg normalized yield into the actual yield of the field under evaluation for loss determination.
R5.3) (Table 2) (where Y is the grain yield, normalized to 1,000 kg/ha and I the rust leaflet incidence); in this case, LC = 7.02 kg for each ton of produced soybeans. Converting yield into tons, Y = 1.0 - 0.00702 I; Ce
= control efficiency taken as 70% (Ce for cyproconazole + azoxystrobin 70%; for picoxystrobin + cyproconazole 69%; for epoxiconazole + pyraclostrobin 68%; and for trifloxystrobin + cyproconazole 64%)
Cultivar/ Season
Sowing time* Phenological stages Equation [Y= 1,000 – a (L)]
p R2
BRS GO 7560 2009/10
I R5.4 Y= 1,000 - 127.4 L 0.001 0.84
R5.5 Y= 1,000 - 85.61 L 0.001 0.57
II R5.4 Y= 1,000 - 119.20 L 0.001 0.31
R5.5 Y= 1,000 - 95.72 L 0.001 0.73
BRS GO 7560 2010/11
I R5.4 Y= 1,000 - 87.11 L 0.01 0.83
R5.5 Y= 1,000 - 85.61 L 0.01 0.84
II R5.4 Y= 1,000 - 26.87 L 0.001 0.98
R5.5 Y = 1,000 - 17.51 L 0.001 0.97
BRS 246 RR 2009/10
I R5.4 Y= 1,000 - 64.26 L 0.001 0.89
R5.5 Y= 1,000 - 62.29 L 0.01 0.87
II R5.4 Y = 1,000 - 68.78 L 0.0001 0.88
R5.5 Y = 1,000 - 68.34 L 0.0001 0.84
BRS 246 RR 2010/11
I R5.4 Y= 1,000 - 103.7 L 0.001 0.93
R5.5 Y= 1,000 - 25.93L 0.01 0.79
II R5.4 Y= 1,000 - 77.47 L 0.001 0.96
R5.5 Y= 1,000 - 13.34 L 0.001 0.99
Table 3. Linear regression equations relating soybean grain yield (Y), normalized to 1,000 kg/ha to leaflet lesions (L) density (no./cm2) of Asian
rust, in the phenological stage R5.4 and R5.5, showing the significance level (p) and the coefficient of determination (R2
) for the cultivars BRS GO 7560 and BRS 246 RR. Passo Fundo, Rio Grande do Sul State, Brazil
* For the growing season 2009/2010, the first sowing time (I) was 11/26/2009 and the second sowing time (II) was 12/16/2009; for the growing season 2010/2011, the first sowing time (I) was 11/12/2010 and the second sowing time (II) was 01/01/2010.
Cultivar/ Season
Sowing time* Phenological
stages
Equations Y= 1,000 – a (U)
p R2
BRS GO 7560 2009/10
I R5.4 Y= 1,000 - 74.92 U 0.0001 0.86
R5.5 Y= 1,000 - 45.28 U 0.0001 0.55
II R5.4 Y= 1,000 - 110.28 U 0.01 0.86
R5.5 Y= 1,000 - 39.52 U 0.01 0.89
BRS GO 7560 2010/11
I R5.4 Y= 1,000 - 58.04 U 0.01 0.89
R5.5 Y= 1,000 - 30.48 U 0.01 0.97
II R5.4 Y= 1,000 - 6.79 U 0.001 0.97
R5.5 Y= 1,000 - 5.53 U 0.01 0.96
BRS 246 RR 2009/10
I R5.4 Y= 1,000 - 35.61 U 0.01 0.84
R5.5 Y= 1,000 - 26.11 U 0.01 0.82
II R5.4 Y= 1,000 - 34.45 U 0.0001 0.89
R5.5 Y= 1,000 - 34.42 U 0.001 0.92
BRS 246 RR 2010/11
I R5.4 Y= 1,000 - 51.38 U 0.001 0.95
R5.5 Y= 1,000 - 12.49 U 0.01 0.89
II R5.4 Y= 1,000 - 9.03 U 0.01 0.89
R5.5 Y= 1,000 - 34.42 U <0.0001 0.99
Table 4. Linear regression equations relating soybean grain yield (Y), normalized to 1,000 kg/ha to the leaflet uredinium (U) density (no./cm2
) of Asian rust, in the phenological stage R5.4 and R5.5, showing the significance level (p) and the coefficient of determination (R2) for the cultivars BRS GO 7560 and BRS 246 RR. Passo Fundo, Rio Grande do Sul State, Brazil
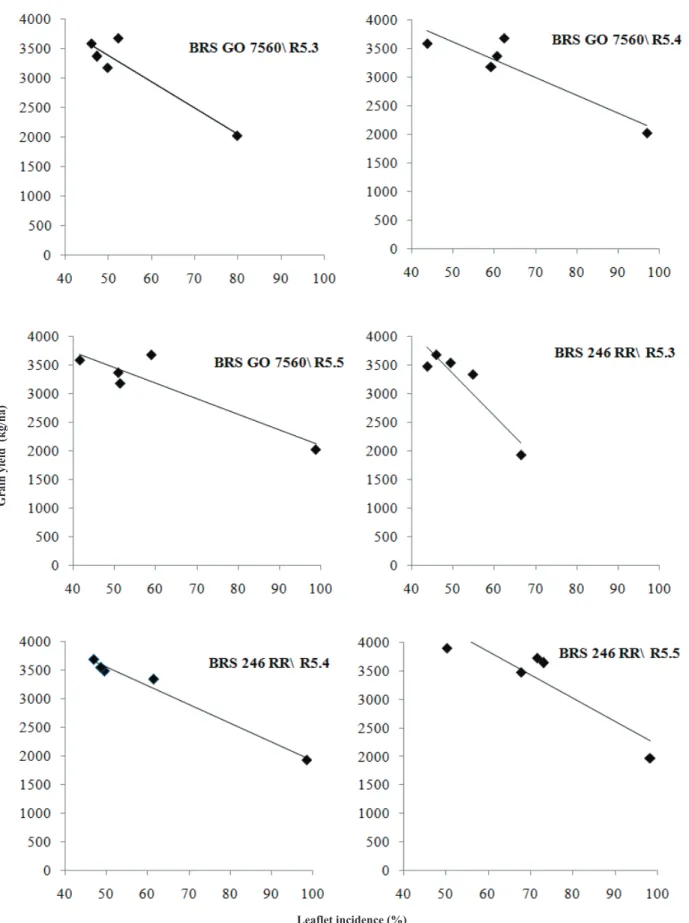
Grain yield (kg/ha)
Leaflet incidence (%)
Figure 1. Relationship between leaflet incidence (%) and grain yield (soybean pathosystem x Asian soybean rust) for BRS GO 7560 and BRS
(5); Yp is the crop potential yield (kg/ha) that LC shouldbe adjusted to the crop yield by calculating LC x Yp. For example, a farm with Yp = 2,800 kg/ha, or and 2.8 t/ha, and considering the LC = 1,000 – 7.02 I, or Y = 1.0 – 7.02 LI, and Yp = 2.8 t/ha, therefore, LC= 2.8 x 7.02 = 19.656; or converted into tons: 0.019656 t/1% LI. Inserting the values in the formula, DI = [Cc/ (Pp*LC)]*Ce we have DI = [55.00/ (450.00 * 0.019656)] * 0.7 = 4.35 LI. According to the calculated ELT of 4.35 LI, loss (US$) due to rust (kg/ha) was US$55.00/ha. Finally, the determined DI is the numerical loss threshold (NLT) according to Munford & Norton (10). Regarding the determined ELT of 4.35 LI, the loss (US$/ha) due to disease damage (kg/ha) will be US$55.00/ha.
Hikishima et al. (8) established the loss functions for the pathosystem ASR, relating disease severity, solar radiation reflectance measurements and grain yield, and discussed the potential use of remote sensing to estimate the loss caused by this disease, the potential loss was estimated based on the regression analysis between productivity and disease severity, represented by the area under the disease progress curve (AUDPC), or reflectance, represented by the normalized difference vegetation index (NDVI). Based on the estimated LC, the loss potential was calculated, as well calculated ELT, which indicated the best time for economic application of fungicides. The loss function
equation showed that for every NDVI unit, observed in stage R5.5, there was an increase of 197.6 kg/ha in productivity and, for each AUDPC unit yield was reduced 129 kg/ha. Considering the loss coefficients obtained with each equation, the ELT for ASR control was 0.7 NDVI units and 1.1 AUDPC units. In another trial, regression analysis showed that for each NDVI unit, at stage R5.4, there was an increase of 167.8 kg/ha, and one unit for each AUDPC was decreased from 69.2 kg/ha. Thus, the ELT for this experiment was 0.9 NDVI unit and 2.1 for each AUDPC unit.
A study was published on the loss functions in Taiwan by Hartman et al. (7). The authors obtained equations, generated according to the application of fungicides at different rates and in phenological stages in two soybean cultivars. Some of the functions generated were: Y = 97.41 - 0.69 S, R2 = 0.86 Y= 68.91 - 0.49 S, R2 = 0.90, Y = 113.32 - 0.83 S, R2= 0.93, and R = 75.45 - 1.07 S + 0.006 S2, R2 = 0.75, where Y is the grain yield and ASR estimated foliar severity. Estimated severity is subjective, difficult to implement for ASR and not comparable with our data.
Yang et al. (21) related defoliation (%) to disease severity for several soybean cultivars in two seasons and concluded that defoliation can be caused by factors other than ASR, indicating that the relationship
Grain yield (kg/ha)
Lesions (no./cm2
)
Figure 2. Relationship between lesions (no/cm2) and grain yield (soybean pathosystem x Asian soybean rust) for BRS GO 7560 and BRS 246 RR,
Grain yield (kg/ha)
Uredinium (no./cm2
)
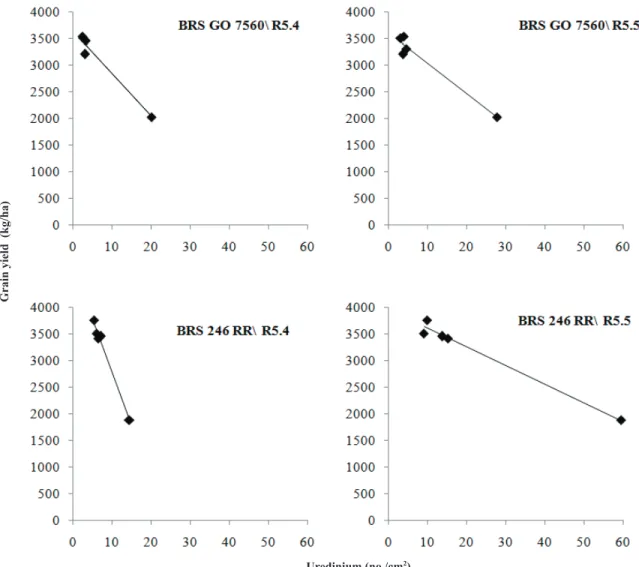
Figure 3. Relationship between uredinium (no./cm2
) and grain yield (soybean pathosystem x Asian soybean rust) for BRS GO 7560 and BRS 246 RR, in the phenological stage R5.4 and R5.5.
between defoliation and yield would not be a good model to estimate loss. Yang et al. (20) quantified the loss caused by ASR based on the rate of grain weight (g/day) assessed in R4 to R7, with the AUDPC in two seasons. Some of the functions generated were: Y = 52.0 - 13.90 x, R2 = 0.94, Y = 51.7-10.13 x, R2 = 0.98, Y = 42.8-18.69 x, R2 = 0.59, Y = 2,341.4 - 3,201.4 x, R2
= 0.71.
In the 2006/07 season, in Passo Fundo - RS, two loss functions were developed for the cultivar CD 214 in the growth stage R5.3, where Y = 3,055.63 - 78.29 L (R2
= 0.64; p < 0.001) and at R6, Y = 3,186.5 - 25.13 L (R2 = 0.81; p < 0.001, where Y is grain yield and L the number of lesions/cm2 . In that study, the maximum loss was 56.5 % (22), with the LCs close to those found in our study. In experiments carried out in Cambé County, PR, during three seasons the loss caused by ASR in cultivars with different disease reaction as quantified. The disease gradient was generated by fungicide applications in different growth stages, and the LC was generated from regressions between grain yield and AUDPC. In one experiment LCs (reduction in grain yield for each 1% AUDPC) ranged from 34.55 kg/ha to 163.81 kg/ha (R2
from 0.82 to 0.93), and in another experiment LCs ranged from 34.6 kg/ha to 80.8 kg/ha(R2 from 0.82 to 0.93) (9).
The greatest losses were found in the earliest evaluation stage R5.3
for both cultivars. Thus, early infections caused a greater yield reduction when compared to the later infection, for example in the stage R5.5 for both cultivars. Lesion density explained grain yield better reduction than uredinium density.
The obtained loss functions had the highest LCs for the stage R5.3, reinforcing the reports by Cook et al. (3) for wheat, Reis et al. (12) for corn, Bohatchuk et al. (2) for wheat, and Nerbass Junior et al. (11) for oats. These authors found the greatest LCs in the early crop development.
The LCs for BRS GO 7560 resistant cultivar, were higher than those for BRS 246 RR susceptible. According to Souza et al. (18), cultivar BRS GO 7560 carries a major gene that confers vertical resistance to ASR. It should be emphasized, however, that under a favorable environment and high inoculum density, this cultivar may show some lesions due susceptibility (tan spot) and also some sporulation, although low.
than estimated severity to estimating loss. The equations relating ASR intensity to grain yield can be used to estimate the loss caused by ASR to cultivars with a similar susceptibility/resistance to that of the cultivars tested in the present study. This study concluded that the loss equations functions can be used to calculate the ELT, and that it is an option to indicate the time to start the ASR chemical control.
This is a pioneer study generating disease gradient through the use of different intervals (days) of fungicide application using the same dose. Control strategy for ASR should take into consideration that early infections and the increasing number of lesions cause the greatest damage.
ACKNOWLEDGMENTS
We would like to thank the Coordenação de Aperfeiçoamento de Pessoal de Nível Superior - CAPES and the Programa de Suporte à Pós-Graduação de Instituições de Ensino Particulares - PROSUP Universidade de Passo Fundo-UPF for the scholarships.
REFERENCES
01. Bergamin Filho, A.; Amorim, L. (Eds.) Doenças de plantas tropicais: epide-miologia e controle econômico. Piracicaba. Agronômica Ceres, 1996. 289p.
02. Bohatchuk, D.A.; Casa, R.T.; Bogo, A.; Kuhnem Junior, P.R.; Reis, E.M.; Moreira, É.N.; Modelo de ponto crítico para estimar danos de doenças foliares do trigo em patossistema múltiplo. TropicalPlant Pathology, Brasília, v.33, n.5, p.363-369, 2008.
03. Cook, R.J.; Hims, M.J.; Vaughan, T.B. Effects of fungicide spray timing on winter wheat disease control. Plant Pathology, St. Paul, v.48, n.1, p.33-50, 1999.
04. Cruz, T.V.; Peixoto, C.P.; Martins, M.C.; Laranjeira, F.F.; Lima Lopes, P.V.; Andrade, N.S.; Silva Ledo, C.A. Perdas causadas pela ferrugem-asiática em cultivares de soja semeadas em diferentes épocas, no Oeste da Bahia.
Tropical Plant Pathology, Brasíliav.37, n.4, p.255-265, 2012.
05. Godoy, C.V.; Da Silva, L.H.C.P.; Utiamada, C.M.; Siqueri, F.V.; Lopes, I.D.O.N.; Roese, A.D.; Machado, A.Q.; Forcelini, C.A.; Pimenta, C.B.C.; Nunes, D.M. Eficiência de fungicidas para controle da ferrugem asiática da soja, Phakopsora pachyrhizi, na safra 2008/09. In:Reunião do Consórcio Antiferrugem Safra 2008/09, Londrina. Resumos. Londrina: Embrapa Soja, 2009. p. 71-88. (Documento 315).
06. Godoy, C.V.; Del Ponte, E.M.; Canteri, M. Epidemiologia da ferrugem da soja. In.: Workshop de Epidemiologia, 2., 2007, Campos do Jordão.
Resumos. Campos do Jordão: ESALQ, 2007 p.77-81.
07. Hartman, G.L.; Wang, T.C.; Tschanz, A.T. Soybean rust development and the qualitative relationship between rust severity and soybean yield. Plant Disease, St. Paul, v.75, n. 6, p.596-600, 1991.
08. Hikishima, M.; Canteri, M.G.; Godoy, C.V.; Koga, L.J.; Silva, A.J. Quan-tificação de danos e relações entre severidade, medidas de
refletância e produtividade no patossistema ferrugem asiática da soja.Tropical Plant Pathology, Brasília, v.35, n.2, p.096-103, 2010.
09. Koga, L.J.; Canteri, M.G.; Calvo, É.S.; Xavier, S.A.; Harada, A.; Unfried, J.R.; Kiihl,R.A.S. Chemical control and responses of susceptible and resistant soybean cultivars to the progress of soybean rust. Tropical Plant Pathology, Brasília, v.36, n.5, p.294-302, 2011.
10. Munford, J.D.; Norton, G.A. Economic of decision making in pest manage-ment. Annual Review Entomology, Palo Alto, v.29, p.157-174, 1984. 11. Nerbass Junior, F.M.; Casa, R.T.; Kuhnem Júnior, P.R.; Gava, F.; Bogo,
A. Modelos de pontos críticos para relacionar o rendimento de grãos de aveia branca com a intensidade de doença no patossistema múltiplo fer-rugem da folha – Helmintosporiose. Ciência Rural, Santa Maria, v.40, n.1, p.1-6, 2010.
12. Reis, E.M.; Santos, J.A.P.; Blum, M.M.C. Critical-point yield model to estimate yield damage caused byCercospora zea-maydisin corn. Tropical Plant Pathology, Brasília, v.32, n.2, p.110-113, 2007.
13. Reunião de Pesquisa da Soja da Região Sul, Indicações Técnicas para a Cultura da Soja no Rio Grande do Sul e em Santa Catarina 2009/2010. Porto Alegre: Universidade Federal do Rio Grande do Sul. p.144, 2009. 14. Reunião de Pesquisa da Soja da Região Sul, Indicações Técnicas para a
Cultura da Soja no Rio Grande do Sul e em Santa Catarina, safras 2012/2013 e 2013/2014. Passo Fundo: Embrapa Trigo. p.142, 2012. 15. Ritchie, S.; Hanway, J.J.; Thompson, H.E. How a Soybean Plant Develops.
Ames, Iowa State University of Science and Technology, Cooperative Extension Service. p 20, 1982.
16. Sah, D.N.; Mckenzie, D.R. Methods of generating different levels of disease epidemics in loss experiments. In: Teng, P.S. (ed.) Crop loss assessment and pest management. The American Phytopathological Society, Palo Alto, p.90-95, 1987.
17. Sinclair, J.B.; Hartman, G.L. Soybean rust. In: Hartman, G.L.; Sinclair, J.B.; Rupe, J.C. (Eds.) Compendium of soybean diseases. 4a ed. St. Paul EUA. APS Press. p.3-4, 1999.
18. Souza, P.I.M.; Toledo, J.F.F.; Moreira, C.T.; Farias Neto, A.; Da Silva, A.S.; Arantes, N.E.; Mello Filho, O.; Carneiro, G.E.S.; Monteiro, P.M.F.O.; Arias, C.A.A.; Kaster, M.; Oliveira, M.F.; Pípolo, A.E.; Brogin, R.L.; Nunes Júnior, J.; Abdelnoor, R.V; Almeida, Á.M.R.; Meyer, M.C.; Andrade, P.J.M.; Carrão-Panizi, M.C.; Dias, W.P.; Moreira, U.V.J.; Neiva, L.C.S.; Nunes, M.R.; Seii, A.H.; Silva, L.O.; Silva, N.S.; Teixeira, R.N.; Soares, R.M.; Toledo, R.M.C.P.; Vieira; N.E. Variedade de soja resistente à ferru-gem (BRS GO 7560): posicionamento da nova tecnologia. In: Reunião do consórcio antiferrugem safra 2008-2009, Londrina. Resumos. Londrina: Embrapa Soja, 2009. p.89-92.
19. Waggoner, P.E.; Berger, R.D. Defoliation, disease and growth. Phytopathol-ogy, St. Paul, v.77, n.3, p.393-398, 1987.
20. Yang, X.B.; Tschanz, A.T.; Dowler, W.M.; Wang, T.C. Development of yield loss models in relation to reduction of components of soybean in-fected with Phakopsora pachyrhizi. Phytopathology, St. Paul, v.81, n.11, p.1420-1426, 1991.
21. Yang, X.B.; Royer, M.H.; Tschantz, A.T.; Tsia, B.Y. Analysis and
quanti-fication of soybean rust epidemics from seventy-three sequential planting
experiments. Phytopathology, St. Paul, v.80, n.12, p.1421-1427, 1990. 22. Zanatta, M.; Reis, E.M.; Zanatta, T.; Bogorni, R.; Remor, L.; Baruffi, D.A.