Annals of the University of Petroşani, Economics, 14(2), 2014, 281-288 281
ANALYSIS OF INFLATION RATE IN ROMANIA IN THE
PERIOD 2004-2013
ROXANA CRISTINA VÎLCU
*ABSTRACT: Inflation rate is one of the most important macroeconomic indicators calculated to track the evolution of prices from one period of time to another. A high rate of inflation impedes economic growth and development and reduces confidence in the currency. This material examines the evolution of inflation rate in our country for a period of 10 years (2004-2013). The role of research is to analyze the evolution in terms of inflationary in Romania in the context of EU accession. After 2000 Romania has experienced high rates of inflation that led to difficulty meeting the convergence criteria of our country in the EU currency. The period 2004-2013 is very important to position our country in the European Union. The analysis highlights that our country has paid attention to anti-inflationary policies and of the monetary implemented by the National Bank after joining the EU, given declining inflation in the analyzed period. The National Bank further work is important for achieving the convergence criteria and the possibility of moving Romania EUR currency.
KEY WORDS: inflation rate, Harmonised Indices of Consumer Prices, Consumer Price Index.
JEL CLASSIFICATION: E30, E31.
1. INTRODUCTION
Inflation is one of the macroeconomic phenomena studied in the last decades to prevent and control the evolution of prices from one period of time to another. Given the current macroeconomic context inflation is considered, primarily a negative economic phenomenon due to the effects it produces on a long period of time.
Inflation rate is the primary indicator that studies this phenomenon throughout the event and its evolution. This is calculated and analyzed in each country to study the growth of prices between two time periods, and for international comparisons. At European level, the main organization that provides data on inflation is Eurostat. The
282 Vîlcu, R.C.
data Eurostat provides is the basis for the comparison between the states of the European Union (EU) regarding the inflationist field.
After 1991 our country faced high inflation rates due to the transition to a market economy. They affected the economy at both macro and micro economic levels and caused the economic gap between our country and other European countries. Delayed fulfillment of conditions for EU integration led to Romania's accession the Union only in 2007. Inflation survey in the pre and post accession has an important role to quantify our country among the European countries in terms of inflationary. In this respect, this research analyzes the evolution of the national inflation rate for a period of 10 years from 2004 to 2013.
2. THEORETICAL CONSIDERATION
Inflation is the macroeconomic phenomenon that measures the evolution of prices over time. According to the economic concepts that study micro and macro phenomena on the market, inflation reflects a monetary imbalance, and is being perceived by the population as a continuous increase in prices. In order to quantify the inflation rate in our country, the National Institute of Statistics (NIS) calculates the Consumer Price Index (CPI). It measures the evolution of commodity prices and tariffs paid for services consumed by the population in a current period compared to a reference period. NIS calculates the CPI for three levels of aggregation: food goods group, non-food group and services group. For each of the three groups is collected data for at least 300 kinds of products in the Household Survey for the current year, then is processed by the NIS and then reported to the reference year.
Starting with 1992 NIS uses the same methodology for calculating the CPI, namely: compute the average consumer price index as the simple arithmetic average of the monthly indices, measured over the same base, the reference system is October 1990. The annual consumer price index is the leading provider that calculates inflation, so inflation rate is determined by subtracting 100 of CPI. The calculation of the instrument tracks the fulfilment of the inflation comparability criteria on a national and international level. CPI is a tool used to: measure the economy; evaluate the inflation process and forecast the measures that limit the inflation effects; assess the impact of rising prices above the purchasing power of the population. Also, one of the most used areas of the inflation effects is the possibility of comparing the level of convergence of EU Member States to the European economies.
Analysis of Inflation Rate in Romania in the Period 2004-2013 283
excluding assortments which are no longer found on the market. On long-term are adjusted and modified the weighting of food goods, non-food and services in the consumption basket changes according to consumer preferences.
From this basic information, is very interesting the surprise of Romania’s positioning among EU member states in terms of inflationary. With Romania's transition to a market economy, our country has experienced high rates of inflation. Our country's accession to the EU in 2007, with the fulfilment of the conditions for inclusion in the Union demonstrates the effects of anti-inflationary measures taken since 1990 to reduce inflation.
3. COMPARED EVOLUTION OF INFLATION RATE – RESULTS AND
DISCUSSIONS
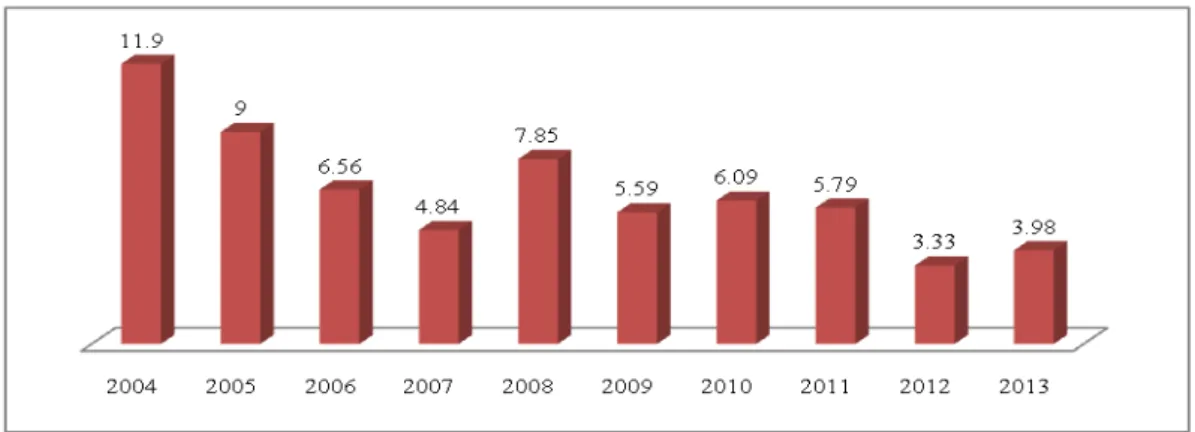
Inflation rate is the most used tool to analyze the evolution of prices from one period of time to another. To calculate the national inflation rate we determine the household consumption basket for the 3 main categories: food goods, non-food goods and services and calculate the evolution of prices for these three categories. This research aims to analyze the inflation rate in the period 2004-2013, in the context of Romania's integration in the EU. Our country joined the EU in 2007, along with Bulgaria. Besides order to characterize the evolution of prices nationwide, inflation rate is also one of the indicators that show the EU convergence criteria. In present conditions is very interesting to research how our country has evolved in terms of inflationary pre and post EU accession. In opening analysis the figure below details the evolution of the inflation rate expressed annually by the Consumer Price Index in the period 2004-2013.
Source: www.insse.ro
Figure 1. Evolution of inflation rate in CPI in Romania in the period 2004-2013
284 Vîlcu, R.C.
inflation rate decreased from 11.9% in 2004 to 3.98% at the end of 2013. The National Bank and the government measures taken to lower inflation effects have been felt especially in recent years, 2012 and 2013. For 2012 Central Bank has set an inflation target of 3%, which was exceeded by 0.33%, and for 2013 a target of 2.5% and for this year was exceeded by 1.48%.
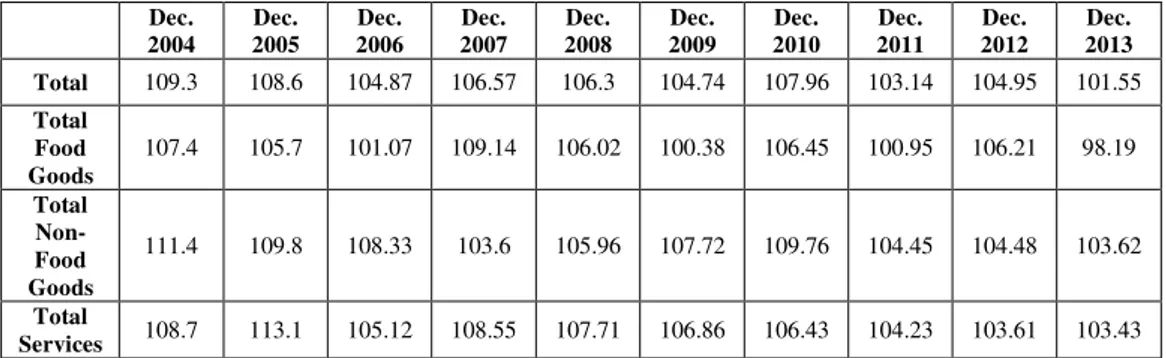
The table below details the Consumer Price Indices for the three categories: food goods, non-food goods, services and overall in the period 2004-2013. This indicator shows the evolution of prices in December of current year, from December the previous year.
Table 1. CPI for food goods, non-food goods and services in the period 2004-2013
Dec.
2004 2005 Dec. 2006 Dec. 2007 Dec. 2008 Dec. 2009 Dec. 2010 Dec. 2011 Dec. 2012 Dec. Dec. 2013 Total 109.3 108.6 104.87 106.57 106.3 104.74 107.96 103.14 104.95 101.55
Total Food Goods
107.4 105.7 101.07 109.14 106.02 100.38 106.45 100.95 106.21 98.19
Total Non-Food Goods
111.4 109.8 108.33 103.6 105.96 107.72 109.76 104.45 104.48 103.62
Total
Services 108.7 113.1 105.12 108.55 107.71 106.86 106.43 104.23 103.61 103.43 Source: www.insse.ro
As can be seen from the above table, the largest price increases were recorded for non-food goods, 11.4% in December 2004 compared to the same month of 2003 and 9.8% in December 2005 compared to December 2004. For category of services the prices increase with 8.7% to December 2004 compared to December of 2003. In respect of food products the price increase is observed up to 9.1% in December 2007 compared to December 2006. Also for the food products we notice that the prices decline with 1.81% in December 2013 compared to the same month of 2012. Overall (food goods, non-food goods and services) we notice that the prices increase up to 9.3% in December 2004 compared to December 2003.
For international comparisons in terms of inflation, the inflation rate allows no comparison, this is accomplished by the Harmonized Indices of Consumer Price (HICP). HICP is an indicator calculated by Eurostat, starting at NIS methodology, with the advantage that the criteria of comparability between EU countries. The main purpose of the determination and calculation of the HICP is to study the evolution of prices, and thus inflation, for EU, for evaluating the fulfilment of the convergence criteria.
Between the CPI inflation rate and HICP there are many similarities in the calculation methodology, but there are some differences, expressed as follows:
Analysis of Inflation Rate in Romania in the Period 2004-2013 285
CPI excludes from its calculation: consumption from own resources, domestic investments and savings and interest on loans, fines, taxes and insurance rates; while the HICP excludes from its calculation: state taxes, interest payments and fees related to the loan.
At the end of 2013, the EU account for 28 member states, for which the Eurostat methodology with data recorded by the national statistical institutes of the population, calculate the annual HICP inflation rate, information summarized below.
Source: http://epp.eurostat.ec.europa.eu/
Figure 2. Inflation rate in 2007 for the EU countries
The chart above details the inflation rate in 2007 for the 28 EU countries (in the year 2013). As you can see Romania had in 2007 an inflation rate of 4.9%, higher than the values of our country being registered by Bulgaria (7.6%), Estonia (6.7%), Latvia (10.1%) and Hungary (7.9%). Thus, we observe that all these countries with high inflation rates have joined the EU in 2004 (Estonia, Latvia and Hungary) or 2007, which translates to the short time available for convergence towards the EU in terms of inflationary.
Based on the above differences between the HICP and CPI is interesting to check these differences in the calculation of indicators. The table below shows the inflation rate in Romania in the period 2004-2013 calculated by CPI and HICP.
Table 2. Inflation rate in HICP and CPI in Romania in the period 2004-2013
2004 2005 2006 2007 2008 2009 2010 2011 2012 2013
Inflation rate in
HICP 11.9 9.1 6.6 4.9 7.9 5.6 6.1 5.8 3.4 3.2 Inflation rate in
286 Vîlcu, R.C.
As you can see from the table above, the conceptual differences between the CPI inflation rate and HICP are less felt in these two indicators in the mathematical results, up to a maximum of 0.1 percentage points in the period 2004 to 2012, only in 2013 the difference is larger, 0.72 percentage points. The explanations in this regard could be: very low cost of foreign tourists in Romania and the Romanian citizens abroad and very low weight in the HICP automatically or insufficient statistical information on the two components.
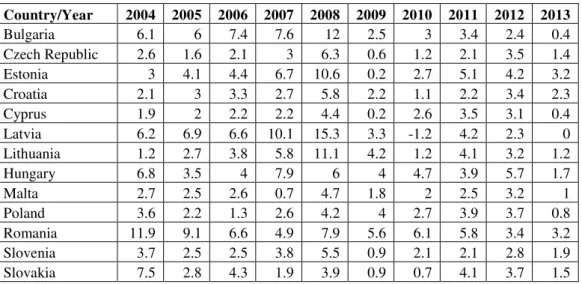
Since price stability and convergence recorded by countries that joined the EU by the end of 2003, we considered relevant the comparison of the inflation in our country to countries that joined the EU after 2004, namely: Estonia, Latvia, Hungary Cyprus, Lithuania, Malta, Poland, Czech Republic, Slovakia, Slovenia, Bulgaria and Croatia.
Table 3. Inflation rate in the period 2004-2013 for the countries that joined EU in 2004, 2007 and 2013
Country/Year 2004 2005 2006 2007 2008 2009 2010 2011 2012 2013
Bulgaria 6.1 6 7.4 7.6 12 2.5 3 3.4 2.4 0.4 Czech Republic 2.6 1.6 2.1 3 6.3 0.6 1.2 2.1 3.5 1.4 Estonia 3 4.1 4.4 6.7 10.6 0.2 2.7 5.1 4.2 3.2 Croatia 2.1 3 3.3 2.7 5.8 2.2 1.1 2.2 3.4 2.3 Cyprus 1.9 2 2.2 2.2 4.4 0.2 2.6 3.5 3.1 0.4 Latvia 6.2 6.9 6.6 10.1 15.3 3.3 -1.2 4.2 2.3 0 Lithuania 1.2 2.7 3.8 5.8 11.1 4.2 1.2 4.1 3.2 1.2
Hungary 6.8 3.5 4 7.9 6 4 4.7 3.9 5.7 1.7
Malta 2.7 2.5 2.6 0.7 4.7 1.8 2 2.5 3.2 1
Poland 3.6 2.2 1.3 2.6 4.2 4 2.7 3.9 3.7 0.8 Romania 11.9 9.1 6.6 4.9 7.9 5.6 6.1 5.8 3.4 3.2 Slovenia 3.7 2.5 2.5 3.8 5.5 0.9 2.1 2.1 2.8 1.9 Slovakia 7.5 2.8 4.3 1.9 3.9 0.9 0.7 4.1 3.7 1.5 Source: http://epp.eurostat.ec.europa.eu/
As we can see from the table above, during 2004-2013, high rates of inflation (over 10%) were recorded in Estonia, Latvia, Lithuania and Romania. These are also the countries with the largest differences from one year to another.
To better understand the evolution of inflation in the analysis we will introduce, as a measure of variability to central tendency, dispersion. This, as a synthetic indicator of spreading, “summarizes in a single numerical expression variation of individual values from the central tendency of features tracked in a statistical population.”(Isaic-Maniu, Mitrut, Voineagu, pp. 166). Formula for calculating the dispersion of a single set is:
Analysis of Inflation Rate in Romania in the Period 2004-2013 287
where:
- represents the dispersion for a simple set of values; - represents average values recorded.
Calculating the dispersion of inflation rate for the 13 countries that joined the EU in 2004, 2007 and 2013 for the period 2004-2013 are obtained the following information:
Table 4. Average and dispersion of inflation rate in the period 2004-2013 for the countries who joined EU in 2004, 2007 and 2013
Country Average Dispersion Country Average Dispersion
Bulgaria 5.08 10.4396 Hungary 4.82 2.9256
Czech Republic 2.44 2.3304 Malta 2.37 1.1441
Estonia 4.42 6.8276 Poland 2.9 1.262
Croatia 2.81 1.4009 Romania 6.45 6.2385
Cyprus 2.25 1.4845 Slovenia 2.78 1.4676
Latvia 5.37 21.2601 Slovakia 3.13 3.7481
Lithuania 3.85 7.9365
Source: Data obtained by author calculations with information from, http://epp.eurostat.ec.europa.eu/
Of the 13 countries analyzed, for 7 of them were obtained low levels of dispersion, namely: the Czech Republic, Croatia, Cyprus, Hungary, Malta, Poland and Slovenia, which means that they are also the countries that have faced the fewest problems with price stability. For the other six countries: Bulgaria, Estonia, Latvia, Lithuania, Romania and Slovakia were achieved high levels of dispersion, which translates into high rates of inflation and price increases in the period analyzed.
4. CONCLUSIONS
288 Vîlcu, R.C.
5.ACKNOWLEDGEMENT
This work was cofinanced from the European Social Fund through Sectoral Operational Programme Human Resources Development 2007-2013, project number POSDRU/159/1.5/S/134197 “Performance and excellence in doctoral and postdoctoral research in Romanian economics science domain”.
REFERENCES:
[1]. Anghelache, C.; Anghelache, G.V.; Dumitrescu, D.; Dragomir, B.; Soare, D.V. (2014) The Evolution of the Index of Population Consumption Prices, Romanian Statistical Review, Supplement, nr. 4, pp. 98-107
[2]. Anghelache, C.; Voineagu, V.; Anghelache, G.V.; Manole, A. (2012) Aspects of the analysis of the evolution of inflation, Theoretical and Applied Economics, Vol. XIX, pp. 3-11
[3]. Anghelache, C.; Gheorghe, M.; Voineagu, V. (2012) Methods of measurement and analysis of inflation, Economic Publishing, pp. 125-248
[4]. Anghelache, C.; Isaic-Maniu, A.; Mitrut, C.; Voineagu, V. (2007) System of National Accounts, Economic Publishing, pp. 105-175
[5]. Danciu, A.R.; Niculescu Aron, I.G.; Gruiescu, M. (2009) Statistică Economică, Editura
Enciclopedică, București
[6]. Isaic-Maniu, A.; Mitrut, C.; Voineagu, V. (2004) Statistics, Academic Publishing, pp.157-183
[7]. National Institute of Statistics [online] Available at www.insse.ro, last accessed on 10 October 2014
[8]. National Bank of Romania [online] Available at www.bnr.ro, last accessed on 03 October 2014