Childhood Symptoms of ADHD Overrule
Comorbidity in Relation to Psychosocial
Outcome at Age 15: A Longitudinal Study
Eva Norén Selinus1*, Yasmina Molero2, Paul Lichtenstein2, Tomas Larson3, Sebastian Lundström3,4, Henrik Anckarsäter3, Clara Hellner Gumpert1
1Department of Clinical Neuroscience, Centre for Psychiatry Research & Education, Karolinska Institutet & Stockholm County Council, Stockholm, Sweden,2Department of Medical Epidemiology and Biostatistics, Karolinska Institutet, Stockholm, Sweden,3Center for Ethics, Law and Mental Health (CELAM), University of Gothenburg, Göteborg, Sweden,4Gillberg Neuropsychiatry Centre, University of Gothenburg, Göteborg, Sweden
*eva.noren@ki.se
Abstract
Objective
Neurodevelopmental problems (NDPs) may influence the transition from childhood to ado-lescence. Our aim was to study long-term psychosocial outcomes of NDPs, focusing on ADHD.
Method
Data was collected through a telephone interview with parents of twins at ages 9 or 12 years. NDP screen-positive children were clinically assessed at age 15; N = 450. Psychoso-cial outcome concerning peers, school, internalizing problems, antisoPsychoso-cial behavior, alcohol misuse, drug misuse, and impaired daily functioning was examined.
Results
Even after controlling for other NDP comorbidity, screen-positivity for ADHD doubled or tri-pled the odds of later psychosocial problems. When controlling for parental education level, the significant effect of ADHD remained only for antisocial behavior and impaired daily functioning.
Conclusions
Signs of NDPs as well as other psychiatric diagnoses at ages 9 or 12 years are associated with a more problematic adolescence. However, despite the presence of comorbidity, early ADHD symptoms stand out as the most important risk factor for later antisocial development and impaired daily functioning.
OPEN ACCESS
Citation:Norén Selinus E, Molero Y, Lichtenstein P, Larson T, Lundström S, Anckarsäter H, et al. (2015) Childhood Symptoms of ADHD Overrule Comorbidity in Relation to Psychosocial Outcome at Age 15: A Longitudinal Study. PLoS ONE 10(9): e0137475. doi:10.1371/journal.pone.0137475
Editor:Daimei Sasayama, National Center of Neurology and Psychiatry, JAPAN
Received:May 10, 2015
Accepted:August 17, 2015
Published:September 11, 2015
Copyright:© 2015 Selinus et al. This is an open access article distributed under the terms of the Creative Commons Attribution License, which permits unrestricted use, distribution, and reproduction in any medium, provided the original author and source are credited.
Data Availability Statement:Due to ethical restrictions related to protecting confidentiality connected to the Swedish Twin Registry, all relevant data are available upon request pending approval from the Karolinska Institutet Ethics Committee. Requests may be sent to the Principal Investigator, Dr. Clara Hellner Gumpert (Clara.Gumpert@ki.se), or to Karolinska Institutet by e-mail (info@ki.se) or regular mail (Karolinska Institutet, SE-171 77 Stockholm, Sweden).
Introduction
Childhood neurodevelopmental problems (NDPs; i.e., attention deficit and hyperactivity disor-der [ADHD], autism spectrum disordisor-der [ASD], tic disordisor-der [TD], developmental coordination disorder [DCD], and learning disabilities [LD]), affect around 10% of all children [1]. ADHD is the most common disorder, the prevalence being between 5 and 10% [2–4], while the preva-lence of ASD ranges between 1% and 2.6% [5–7]. About 1.5% of children meet criteria for LD [8–10], and 1% to 6.6% of children meet criteria for TD [11–14]. DCD has an estimated preva-lence of about 5% [15,16].
Children with NDPs have a higher risk of functional and psychosocial difficulties, increased mortality, and mental health problems, and often require a wide selection of life-long interven-tions from medical and social services [17]. Several studies have shown that children with ADHD are at risk for school failure, emotional difficulties, substance misuse, antisocial behav-ior and poor peer relationships in adolescence [18–23], and are more impaired in psychosocial, educational and neuropsychological functioning as adults [17]. Studies that have investigated psychosocial problems in NDPs other than ADHD are, however, scarce [24,25]. The few studies that have examined associated problems of ASD, TD, LD, and DCD, have focused on psychiatric comorbidities [26,27], academic difficulties [28,29], and peer victimization [30,
31], and less attention has been paid to substance misuse and antisocial behavior [32–34]. Fur-thermore, research has been restricted by small samples, cross-sectional data or short-term fol-low-up [35,36].
Children with one NDP diagnosis frequently demonstrate comorbidity with other NDP diagnoses [37–39]; for example, many children with ADHD also exhibit ASD symptoms [9,
40–43]. Studies have also reported large co-existence between TD and ADHD, LD and ASD [44–47]. Furthermore, up to 50% of children with LD or ADHD or ASD present DCD symp-toms [48–50]. It has further been shown that individuals drift between NDP diagnoses [1,51], leading to the suggestion that these diagnoses are not discrete disorders or syndromes. This notion was supported by findings from a study by Larson and colleagues [52]. In a Swedish sample screened for NDP diagnoses at ages 9 or 12 years (n = 198), about 50% received a clini-cal NDP diagnosis at 15, but only 40% of these received the same diagnosis as at the earlier screening. The same relationship was found in a Swedish clinical study [53].
NDP comorbidity is an important clinical feature and may have implications for diagnosis and treatment, as individuals with comorbid NPDs could present a more severe form of the disorders [32], and subsequently have a poorer long-term prognosis [51,54]. Thus far, few studies have taken NDP comorbidity into account when examining long-term outcomes as most studies have examined outcomes of ADHD, ASD, DCD, LD and TD separately.
Given that NDPs are not entirely discrete disorders, comorbidity of NDPs needs to be sys-tematically addressed both at baseline and follow-up in longitudinal studies, in order to exam-ine if NDPs should be considered as a group of problem domains with shared outcomes. Likewise, it is equally important to consider a broad spectrum of psychosocial outcomes, since different symptom profiles may be linked to different outcomes.
Aim
The aim of the present study was to examine the association between signs of ADHD and/or other NDPs (at ages 9 or 12 years) and negative psychosocial outcomes at age 15. Negative psy-chosocial outcome was defined as the presence of any of the following: peer problems, school/ educational problems, internalizing problems, antisocial behavior, alcohol misuse, substance misuse, and/or impaired level of daily functioning/global impairment.
Foundation. The study funders had no role in the design, collection, analysis, or interpretation of the data, or in the writing or decision to submit the manuscript.
Methods
Subjects at Baseline
The Child and Adolescent Twin Study in Sweden (CATSS) [32] is an ongoing study that tracks all twins born in Sweden from July 1992 and onwards. A telephone interview including the Autism–Tics,ADHD, and otherComorbidities inventory (A-TAC) is conducted with the parents of all participating twins in connection with the children’s 9thor 12thbirthday (parents to twins born before July-95 were interviewed at age 12; those born July -95 and after were interviewed at age 9). As of January 2014, 12,500 A-TAC interviews had been performed, cov-ering 25,000 twins. The overall response rate was 75%.
In the present study, 860 twins were eligible for inclusion. The response rate was 52%. 450 participated fully: 247 screen-positive for NDP and/or NDP related behavioral disorder (144 boys, 103 girls), 157 screen-negative (88 boys, 69 girls), and 46 randomly chosen sex-matched controls (30 boys, 16 girls). There were 38 twin pairs where both twins were screen-positive for a NDP (23 pairs of boys and 15 pairs of girls). An analysis of the attrition group in comparison with the study group is presented inTable 1.
The A-TAC interview. The A-TAC was designed as an easy-to-administer, dimensional, and comprehensive interview to assess a broad scope of NDPs, and yields dimensional ratings of symptoms, suffering and dysfunction in a range of neurodevelopmental and psychiatric dis-orders, including ASD, ADHD, LD, TD and DCD. The investigators from a market research company (”Intervjubolaget”) who have all been trained in using the computerized version of the A-TAC inventory administer the telephone interview. All interviews are performed by lay-persons. The average interview time for the A-TAC in the CATSS is about 30 minutes.
In previous validation studies, the A-TAC inventory has shown good test-retest measures, excellent inter-rater reliability and construct validity [52,55–57], and convergent validity with the Child Behaviour Check List [58]. The Hansson et al study from 2005 showed excellent screening properties for ASDs and ADHD in a clinical sample [56]. Hansson et al found that Areas under Receiver Operating Characteristics curves between interview scores and clinical diagnoses were approx. 0.90 for ADHD and ASD and above 0.70 for TD, LD, and DCD. Using optimal cut-off scores for ASD and ADHD, good to excellent kappa levels for interviews and clinical diagnoses were noted. Larson and colleagues replicated these results in 2010 [57], and cut-off scores to identify proxies to clinical diagnoses were established for ASDs, ADHD, DCD,
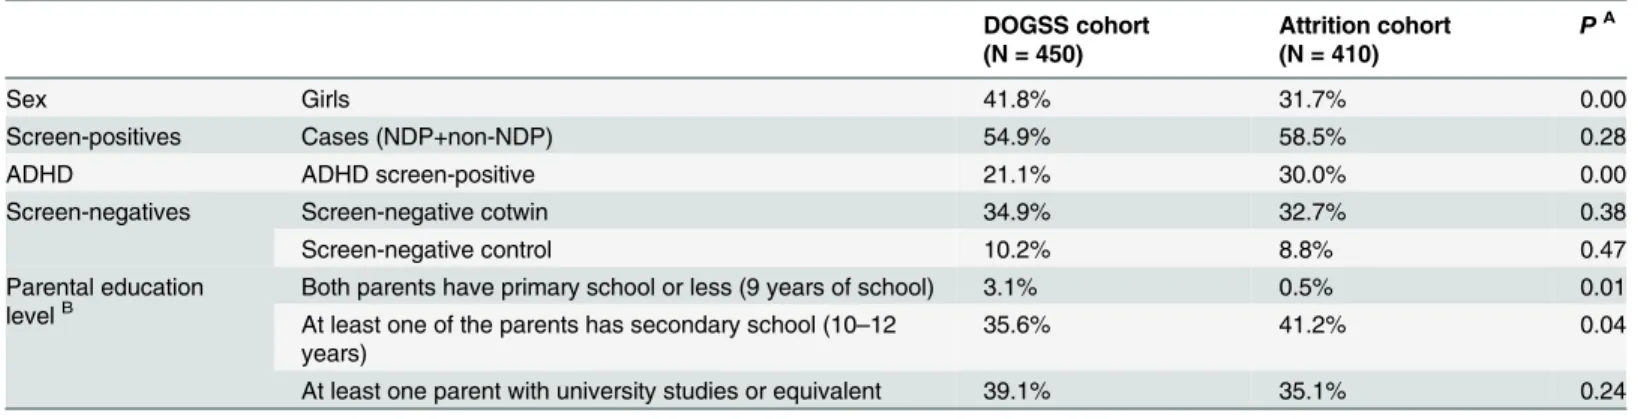
Table 1. Descriptive statistics. Comparison of frequencies in the DOGSS cohort and the attrition cohort.
DOGSS cohort (N = 450)
Attrition cohort (N = 410)
PA
Sex Girls 41.8% 31.7% 0.00
Screen-positives Cases (NDP+non-NDP) 54.9% 58.5% 0.28
ADHD ADHD screen-positive 21.1% 30.0% 0.00
Screen-negatives Screen-negative cotwin 34.9% 32.7% 0.38
Screen-negative control 10.2% 8.8% 0.47
Parental education
levelB Both parents have primary school or less (9 years of school) 3.1% 0.5% 0.01
At least one of the parents has secondary school (10–12 years)
35.6% 41.2% 0.04
At least one parent with university studies or equivalent 39.1% 35.1% 0.24
Note: Missing information on 22.2% of the DOGSS cohort, and 23.2% of the attrition cohort.
APvalue for comparison of distribution of qualitative variables between the DOGSS cohort and the attrition cohort with a Chi-square test BParental education level: A combination of both parents
’education levels.
LD and TD. These cut-off scores (concurrent validity) had sensitivities above 0.90 (0.95 for ASD and ADHD). The predictive value for the A-TAC concerning the DOGSS cohort has also been addressed in Larson et al.’s study from 2013. The results in that study showed that the sensitivity and specificity of A-TAC scores for predicting later (3 or 6 years) clinical diagnoses were good to excellent, with values of the area under the receiver operating characteristics curves ranging from 0.77 (ADHD) to 0.91 (ASD).
Screening at baseline (age 9/12)
In the A-TAC interview, cut-off scores for the different NDPs were determined and validated by two earlier studies [56,57]. ADHD traits were calculated as the sum of scores of both the inattention and hyperactivity-impulsivity domains, yielding between 0 and 19 points. A dichot-omous variable was created with a cut-off value of8 points. The ASD cut-off level was set at 4.5 (of a maximum of 17 points), LD traits at3.5 (out of 9), TD at2 (out of 4) and DCD at1.5 (out of 5) [57].
Subjects at Follow-up
Twins born 1993–1995 (n = around 4100) were eligible for the clinical follow-up at age 15, referred to as the DOGSS study (Developmental Outcomes in a Genetic twin Study in Sweden). Same-sex twin pairs, in which at least one in the pair screened positive for one or several of the targeted disorders at ages 9/12 (i.e. ASD, ADHD, TD, LD, DCD, and/or behavioral disorders with known NDP comorbidities, such as Obsessive Compulsive Disorder [OCD] and/or Oppo-sitional Defiant Disorder [ODD] and/or Conduct Disorder [CD] and/or Eating Disorder [ED]), were included. Randomly selected controls were included to create a population-based study group enriched for NDPs. From the 1995 cohort, the inclusion criteria were narrowed to include ASDs and ADHD only. The cohort (N = 860) was contacted by mail and invited to ticipate in a comprehensive clinical assessment, and a total of 452 adolescents consented to par-ticipate in the study (total response rate 52%). Two of the co-twins to screen-positive children had to be excluded from the present study due to missing A-TAC-data. In total, 450 partici-pated fully in both CATSS 9/12 and DOGSS, including 247 screen-positive children (144 boys and 103 girls), 157 screen-negative co-twins (88 boys and 69 girls), and 46 randomly chosen, sex-matched controls (30 boys and 16 girls from CATSS-9/12).
Procedure at follow-up
The follow-up assessment procedure included various self-report rating scales from a care-giver (i.e. the parent or parents that accompanied the twin to the clinical assessment partici-pated) and the teenager, as well as a thorough clinical assessment. For the purpose of this paper, we used: a) data from the parent and adolescent self-reports regarding psychosocial functioning at age 15, and b) the clinical psychologists’assessment of the teenager’s overall functional level (results from the diagnostic validation of the A-TAC interview have been reported elsewhere [52].
Psychosocial outcome at age 15
Peer problems. Peer problemswere assessed via the SDQ (Strengths and Difficulties Questionnaires) [60] using>5 points for self report (SR) and>3 points for parent report (PR) to indicate peer problems. The scale ranges between 0 and 10 points, where 0 is“no problems” and 10 is“serious problems”. The cutoff was chosen according to the standard for SDQ for abnormality. In addition, the inquiry of problems related to bullying was included.Being bul-liedwas described using Olweus Bully Victim Questionnaire [61], a self-rating scale from 1 (not been bullied) to 5 (several times a week during the last months), and was dichotomized with the recommended cut-off value of3.Bullying otherswas defined using the same ques-tionnaire, with a scale from 1 (not bullied others) to 5 (several times a week during the last months), and was dichotomized with a cut-off value of3.Any Peer problemwas defined as a dichotomous variable, indicating that at least one of the scales described above reached above cut-off level.
School problems. School problemswere defined as truancy, repetition of a school year and/or failure in grades.Truancywas assessed using Self-reported Delinquency [62–65], a self-rating scale, which was dichotomized with a cut-off value of4 points (indicating more than 3–5 times of illegal absence from school).Repetition of a school-yearwas dichotomized as yes/no andFailure in gradeswas dichotomized as yes/no (Yes—failed in majority of subjects; No—passed in majority/all of subjects), as assessed in the K-SADS interview.Any School problemwas defined as dichotomous (yes/no) variable indicating that at least one of the scales was scored above cut-off level.
Internalizing problems. Internalizing problemswere assessed through self-rating and parent-rating scales from SDQ, including the sub-scores for Emotional symptoms. Each score ´s range is between 0 (no problems) and 10 (serious problems).Emotional symptomsincluded psychosomatic symptoms, worry, unhappiness, nervousness, and fearfulness, and was dichoto-mized with a cut-off value of>6 for SR and>4 for PR, according to the standard for SDQ for abnormality.Any internalizing problemwas defined as a dichotomous (yes/no) variable indi-cating that at least one of the scales was scored above cut-off level.
Antisocial behavior. Antisocial behaviorwas defined through a combination of three dif-ferent self-reported measures of criminality, norm-breaking behavior and violent events using Self-reported Delinquency and SDQ.Criminalityincluded frequency of self-reported: a) non-violent criminal acts and b) non-violent criminal acts. Non-non-violent criminal acts ranging from 0 to 10, was dichotomized with a cut-off value of1 (at least one non-violent criminal act). Non-violent criminal acts were defined as vandalism, graffiti, fire, driving without a license, forgery of ID, car theft, theft, breaking into private property, and supplying illicit substances. Violent criminal acts was measured using self-reported violent behavior, including robbery, hurting animals, hurting a human, having sex with someone against her/his will with/without physical violence. It was expressed as frequency of self-reported violent acts, ranging from 0 to 6 and was dichotomized with a cut-off value of1 (once or more of one or several acts).Conduct problemswas assessed using: a) the K-SADS diagnose Conduct Disorder (yes/no) (which includes a Definite Diagnose [scored as 4 according to the K-SADS algorithm], a Probable Diagnose [3] and Diagnose in partial remission [5]) and b) SDQ Conduct Problems Score (self-rated and parent-rated). The SDQ questionnaire addressed conduct problems, and ranged between 0 (no problems) and 10 points (conduct problem several times a week during the last months). A dichotomous variable was created with a cut-off value of>4 points for SR and>3 points for PR, according to the standard for SDQ for abnormality.Any Antisocial behavior was defined as at least one of the antisocial problems above.
from 1 (“I don’t drink”) to 6 (“every time”) which was dichotomized with a cut-off value of3 (rarely/sometimes/once in a while), b)“Have you been drinking beer, wine or liquor last month?”which was dichotomized into yes/no.Any alcohol misusewas defined as at least one of the alcohol problems above.
Drug misuse. Drug misusewas assessed using the Substance abuse self-reported alcohol and drug use [62–65], and included measures of drug use and substance abuse diagnosis (sub-stance abuse diagnosis was assessed through the K-SADS interview).Drug misusewas defined as the reported use of any illicit drug and was dichotomized with a cut-off value of1 (used at least one illicit drug). The K-SADS classifies the substance abuse diagnosis into a Definite Diag-nose (4), a Probable DiagDiag-nose (3) and DiagDiag-nose in partial remission (5), and we included all of these.Any drug misusewas defined as at least one of the drug problems above.
CGAS. The Children’s Global Assessment Scale (CGAS) [59] is a clinician-rating tool used for both research purposes or in clinical settings. The rater is asked to assess the lowest overall level of psychosocial functioning during the preceding month. The scores range from 1 (the most impaired level) to 100 (the best level of functioning). CGAS is currently routinely used in many countries, and has also been used in several longitudinal and epidemiological studies [66–73]. Recent Swedish studies have been made concerning inter-rater reliability of CGAS [74] and comparing seminar and computer based training programs for CGAS on the accuracy and reliability of raters [75]. A third study showed that having a CGAS60 was an independent predictor of several adversities in young adulthood, such as criminal conviction, bipolar disorder and borderline personality disorder [76].CGASwas therefore dichotomized with a cut-off value of60, which was then expected to identify adolescents at higher risk of developing different types of psychosocial problems. The participating psychologists were all trained in evaluation according to CGAS.
Parental education level. Data on the parents’educational level was collected from the parent interview at age 9/12. It was divided into three levels: 1) Primary school (9 years of school) 2) Secondary school (10–12 years) 3) University studies or equivalent (>12 years). This was recorded for both of the parents separately, but summarized in the analysis to a con-tinuous variable ranging from 2 (both parents had level 1) to 6 (both parents had level 3).
Statistical Analyses
First, frequencies for all seven negative psychosocial outcome domains, including sub-catego-ries, are presented for the whole cohort (n = 450). In a second step, frequencies of all seven psy-chosocial outcomes are presented for each positive diagnose at baseline (i.e. screen-positive according to the A-TAC interview; NDPs and other diagnoses), for screen-negative siblings of cases and for screen-negative random controls, respectively. Furthermore, a category was added to indicate the frequency of individuals with no reports in any of the seven negative psychosocial outcome domains, labeled as‘No Problem’.
Since our definition of antisocial behaviors included a wide variety of antisocial acts, we also wanted to determine if the severity of antisocial behavior was associated differently to different NDP groups. We therefore distinguished between non-violent and violent antisocial behavior, as well as between the other sub groups included in the variable“Any antisocial behavior”, i.e. the SDQ conduct scale self- and parent-report, and CD diagnose. All of these behaviors are now displayed in a separate descriptive analysis.
main interest in this analysis was ADHD, with or without comorbidity with other NDPs at ages 9/12. The association between ADHD and each of the outcomes was modeled with logistic regression, controlling for the following NDPs: co-existing autism spectrum disorder (ASD), learning disability (LD), tics disorder (TD), and developmental coordination disorder (DCD). The following non-NDPs were also controlled for: oppositional defiant disorder (ODD), con-duct disorder (CD), obsessive compulsive disorder (OCD), and eating disorder (ED). In addi-tion, we controlled for parental education level as described above. Since several correlated twin-pairs could be included in the analysis, a robust sandwich estimator was used to adjust for the correlated data when calculating the confidence intervals. The estimated associations are reported as odds ratios with 95% confidence intervals. All p-values less than 0.05 were consid-ered statistically significant. The software package Stata IC12 was used.
Ethical Considerations
For the CATSS study there was a written consent from the parent/legal guardian, and for the DOGSS study there was a written consent from both teenager and parent/legal guardian after written and oral information about the study. Analyses were performed on anonymized data files. The study protocol accorded with the Helsinki declaration and was approved by the ethi-cal review board of Karolinska Institutet, Solna, Sweden (registration numbers CATSS Dnr: 02–289 and 2010/507-31/1 DOGSS Dnr: 03–672 and 2010/1356/31/1). Participants who were considered to be in need of child psychiatric care or social welfare, were taken care of in an ade-quate way.
Results
The frequency rates of psychosocial outcomes are presented inTable 2. The most frequently reported negative outcome was‘Any antisocial behavior’(51.8%), followed by‘Any alcohol misuse‘(28.9%),‘Any peer problem’(23.6%),‘Any school problem’(23.6%), and‘Any drug misuse’(14.9%).‘Impaired daily functioning’was present in 15.3% of the participants (CGAS rate of60; assessed by psychologist and child psychiatrist). Approximately 20% did not report any of the problems in focus.
An analysis of sub categories of‘Any antisocial behavior’was done to determine the severity of antisocial behavior in the different groups (Table 4). In the ADHD group, 41.1% reported non-violent criminality, 31.6% reported violent acts, and 26.3% of their parents reported con-duct problems in SDQ. Also, the rate of CD diagnosis was highest in the ADHD group: 7.4%. The ASD, LD, and DCD groups were lower in all sub categories, whereas the TD group reported both higher non-violent criminality (45.7%) and violent acts (40.0%). Of the Non-NDP groups, the ODD group surpassed the ADHD group in all sub categories except CD diag-nosis (6.4%). Screen-negative siblings reported higher frequencies in both non-violent crimi-nality (36.9%) and violent acts (34.4%) than did controls (15.2% and 23.9%). In general, non-violent criminality was more common than non-violent acts.
Table 5shows an in-depth analysis through logistic regression of the NDP subsample with signs of ADHD at ages 9 or 12 years in relation to the other groups. Having been screen-posi-tive for ADHD at 9/12 doubled the odds for school and antisocial problems at age 15 (‘Any
Table 2. Distribution of age 15 psychosocial outcomes in the whole cohort (n = 450).
n (%) of individuals n (%) MissingA
Peer problems
Peer problems (SDQ) (SR) 46 (10.2) 7 (1.6)
Peer problems (SDQ) (PR) 67 (14.9) 7 (1.6)
Been bullied 12 (2.7) 32 (7.1)
Bullied others 12 (2.7) 26 (5.8)
Any Peer problem 106 (23.6) 0
School problems
Truancy 78 (17.3) 15 (3.3)
Repeated a school-year 27 (6.0) 169 (37.6)
Failure (grades) 12 (2.7) 143 (31.8)
Any School problem 106 (23.6) 5 (1.1)
Internalizing problems
Emotional problems (SDQ) (SR) 65 (14.4) 7 (1.6)
Emotional problems (SDQ) (PR) 43 (9.6) 7 (1.6)
Any internalizing problem 88 (19.6) 0
Antisocial behavior
Non-violent Criminality 151 (33.6) 9 (2.0)
Violent act 133 (29.6) 9 (2.0)
Conduct problems (SDQ) (SR) 21 (4.7) 12 (2.7)
Conduct problems (SDQ) (PR) 44 (9.8) 58 (12.9)
Conduct Disorder diagnosis 10 (2.2) 0
Any Antisocial behavior 233 (51.8) 0
Alcohol misuse
Intoxication 112 (24.9) 26 (5.8)
Used alcohol latest month 80 (17.78) 0
Any Alcohol misuse 130 (28.9) 0
Drug misuse
Any Drug misuse 67 (14.9) 7 (1.6)
CGAS60 69 (15.3) 4 (0.9)
No problem(of above) 89 (19.8) 0
Note: SR = self report; PR = parent report
AMissing = Adolescents or parents who didn
’t give a complete form of self reported information at age 15
school problem’OR 2.28, 95% CI 1.30–4.01;‘Any antisocial behavior’OR 2.67, 95% CI 1.58– 4.52), and increased the odds of risky alcohol use (OR 1.97, 95% CI 1.10–3.53). Adjusting for ASD, LD, TD, DCD, and also for ODD, CD, OCD and ED, did not change the odds materially. However, when adjusting for parental education level, the significant association disappeared both for school problems and risky alcohol use, but remained for antisocial behavior (OR 2.16, 95% CI 1.14–4.09) at a slightly lower level. The significant association between ADHD and functional level remained (and even increased) in the adjusted model.
Discussion
The aim of the present study was to examine to what extent signs of NDPs at ages 9 or 12 years of age is associated with negative psychosocial outcome in a range of areas at age 15, while at the same time controlling for comorbidity. Our findings indicate that negative psychosocial outcomes were common in adolescence for all childhood proxy diagnoses; both for NDPs and other conditions. A further analysis of outcomes in relation to childhood ADHD symptoms
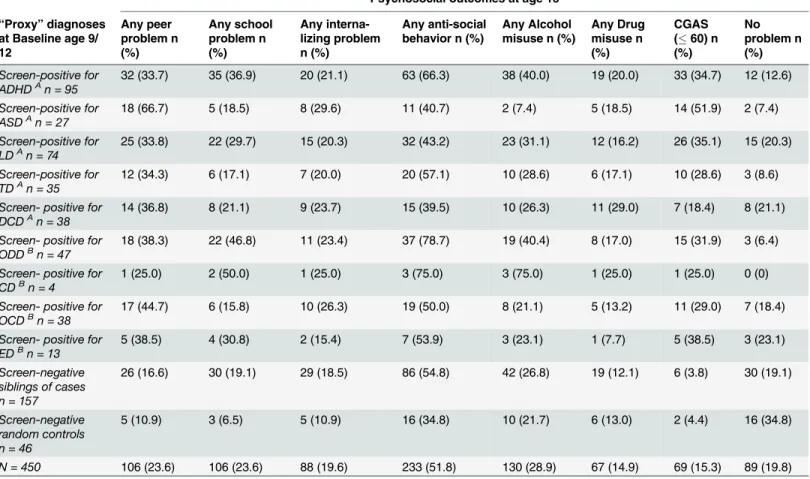
Table 3. Screen-positive cases according to A-TAC, screen-negative siblings, and random, screen-negative controls compared to the psychoso-cial outcomes at age 15.Baseline: CATSS-9/12 study (n = screen-positive in A-TAC for“proxy”diagnosis).Follow-up: Psychosocial outcomes in the clini-cal follow-up study, CATSS-15/DOGSS.
Psychosocial outcomes at age 15
“Proxy”diagnoses at Baseline age 9/ 12
Any peer problem n (%)
Any school problem n (%)
Any interna-lizing problem n (%)
Any anti-social behavior n (%)
Any Alcohol misuse n (%)
Any Drug misuse n (%)
CGAS (60) n (%)
No problem n (%)
Screen-positive for ADHDAn = 95
32 (33.7) 35 (36.9) 20 (21.1) 63 (66.3) 38 (40.0) 19 (20.0) 33 (34.7) 12 (12.6)
Screen-positive for ASDAn = 27
18 (66.7) 5 (18.5) 8 (29.6) 11 (40.7) 2 (7.4) 5 (18.5) 14 (51.9) 2 (7.4)
Screen-positive for LDAn = 74
25 (33.8) 22 (29.7) 15 (20.3) 32 (43.2) 23 (31.1) 12 (16.2) 26 (35.1) 15 (20.3)
Screen-positive for TDAn = 35
12 (34.3) 6 (17.1) 7 (20.0) 20 (57.1) 10 (28.6) 6 (17.1) 10 (28.6) 3 (8.6)
Screen- positive for DCDAn = 38
14 (36.8) 8 (21.1) 9 (23.7) 15 (39.5) 10 (26.3) 11 (29.0) 7 (18.4) 8 (21.1)
Screen- positive for ODDBn = 47
18 (38.3) 22 (46.8) 11 (23.4) 37 (78.7) 19 (40.4) 8 (17.0) 15 (31.9) 3 (6.4)
Screen- positive for CDBn = 4
1 (25.0) 2 (50.0) 1 (25.0) 3 (75.0) 3 (75.0) 1 (25.0) 1 (25.0) 0 (0)
Screen- positive for OCDBn = 38
17 (44.7) 6 (15.8) 10 (26.3) 19 (50.0) 8 (21.1) 5 (13.2) 11 (29.0) 7 (18.4)
Screen- positive for EDBn = 13
5 (38.5) 4 (30.8) 2 (15.4) 7 (53.9) 3 (23.1) 1 (7.7) 5 (38.5) 3 (23.1)
Screen-negative siblings of cases n = 157
26 (16.6) 30 (19.1) 29 (18.5) 86 (54.8) 42 (26.8) 19 (12.1) 6 (3.8) 30 (19.1)
Screen-negative random controls n = 46
5 (10.9) 3 (6.5) 5 (10.9) 16 (34.8) 10 (21.7) 6 (13.0) 2 (4.4) 16 (34.8)
N = 450 106 (23.6) 106 (23.6) 88 (19.6) 233 (51.8) 130 (28.9) 67 (14.9) 69 (15.3) 89 (19.8)
A.
NDPdefined as ASD and/or ADHD and/or LD and/or TD and/or DCD, with a possible overlap of other mental health problems. NDP screen-positive: n = 198.
B.
Other mental health problemsdefined as OCD and/or ODD and/or CD and/or ED, with no NDP overlap. Screen-positive for other mental health problems: n = 49.
showed an increased risk of negative psychosocial outcomes during adolescence, regardless of other co-existing symptoms. However, it was common that ADHD co-existed with other symptoms, and that risk levels for different outcomes changed when comorbidity was taken into account. When considering comorbidity as well as parental education level, early ADHD-symptoms still stood out as a contributing factor to both antisocial development and lowered psychosocial functioning.
Outcome in relation to same age peers
On a group level, risk behaviors were more common in our study sample than among general Swedish 15-year olds. According to the School survey, an annual survey on criminality and drug use among Swedish 15-year olds based on self-report data, it is quite common that youth engage in illegal behavior, but the reported levels of such problems were higher in the studied
Table 4. Frequencies of subcategories of the outcome antisocial behavior (seeTable 3, column 4) for screen-positive cases, screen-negative sib-lings, screen-negative controls, and the whole cohort at age 15.
Antisocial behavior at age 15
“Proxy”diagnoses at Baseline age 9/12
SDQ Conduct*
(SR) n (%)
SDQ Conduct*
(PR) n (%)
Non-violent criminality (SR) n (%)
Violent act (SR) n (%)
CD diagnosis (K-SADS) n (%)
Screen-positive for ADHDA n = 95
6 (6.3) 25 (26.3) 39 (41.1) 30 (31.6) 7 (7.4)
Screen-positive for ASDA n = 27
1 (3.7) 5 (18.5) 6 (22.2) 3 (11.1) 0
Screen-positive for LDA n = 74
4 (5.4) 5 (6.8) 22 (29.7) 13 (17.6) 3 (4.1)
Screen-positive for TDA n = 35
1 (2.9) 3 (8.6) 16 (45.7) 14 (40.0) 0
Screen- positive for DCDA n = 38
0 5 (13.2) 9 (23.7) 8 (21.1) 1 (2.6)
Screen- positive for ODDB n = 47
5 (10.6) 16 (34.0) 23 (48.9) 18 (38.3) 3 (6.4)
Screen- positive for CDB n = 4
0 3 (75.0) 1 (25.0) 2 (50.0) 0
Screen- positive for OCDB n = 38
3 (7.9) 7 (18.4) 9 (23.7) 9 (23.7) 1 (2.6)
Screen- positive for EDB n = 13
1 (7.7) 1 (7.7) 5 (38.5) 5 (38.5) 0
Screen-negative siblings of cases n = 157
7 (4.5) 8 (5.1) 58 (36.9) 54 (34.4) 0
Screen-negative random controls n = 46
2 (4.4) 0 7 (15.2) 11 (23.9) 0
N = 450 21 (4.7) 44 (9.8) 151 (33.6) 133 (29.6) 10 (2.2)
Baseline: CATSS-9/12 study (N = screen-positive in A-TAC for“proxy”diagnosis);Follow-up: Five subcategories of Antisocial behavior in the clinical follow-up study, CATSS-15/DOGSS.
A.
NDPdefined as ASD and/or ADHD and/or LD and/or TD and/or DCD, with a possible overlap of other mental health problems. NDP screen-positive: n = 198.
B.
Other mental health problemsdefined as OCD and/or ODD and/or CD and/or ED, with no NDP overlap. Screen-positive for other mental health problems: n = 49.
*Questions included in theSDQ Conduct Problems Scale: 1. Often has temper tantrums or hot tempers; 2. Generally obedient, usually does what told (reversed question); 3. Oftenfights with other children or bullies them; 4. Often lies or cheats; 5. Steals from home, school or elsewhere
SR= self report;PR= parent report
cohort. For example, over one third (33.6%) of our respondents had committed at least one criminal act, compared to 20% in the national sample [77], and one third (29.5%) had commit-ted a violent act compared to the 10% national level. It should also be nocommit-ted that even though self-rate levels were higher in our study cohort than in population-based samples of the same age, parents generally reported even higher problem levels than did the participating
adolescents.
Overall, there was a trend towards a higher problem load among all those who had been screen-positive for a diagnosis at ages 9 or 12 years (NDP or other) compared with those who had been screen-negative co-twins or controls, in that those who had been screen-positive reported more psychosocial problems (including antisocial behaviors) and were more often judged by assessing psychologist and child psychiatrist to have impaired functioning. Thus, not only early ADHD signs but also symptoms of other NDPs and/or other mental health and behavior problems were indicative of a more problematic adolescence. Not surprisingly, those who had been screen positive for ASD reported higher levels of peer problems, and over half
Table 5. Logistic Regression Analyses of the Associations of ADHD at Age 9/12 and Seven Psychosocial Outcomes at Age 15.
Baseline A-TAC in CATSS 9/12“Proxy”diagnoses
Any peer problem OR (CI) Any school problem OR (CI) Any internalizing problem OR (CI)
Any antisocial behavior OR (CI) Any alcohol misuse OR (CI) Any drug misuse OR (CI)
CGAS (60) OR (CI)
ADHD (n = 95) 1.59
(0.90,2.80)
2.28**
(1.30,4.01)
1.09 (0.59,1.99) 2.67***
(1.58,4.52) 1.97* (1.10,3.53) 1.48 (0.79,2.76) 3.13*** (1.67,5.87) ADHD adjusted for ASD 1.33
(0.73,2.44)
2.39**
(1.34,4.26)
1.02 (0.55,1.90) 2.91***
(1.68,5.03) 2.32** (1.28,4.21) 1.47 (0.78,2.77) 2.81** (1.48,5.35) ADHD adjusted for LD 1.63
(0.92,2.89)
2.32**
(1.32,4.07)
1.09 (0.59,1.99) 2.64***
(1.56,4.49) 1.98* (1.11,3.55) 1.48 (0.79,2.78) 3.66*** (1.91,7.02) ADHD adjusted for TD 1.59
(0.90,2.82)
2.29**
(1.30,4.03)
1.09 (0.59,1.99) 2.68***
(1.58,4.57) 1.97* (1.10,3.53) 1.48 (0.79,2.77) 3.15*** (1.68,5.91) ADHD adjusted for DCD 1.63
(0.92,2.90)
2.26**
(1.29,3.97)
1.10 (0.60,2.01) 2.64***
(1.56,4.49) 1.96* (1.10,3.51) 1.57 (0.83,2.98) 3.13*** (1.67,5.85) ADHD adjusted for ASD,
LD, TD and DCD
1.41 (0.76,2.62)
2.39**
(1.34,4.27)
1.03 (0.55,1.92) 2.87***
(1.64,5.02) 2.35** (1.29,4.29) 1.59 (0.82,3.09) 3.31** (1.68,6.51) ADHD adjusted for ODD 1.51
(0.86,2.67)
2.13*
(1.20,3.80)
1.06 (0.57,1.98) 2.51**
(1.47,4.29) 1.90* (1.06,3.40) 1.48 (0.79,2.78) 3.01** (1.59,5.67) ADHD adjusted for CD 1.59
(0.90,2.81)
2.26**
(1.28,3.99)
1.08 (0.59,1.98) 2.65***
(1.57,4.50) 1.95* (1.09,3.49) 1.47 (0.79,2.75) 3.13*** (1.67,5.88) ADHD adjusted for OCD 1.67
(0.94,2.96)
2.25**
(1.28,3.94)
1.11 (0.60,2.03) 2.68***
(1.58,4.54) 1.95* (1.09,3.48) 1.46 (0.79,2.73) 3.22*** (1.71,6.09) ADHD adjusted for ED 1.61
(0.91,2.84)
2.30**
(1.31,4.04)
1.08 (0.59,1.98) 2.69***
(1.58,4.57) 1.96* (1.10,3.51) 1.46 (0.78,2.74) 3.34*** (1.75,6.35) ADHD adjusted for ASD,
LD, TD, DCD, ODD, CD, OCD, and ED
1.48 (0.78,2.82)
2.26**
(1.26,4.04)
1.03 (0.54,1.95) 2.87***
(1.61,5.12) 2.22* (1.20,4.10) 1.55 (0.79,3.01) 3.64** (1.76,7.55)
ADHD adjusted for ASD, LD, TD, DCD, ODD, CD, OCD, ED, and Parental educationA
1.75 (0.85,3.63)
1.50 (0.75,3.01)
1.16 (0.55,2.42) 2.16*
(1.14,4.09) 1.76 (0.85,3.64) 1.44 (0.64,3.25) 3.25* (1.33,7.94)
N = 293 (missing = 7), ADHD-cases compared to all other cases and controls (screen negative cotwins are not included). Exponentiated coefficients; 95% confidence intervals in brackets
*p<0.05
**p<0.01
***p<0.001
AParental education = Educational level of parents (mother and father)
were judged to have functional impairment. Given that the A-TAC, which was used for screen-ing, has shown good to excellent psychometric properties for predicting later clinical diagnoses [52], this finding is of significant clinical relevance and stresses the importance of comprehen-sive assessments including symptoms other than those related to ADHD.
Outcomes of ADHD in relation to other NDPs
Those who had been screen positive for ADHD reported the highest levels of externalizing and school problems at age 15 compared to the other groups, except for those who had been screen-positive for ODD/CD, which is to be expected. Many studies have reported similar findings of negative long-term consequences of ADHD [20,78–85], but fewer studies have explored outcomes in relation to the entire spectrum of neurodevelopmental problems. When adjusting for all other diagnoses, including diagnoses other than NDPs, the doubled or tripled odds for ADHD in relation to several of the psychosocial outcomes remained. Previous studies have focused on the connection between ADHD and externalizing disorders such as opposi-tional defiant or conduct disorder [86–88] and it is well known that ADHD frequently co-occurs with externalizing disorders, and that there is a considerable overlap between ADHD and oppositional defiant or conduct disorder. However, the interplay between these conditions is complicated, and the view that ADHD is a stable condition that precedes the onset of exter-nalizing behaviors has been challenged [88]. However, since our study sample was young, only a few were screen positive for diagnoses such as conduct disorder, which could have underesti-mated the impact of early externalizing behaviors.
Socioeconomic factors and ADHD
Previous studies have also focused on the impact of socioeconomic factors on both the preva-lence of ADHD and of its outcomes [80,89,90]. When we added a contextual factor (parental education) to our analysis, the only negative outcomes of ADHD that remained significant were antisocial behavior and impaired social functioning. Thus, the finding that parental edu-cation impacts outcome of ADHD is in line with other studies indicating that ADHD and socioeconomic factors are interconnected. In a population based study of over 800 000 Swedish individuals, Larsson et al. found a dose-dependent association with lower family income and the risk of having a child diagnosed with ADHD [91]. Currie and Stabile [80] applied the con-cept of human capital accumulation to study the effects of ADHD, and concluded that even though a given level of ADHD symptoms had similar effects on the academic test scores of rich and poor children, the richer children were less likely to repeat a grade. These findings were corroborated in a study by Fletcher and Wolfe [92]. In a follow-up of ADHD youth, Fried con-cluded that even though ADHD was the strongest predictor for academic underachievement, social class and IQ were also significant predictors of high school dropout or repeated grade [89].
Comorbidity between NDPs
LD. Therefore, assessment in early childhood focusing on a wider neurodevelopmental spec-trum seems highly relevant. On the same note, a wider risk assessment perspective during ado-lescence is important, given the higher levels of various negative outcomes reported among the 15 year olds in this study.
Conclusions
Signs of NDPs as well as other psychiatric diagnoses at ages 9 or 12 years are associated with a more problematic adolescence. However, despite the presence of comorbidity, early ADHD symptoms stand out as the most important risk factor for later antisocial development and impaired daily functioning.
Strengths
The strengths of the present study lie in the whole-population-based cohort of screen-positive children, their screen-negative siblings, and controls, including the wide assessments of psy-chosocial outcomes. We have assessed a broad spectrum of NDPs simultaneously at baseline, and assessed a wide range of psychosocial outcomes at follow-up. These psychosocial outcomes were chosen to reflect key aspects of adolescent development and considered to be crucial for the further development into adulthood.
Limitations
The outcome measures were based mainly on self and parent reports. The time period between the A-TAC parental assessment and the follow-up measuring the psychosocial outcomes was between three and six years. This time period in itself and the complex psychosocial problems associated with puberty may interfere with interpreting the results. There were 38 twin pairs where both twins were NDP screen-positive (23 pairs of boys and 15 pairs of girls). These twin pairs share environmental factors, which could affect our results. The effects of this have been taken care of through a robust sandwich estimator which was used to adjust for the correlated data when calculating the confidence intervals. As mentioned earlier, an analysis of the attri-tion group showed that there were some differences between the groups regarding sex distribu-tion, ADHD symptoms and parental education levels. The attrition group had fewer girls, more boys, more ADHD screen-positive cases and parental education levels were more con-centrated to secondary school level (Table 1). These differences suggest that the attrition group might have had a heavier problem load than the study cohort, indicating that the findings regarding psychosocial problems associated with ADHD symptoms in the study group may still be valid.
Clinical implications
Future research
Further studies are needed to explore how gender may modify the associations between ADHD and the psychosocial outcomes included in the present study. It would also be of inter-est to further explore if ADHD symptoms on a subthreshold level contribute to impairments and psychosocial problems in daily life.
Author Contributions
Conceived and designed the experiments: PL HA CHG. Performed the experiments: ENS TL SL. Analyzed the data: ENS. Contributed reagents/materials/analysis tools: TL SL ENS. Wrote the paper: ENS YM PL TL SL HA CHG.
References
1. Gillberg C., The ESSENCE in child psychiatry: Early Symptomatic Syndromes Eliciting Neurodevelop-mental Clinical Examinations. Res Dev Disabil, 2010. 31(6): p. 1543–51. doi:10.1016/j.ridd.2010.06. 002PMID:20634041
2. Faraone S.V., et al., The worldwide prevalence of ADHD: is it an American condition? World Psychiatry, 2003. 2(2): p. 104–13.
3. Kessler R.C., et al., The prevalence and correlates of adult ADHD in the United States: results from the National Comorbidity Survey Replication. Am J Psychiatry, 2006. 163(4): p. 716–23. PMID:16585449 4. Polanczyk G., et al., The worldwide prevalence of ADHD: a systematic review and metaregression
analysis. Am J Psychiatry, 2007. 164(6): p. 942–8. PMID:17541055
5. Baird G., et al., Prevalence of disorders of the autism spectrum in a population cohort of children in South Thames: the Special Needs and Autism Project (SNAP). Lancet, 2006. 368(9531): p. 210–5. PMID:16844490
6. Idring S., et al., Autism spectrum disorders in the Stockholm Youth Cohort: design, prevalence and validity. PLoS One, 2012. 7(7): p. e41280. doi:10.1371/journal.pone.0041280PMID:22911770 7. Kim Y.S., et al., Prevalence of autism spectrum disorders in a total population sample. Am J Psychiatry,
2011. 168(9): p. 904–12. doi:10.1176/appi.ajp.2011.10101532PMID:21558103
8. Gillberg C. and Soderstrom H., Learning disability. Lancet, 2003. 362(9386): p. 811–21. PMID: 13678878
9. Kotte A., et al., Autistic traits in children with and without ADHD. Pediatrics, 2013. 132(3): p. e612–22. doi:10.1542/peds.2012-3947PMID:23979086
10. Landerl K. and Moll K., Comorbidity of learning disorders: prevalence and familial transmission. J Child Psychol Psychiatry, 2010. 51(3): p. 287–94. doi:10.1111/j.1469-7610.2009.02164.xPMID:19788550 11. Bitsko R.H., et al., Health care needs of children with Tourette syndrome. J Child Neurol, 2013. 28(12):
p. 1626–36. doi:10.1177/0883073812465121PMID:23143730
12. Cubo E., Review of prevalence studies of tic disorders: methodological caveats. Tremor Other Hyperki-net Mov (N Y), 2012. 2.
13. Khalifa N. and von Knorring A.L., Prevalence of tic disorders and Tourette syndrome in a Swedish school population. Dev Med Child Neurol, 2003. 45(5): p. 315–9. PMID:12729145
14. Walkup J.T., et al., Tic disorders: some key issues for DSM-V. Depress Anxiety, 2010. 27(6): p. 600–
10. doi:10.1002/da.20711PMID:20533370
15. Kadesjo B. and Gillberg C., Developmental coordination disorder in Swedish 7-year-old children. J Am Acad Child Adolesc Psychiatry, 1999. 38(7): p. 820–8. PMID:10405499
16. Kirby A., Sugden D., and Purcell C., Diagnosing developmental coordination disorders. Arch Dis Child, 2014. 99(3): p. 292–6. doi:10.1136/archdischild-2012-303569PMID:24255567
17. Biederman J., et al., Functional impairments in adults with self-reports of diagnosed ADHD: A controlled study of 1001 adults in the community. J Clin Psychiatry, 2006. 67(4): p. 524–40. PMID:16669717 18. Elkins I.J., McGue M., and Iacono W.G., Prospective effects of attention-deficit/hyperactivity disorder,
conduct disorder, and sex on adolescent substance use and abuse. Arch Gen Psychiatry, 2007. 64 (10): p. 1145–52. PMID:17909126
20. Loe I.M. and Feldman H.M., Academic and educational outcomes of children with ADHD. J Pediatr Psy-chol, 2007. 32(6): p. 643–54. PMID:17569716
21. Molina B.S.G. and Pelham W.E., Childhood predictors of adolescent substance use in a longitudinal study of children with ADHD. Journal of Abnormal Psychology, 2003. 112(3): p. 497–507. PMID: 12943028
22. Zulauf C.A., et al., The complicated relationship between attention deficit/hyperactivity disorder and substance use disorders. Curr Psychiatry Rep, 2014. 16(3): p. 436. doi:10.1007/s11920-013-0436-6 PMID:24526271
23. Erskine H.E., et al., The global burden of conduct disorder and attention-deficit/hyperactivity disorder in 2010. J Child Psychol Psychiatry, 2014. 55(4): p. 328–36. doi:10.1111/jcpp.12186PMID:24447211 24. Gilmour J., et al., Social communication deficits in conduct disorder: a clinical and community survey. J
Child Psychol Psychiatry, 2004. 45(5): p. 967–78. PMID:15225339
25. Kanne S.M., Christ S.E., and Reiersen A.M., Psychiatric symptoms and psychosocial difficulties in young adults with autistic traits. J Autism Dev Disord, 2009. 39(6): p. 827–33. doi: 10.1007/s10803-008-0688-xPMID:19132522
26. Piek J.P., et al., Do motor skills in infancy and early childhood predict anxious and depressive symp-tomatology at school age? Human Movement Science, 2010. 29(5): p. 777–86. doi:10.1016/j.humov. 2010.03.006PMID:20650535
27. Simonoff E., et al., The persistence and stability of psychiatric problems in adolescents with autism spectrum disorders. J Child Psychol Psychiatry, 2013. 54(2): p. 186–94. doi:10.1111/j.1469-7610. 2012.02606.xPMID:22934711
28. St Clair M.C., et al., A longitudinal study of behavioral, emotional and social difficulties in individuals with a history of specific language impairment (SLI). J Commun Disord, 2011. 44(2): p. 186–99. doi: 10.1016/j.jcomdis.2010.09.004PMID:20970811
29. Westendorp M., et al., The relationship between gross motor skills and academic achievement in chil-dren with learning disabilities. Res Dev Disabil, 2011. 32(6): p. 2773–9. doi:10.1016/j.ridd.2011.05. 032PMID:21700421
30. Tseng M.H., et al., Cooccurrence of problems in activity level, attention, psychosocial adjustment, read-ing and writread-ing in children with developmental coordination disorder. International Journal of Rehabilita-tion Research, 2007. 30(4): p. 327–332. PMID:17975453
31. Twyman K.A., et al., Bullying and ostracism experiences in children with special health care needs. Journal of Developmental & Behavioral Pediatrics, 2010. 31(1): p. 1–8.
32. Anckarsater H., et al., The Child and Adolescent Twin Study in Sweden (CATSS). Twin Res Hum Genet, 2011. 14(6): p. 495–508. PMID:22506305
33. Geluk C.A., et al., Autistic symptoms in childhood arrestees: longitudinal association with delinquent behavior. J Child Psychol Psychiatry, 2012. 53(2): p. 160–7. doi:10.1111/j.1469-7610.2011.02456.x PMID:21884523
34. Lundstrom S., et al., Childhood neurodevelopmental disorders and violent criminality: a sibling control study. J Autism Dev Disord, 2014. 44(11): p. 2707–16. doi:10.1007/s10803-013-1873-0PMID: 23807203
35. Einarsson E., et al., Screening for attention-deficit hyperactivity disorder and co-morbid mental disor-ders among prison inmates. Nord J Psychiatry, 2009. 63(5): p. 361–7. doi:10.1080/
08039480902759184PMID:19247871
36. Siponmaa L., et al., Juvenile and young adult mentally disordered offenders:the role of child neuropsy-chiatric disorders. J Am Acad Psychiatry Law, 2001. 29(4): p. 420–6. PMID:11785613
37. Hurtig T., et al., ADHD and comorbid disorders in relation to family environment and symptom severity. Eur Child Adolesc Psychiatry, 2007. 16(6): p. 362–9. PMID:17401612
38. Reiersen A.M., Constantino J.N., and Todd R.D., Co-occurrence of motor problems and autistic symp-toms in attention-deficit/hyperactivity disorder. J Am Acad Child Adolesc Psychiatry, 2008. 47(6): p. 662–72. doi:10.1097/CHI.0b013e31816bff88PMID:18434922
39. Simonoff E., et al., Psychiatric disorders in children with autism spectrum disorders: prevalence, comor-bidity, and associated factors in a population-derived sample. J Am Acad Child Adolesc Psychiatry, 2008. 47(8): p. 921–9. doi:10.1097/CHI.0b013e318179964fPMID:18645422
40. Antshel K.M., Zhang-James Y., and Faraone S.V., The comorbidity of ADHD and autism spectrum dis-order. Expert Rev Neurother, 2013. 13(10): p. 1117–28. doi:10.1586/14737175.2013.840417PMID: 24117274
42. Reiersen A.M., et al., Autistic traits in a population-based ADHD twin sample. J Child Psychol Psychia-try, 2007. 48(5): p. 464–72. PMID:17501727
43. Ronald A., et al., Exploring the relationship between autistic-like traits and ADHD behaviors in early childhood: findings from a community twin study of 2-year-olds. J Abnorm Child Psychol, 2010. 38(2): p. 185–96. doi:10.1007/s10802-009-9366-5PMID:19908138
44. Canitano R. and Vivanti G., Tics and Tourette syndrome in autism spectrum disorders. Autism, 2007. 11(1): p. 19–28. PMID:17175571
45. Ringman J.M. and Jankovic J., Occurrence of tics in Asperger's syndrome and autistic disorder. J Child Neurol, 2000. 15(6): p. 394–400. PMID:10868783
46. Rizzo R., et al., Tourette syndrome and comorbid conditions: a spectrum of different severities and complexities. J Child Neurol, 2014. 29(10): p. 1383–9. doi:10.1177/0883073814534317PMID: 24832397
47. Sturm H., Fernell E., and Gillberg C., Autism spectrum disorders in children with normal intellectual lev-els: associated impairments and subgroups. Dev Med Child Neurol, 2004. 46(7): p. 444–7. PMID: 15230456
48. Missiuna C., et al., Psychological distress in children with developmental coordination disorder and attention-deficit hyperactivity disorder. Res Dev Disabil, 2014. 35(5): p. 1198–207. doi:10.1016/j.ridd. 2014.01.007PMID:24559609
49. Moruzzi S., et al., The nature of covariation between autistic traits and clumsiness: a twin study in a general population sample. J Autism Dev Disord, 2011. 41(12): p. 1665–74. doi: 10.1007/s10803-011-1199-8PMID:21347613
50. Polatajko H.J. and Cantin N., Developmental coordination disorder (dyspraxia): an overview of the state of the art. Semin Pediatr Neurol, 2005. 12(4): p. 250–8. PMID:16780296
51. Reiersen A.M., Links between autism spectrum disorder and ADHD symptom trajectories: important findings and unanswered questions. J Am Acad Child Adolesc Psychiatry, 2011. 50(9): p. 857–9. doi: 10.1016/j.jaac.2011.06.012PMID:21871367
52. Larson T., et al., Predictive properties of the A-TAC inventory when screening for childhood-onset neu-rodevelopmental problems in a population-based sample. BMC Psychiatry, 2013. 13: p. 233. doi:10. 1186/1471-244X-13-233PMID:24066834
53. Helles A., et al., Asperger syndrome in males over two decades: stability and predictors of diagnosis. J Child Psychol Psychiatry, 2014.
54. De Alwis D., et al., ADHD symptoms, autistic traits, and substance use and misuse in adult Australian twins. J Stud Alcohol Drugs, 2014. 75(2): p. 211–21. PMID:24650814
55. Cubo E., et al., Validation of screening instruments for neuroepidemiological surveys of tic disorders. Mov Disord, 2011. 26(3): p. 520–6. doi:10.1002/mds.23460PMID:21259342
56. Hansson S.L., et al., Psychiatric telephone interview with parents for screening of childhood autism—
tics, attention-deficit hyperactivity disorder and other comorbidities (A-TAC): preliminary reliability and validity. Br J Psychiatry, 2005. 187: p. 262–7. PMID:16135864
57. Larson T., et al., The autism—tics, AD/HD and other comorbidities inventory (A-TAC): further validation of a telephone interview for epidemiological research. BMC Psychiatry, 2010. 10: p. 1. doi:10.1186/ 1471-244X-10-1PMID:20055988
58. Hallerod S.L., et al., The Autism—Tics, AD/HD and other Comorbidities (A-TAC) telephone interview: convergence with the Child Behavior Checklist (CBCL). Nord J Psychiatry, 2010. 64(3): p. 218–24. doi: 10.3109/08039480903514443PMID:20192892
59. Shaffer D., et al., A children's global assessment scale (CGAS). Arch Gen Psychiatry, 1983. 40(11): p. 1228–31. PMID:6639293
60. Goodman R., Psychometric properties of the strengths and difficulties questionnaire. J Am Acad Child Adolesc Psychiatry, 2001. 40(11): p. 1337–45. PMID:11699809
61. Solberg M.E. and Olweus D., Prevalence estimation of school bullying with the Olweus Bully Victim Questionnaire. Aggressive Behavior, 2003. 29(3): p. 239–268.
62. Elliot D.S., Huizinga D., and Ageton S.S.E., Explaining delinquency and drug use. 1985: Beverly Hills: Sage.
63. Junger-Tas J., Terlouw G.-J., and K.M. W., Delinquent behavior among young people in the western world: first results of the international self-report delinquency study. Studies on crime and justice, ed. Justice R.-M.o.. 1994: Kugler Publications—Amsterdam / New York.
65. Ring,Stöld,våld och droger bland pojkar och flickor iårskurs nio—Resultat från tre
självdeklarationsun-dersökningar, B.r.C. prevention), Editor. 2000.
66. Ayton A., Keen C., and Lask B., Pros and cons of using the Mental Health Act for severe eating disor-ders in adolescents. Eur Eat Disord Rev, 2009. 17(1): p. 14–23. doi:10.1002/erv.887PMID:18666096 67. Bella T., et al., Psychosocial functioning in offspring of parents with bipolar disorder. J Affect Disord,
2011. 133(1–2): p. 204–11. doi:10.1016/j.jad.2011.03.022PMID:21463899
68. Bird H.R., et al., Impairment in the epidemiological measurement of childhood psychopathology in the community. J Am Acad Child Adolesc Psychiatry, 1990. 29(5): p. 796–803. PMID:2228936
69. Canino G., et al., The DSM-IV rates of child and adolescent disorders in Puerto Rico: prevalence, corre-lates, service use, and the effects of impairment. Arch Gen Psychiatry, 2004. 61(1): p. 85–93. PMID: 14706947
70. Leaf P.J., et al., Mental health service use in the community and schools: results from the four-commu-nity MECA Study. Methods for the Epidemiology of Child and Adolescent Mental Disorders Study. J Am Acad Child Adolesc Psychiatry, 1996. 35(7): p. 889–97. PMID:8768348
71. Milne J.M., et al., Frequency of phobic disorder in a community sample of young adolescents. J Am Acad Child Adolesc Psychiatry, 1995. 34(9): p. 1202–11. PMID:7559315
72. Petersen D.J., et al., The population prevalence of child psychiatric disorders in Danish 8- to 9-year-old children. Eur Child Adolesc Psychiatry, 2006. 15(2): p. 71–8. PMID:16477477
73. Steinhausen H.C. and Metzke C.W., Global measures of impairment in children and adolescents: results from a Swiss community survey. Aust N Z J Psychiatry, 2001. 35(3): p. 282–6. PMID: 11437800
74. Lundh A., et al., Children's Global Assessment Scale (CGAS) in a naturalistic clinical setting: Inter-rater reliability and comparison with expert ratings. Psychiatry Res, 2010. 177(1–2): p. 206–10. doi:10. 1016/j.psychres.2010.02.006PMID:20334931
75. Lundh A., et al., A comparison of seminar and computer based training on the accuracy and reliability of raters using the Children's Global Assessment Scale (CGAS). Adm Policy Ment Health, 2012. 39(6): p. 458–65. doi:10.1007/s10488-011-0369-5PMID:21785889
76. Lundh A., On the Children’s Global Assessment Scale (CGAS). 2012: Karolinska Institutet, Stockholm.
77. Brå,Kriminalstatistik 2011. BråRapport 2012. Vol. Rapport 2012:11. 2012, Stockholm, Sweden:
Brotts-förebyggande rådet.
78. Barbaresi W.J., et al., Long-term school outcomes for children with attention-deficit/hyperactivity disor-der: a population-based perspective. J Dev Behav Pediatr, 2007. 28(4): p. 265–73. PMID:17700078 79. Biederman J., et al., Impact of executive function deficits and attention-deficit/hyperactivity disorder
(ADHD) on academic outcomes in children. J Consult Clin Psychol, 2004. 72(5): p. 757–66. PMID: 15482034
80. Currie J. and Stabile M., Child mental health and human capital accumulation: the case of ADHD. J Health Econ, 2006. 25(6): p. 1094–118. PMID:16730082
81. Frazier T.W., et al., ADHD and achievement: meta-analysis of the child, adolescent, and adult litera-tures and a concomitant study with college students. J Learn Disabil, 2007. 40(1): p. 49–65. PMID: 17274547
82. Fredriksen M., et al., Childhood and persistent ADHD symptoms associated with educational failure and long-term occupational disability in adult ADHD. Atten Defic Hyperact Disord, 2014. 6(2): p. 87–
99. doi:10.1007/s12402-014-0126-1PMID:24497125
83. Sayal K., et al., Impact of early school-based screening and intervention programs for ADHD on chil-dren's outcomes and access to services: follow-up of a school-based trial at age 10 years. Arch Pediatr Adolesc Med, 2010. 164(5): p. 462–9. doi:10.1001/archpediatrics.2010.40PMID:20439798
84. Pingault J.B., et al., Childhood hyperactivity, physical aggression and criminality: a 19-year prospective population-based study. PLoS One, 2013. 8(5): p. e62594. doi:10.1371/journal.pone.0062594PMID: 23658752
85. Strine T.W., et al., Emotional and behavioral difficulties and impairments in everyday functioning among children with a history of attention-deficit/hyperactivity disorder. Prev Chronic Dis, 2006. 3(2): p. A52. PMID:16539793
87. Galera C., et al., Childhood and adolescent hyperactivity-inattention symptoms and academic achieve-ment 8 years later: the GAZEL Youth study. Psychol Med, 2009. 39(11): p. 1895–906. doi:10.1017/ S0033291709005510PMID:19335935
88. Kuja-Halkola R., et al., Codevelopment of ADHD and externalizing behavior from childhood to adult-hood. J Child Psychol Psychiatry, 2014.
89. Fried R., et al., Is ADHD a Risk Factor for High School Dropout? A Controlled Study. J Atten Disord, 2013.
90. Galera C., et al., Attention problems in childhood and adult substance use. J Pediatr, 2013. 163(6): p. 1677–1683 e1. doi:10.1016/j.jpeds.2013.07.008PMID:23972646
91. Larsson H., et al., Family income in early childhood and subsequent attention deficit/hyperactivity disor-der: a quasi-experimental study. J Child Psychol Psychiatry, 2014. 55(5): p. 428–35. doi:10.1111/jcpp. 12140PMID:24111650
92. Fletcher J. and Wolfe B., Child mental health and human capital accumulation: the case of ADHD revis-ited. J Health Econ, 2008. 27(3): p. 794–800. doi:10.1016/j.jhealeco.2007.10.010PMID:18221807 93. Anckarsater H., Beyond categorical diagnostics in psychiatry: Scientific and medicolegal implications.