Phylogeography and Genetic Ancestry
of Tigers
(Panthera tigris)
Shu-Jin Luo
1,2[, Jae-Heup Kim
1[¤1, Warren E. Johnson
1, Joelle van der Walt
1¤2, Janice Martenson
1,
Naoya Yuhki
1, Dale G. Miquelle
3, Olga Uphyrkina
1¤3, John M. Goodrich
4, Howard B. Quigley
3,4,
Ronald Tilson
5, Gerald Brady
6, Paolo Martelli
7, Vellayan Subramaniam
8, Charles McDougal
9, Sun Hean
10,
Shi-Qiang Huang
11, Wenshi Pan
12, Ullas K. Karanth
13, Melvin Sunquist
14, James L. D. Smith
2,
Stephen J. O’Brien
1[*1Laboratory of Genomic Diversity, National Cancer Institute, Frederick, Maryland, United States of America,2Conservation Biology Graduate Program, University of Minnesota, St. Paul, Minnesota, United States of America,3Wildlife Conservation Society, Russian Far East Program, Bronx, New York, United States of America,4Wildlife Conservation Society, Hornocker Wildlife Institute, Bozeman, Montana, United States of America,5Minnesota Zoo, Apple Valley, Minnesota, United States of America, 6Potter Park Zoo, Lansing, Michigan, United States of America,7Singapore Zoological Gardens, Singapore,8Zoo Negara, Hulu Kelang, Selangor, Malaysia,9Tiger Tops, Kathmandu, Nepal,10International Cooperation Office, Ministry of Agriculture Forestry and Fisheries, Phnom Penh, Cambodia,11Beijing Zoo, Beijing, China,12College of Life Sciences, Peking University, Beijing, China,13Wildlife Conservation Society—India Program, Bangalore, Karnataka, India,14Department of Wildlife Ecology and Conservation, University of Florida, Gainesville, Florida, United States of America
Eight traditional subspecies of tiger(Panthera tigris),of which three recently became extinct, are commonly recognized on the basis of geographic isolation and morphological characteristics. To investigate the species’ evolutionary history and to establish objective methods for subspecies recognition, voucher specimens of blood, skin, hair, and/or skin biopsies from 134 tigers with verified geographic origins or heritage across the whole distribution range were examined for three molecular markers: (1) 4.0 kb of mitochondrial DNA (mtDNA) sequence; (2) allele variation in the nuclear major histocompatibility complex class IIDRBgene; and (3) composite nuclear microsatellite genotypes based on 30 loci. Relatively low genetic variation with mtDNA, DRB, and microsatellite loci was found, but significant population subdivision was nonetheless apparent among five living subspecies. In addition, a distinct partition of the Indochinese subspeciesP. t. corbettiinto northern Indochinese and Malayan Peninsula populations was discovered. Population genetic structure would suggest recognition of six taxonomic units or subspecies: (1) Amur tiger P. t. altaica;(2) northern Indochinese tigerP. t. corbetti;(3) South China tigerP. t. amoyensis;(4) Malayan tigerP. t. jacksoni, named for the tiger conservationist Peter Jackson; (5) Sumatran tigerP. t. sumatrae;and (6) Bengal tigerP. t. tigris. The proposed South China tiger lineage is tentative due to limited sampling. The age of the most recent common ancestor for tiger mtDNA was estimated to be 72,000–108,000 y, relatively younger than some other Panthera species. A combination of population expansions, reduced gene flow, and genetic drift following the last genetic diminution, and the recent anthropogenic range contraction, have led to the distinct genetic partitions. These results provide an explicit basis for subspecies recognition and will lead to the improved management and conservation of these recently isolated but distinct geographic populations of tigers.
Citation: Luo SJ, Kim JH, Johnson WE, van der Walt J, Martenson J, et al. (2004) Phylogeography and genetic ancestry of tigers(Panthera tigris).PLoS Biol 2(12): e442.
Introduction
The tiger (Panthera tigris)is the largest felid species and a widely recognized symbol of wildlife conservation. Histor-ically tigers inhabited much of Asia, including the regions between the Caspian and Aral Seas, southeastern Russia, and the Sunda islands (Mazak 1981; Hemmer 1987; Herrington 1987). Since the early 1900s, however, habitat loss, fragmen-tation, and human persecution have reduced tiger popula-tions from probably over 100,000 in 1900 to fewer than 7,000 free-ranging individuals (Nowell and Jackson 1996; Dinerstein et al. 1997; Kitchener and Dugmore 2000). Most populations consist of less than 120 animals, increasing the risk of local extirpation due to demographic and genetic factors (Smith and McDougal 1991; Dinerstein et al. 1997).
There are eight generally accepted tiger subspecies in accordance with their geographic distribution (Figure 1). Bali (P. t. balica),Caspian(P. t. virgata),and Javan (P. t. sondaica) tiger subspecies were eradicated by the 1940s, 1970s, and 1980s respectively (Nowell and Jackson 1996). Today an estimated
Received February 10, 2004; Accepted October 21, 2004; Published December 7, 2004
DOI: 10.1371/journal.pbio.0020442
Copyright:Ó2004 Luo et al. This is an open-access article distributed under the terms of the Creative Commons Attribution License, which permits unrestricted use, distribution, and reproduction in any medium, provided the original work is properly cited.
Abbreviations: AMOVA, analysis of molecular variance; CI, confidence interval; Cymt, cytoplasmic mitochondrial; Dkf, kinship coefficient; Dps, proportion of shared alleles; ME, minimum evolution; MHC, major histocompatibility complex; ML, maximum likelihood; MP, maximum parsimony; mtDNA, mitochondrial DNA; MY(A), million years (ago); NJ, neighbor joining; Numt, nuclear mitochondrial; SSCP, single strand conformation polymorphism
Academic Editor: Craig Moritz, University of California, Berkeley
*To whom correspondence should be addressed. E-mail: obrien@ncifcrf.gov
[These authors contributed equally to this work.
¤1 Current address: Biochip Project Team, Samsung Advanced Institute of Technology, Suwon, Korea
¤2 Current address: Center for Human Genetics, Duke University Medical Center, Durham, North Carolina, United States of America
¤3 Current address: Evolutionary Zoology and Genetics Laboratory, Institute of Biology and Soil Sciences, Vladivostok, Russia
3,200–4,500 Indian or Bengal tigers (P. t. tigris) exist in Bangladesh, Bhutan, western China, India, western Myanmar, and Nepal (Seidensticker et al. 1999). Fewer than 500 Amur or Siberian tigers(P. t. altaica) survive in eastern Russia, north-eastern China, and Korea (Matyushkin et al. 1999; Miquelle and Pikunov 2003), while approximately 50 Amoy or South China tigers(P. t. amoyensis)now exist in captivity only (Tilson et al. 2004). An estimated 400–500 Sumatran tigers (P. t. sumatrae) occur in Sumatra (Seidensticker et al. 1999); and 1,200–1,800 Indochinese tigers(P. t. corbetti)live in Cambodia, China, Laos, Malaysia, east Myanmar, Thailand, and Vietnam (Seidensticker et al. 1999) (Figure 1).
Subspecies of tigers are traditionally defined by body size, skull characters, pelage coloration, and striping patterns (Mazak 1981; Herrington 1987). It is generally believed that the largest tigers occur in the Russian Far East, and the smallest are found in the Sunda Islands. The shape of the occiput in the skull is characteristically narrow in the Javan and Bali tigers and much broader in Caspian tigers (Mazak
1996). However, the adequacy of these traditional subspecies designations is tentative at best, since morphological dis-tinctions in many cases have been based on a few specimens, and because subsequent studies have failed to affirm these distinctions. Herrington (1987) and Kitchener (1999) have revealed a wide range of morphological variations within the subspecies and, to some extent, overlapping among the subspecies. A previous molecular genetic assessment of 28 tigers has indicated a low level of genetic variation, revealing little evidence for subspecies distinctiveness (Wentzel et al. 1999). Moreover, ecological analyses of tiger habitat (Kitch-ener and Dugmore 2000) indicate that there have been few geographic barriers (e.g., mountain ranges and deserts) to migration and gene flow that would have been sufficient for subspecies isolation. One ecology-based conservation ap-proach emphasizes protection of about 160 continuous habitat patches or tiger conservation units regardless of subspecies designation (Dinerstein et al. 1997). Although this strategy may be desirable, optimal tiger conservation may
Figure 1.Historic and Current Geographic Distribution of Tigers Corresponding to the Eight Traditional Subspecies Designation
Geographic origin of samples and sample size (circles or squares) from each location are indicated (see Table 3 for sources). Three-letter codes (TIG, ALT, etc.) are indicated subspecies abbreviations. Dotted lines are approximate boundaries between tiger subspecies studied here. The Isthmus of Kra divides the traditional Indochinese tigers into the northern Indochinese tigersP. t. corbettiI and the Malayan tigersP. t. corbettiII based on the present study. We propose the Malayan tiger subspecies, COR II, be namedP. t. jacksoni,to honor Peter Jackson, the former Chair of the IUCN’s Cat Specialist Group who has contributed significantly to worldwide tiger conservation.
DOI: 10.1371/journal.pbio.0020442.g001
also require additional interventions such as establishing corridors and buffer zones and/or implementing reintroduc-tion programs (Tilson et al. 2001). To this end, an assessment of population genetic structure of living tigers interpreted in the context of traditional intraspecific taxonomy and the species’ evolutionary history would benefit both in situ and ex situ conservation management design.
Molecular genetic markers have been increasingly applied to assess genetic partitions among geographically isolated populations, to define the evolutionary significant unit below the species level for conservation management purposes, and to revise the traditional species and subspecies designations (Avise and Ball 1990; Moritz 1994; Fraser and Bernatchez 2001). Subspecies recognition is particularly relevant for tigers, because the current conservation strategy for this species has been inextricably bound to knowledge of its subspecific taxonomy. In this study we adhere to the subspecies concept as defined by Avise and Ball (1990) and O’Brien and Mayr (1991), to include populations below the species level that share a distinct geographic distribution, a group of phylogenetically concordant characters, and a unique natural history relative to other subdivisions of the species.
Here we attempt to overcome several factors that have complicated previous efforts to fully describe patterns of genetic variation in tigers. Foremost among these has been the limited sample size of‘‘voucher specimens’’(defined as individuals that were verified as wild-born from a specific geographic locale or captive-born from geographically verified wild-born parents). In addition, the presence of Numt, a nuclear pseudogene insertion of cytoplasmic mitochondrial DNA (mtDNA) in tiger autosomes (Lopez et al. 1994; Johnson et al. 1996; Cracraft et al. 1998; J. H. Kim, A. Antunes, S.-J. Luo, J. Menninger, W. G. Nash, et al., personal communication) has made it difficult to utilize universal mammalian primer sets for mitochondrial genes, because they will coamplify Numt. Furthermore, paucity of genetic diversity across tigers, especially in mtDNA (Wentzel et al. 1999), has made it necessary to sequence a large portion of the mtDNA genome and to assess genetic variation in multiple rapidly evolving microsatellite loci.
To establish proper biological reference specimens, sam-ples from 134 tigers of known geographic origin were collected. Three genetic markers were examined: (1) 4 kb of mtDNA sequence derived from primer pairs that excluded Numt amplification, (2) allele variation in the major histocompatibility complex (MHC)DRB gene; and (3) allele size variation of 30 hypervariable short tandem repeat loci or microsatellites. Observed patterns of population genetic variation replicated with different gene families form the basis of interpretation of the tiger’s evolutionary history and recommendations for its management.
Results
Phylogenetic Analysis of mtDNA and Microsatellites
Mitochondrial gene fragments were amplified and se-quenced from DNA extracted from 72 blood or tissue specimens using 10 cytoplasmic mitochondria (Cymt)-specific primer pairs (Figure 2 and Table 1). The fragments were concatenated in a 4,078-bp contiguous sequence. Additional mtDNA sequences were generated from 28 historical samples
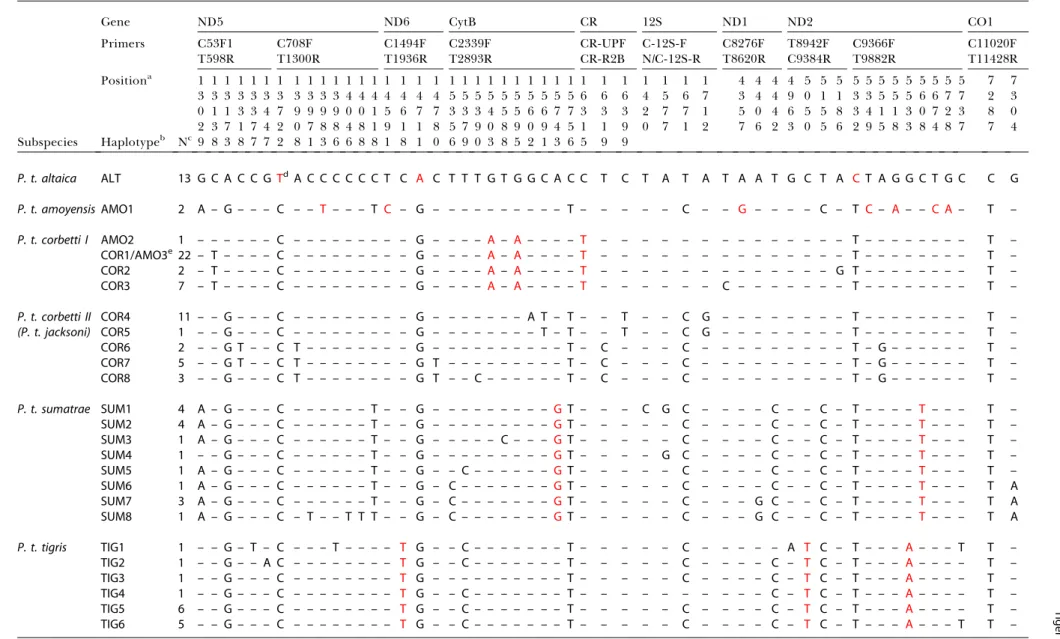
(pelt or hair) by amplifying shorter fragments (less than 400 bp) targeting selected variable sites to determine their similarity to the previously characterized haplotypes. Com-bined mtDNA sequences were obtained from 100 tigers from Russian Far East (n = 13), south China (n = 4), northern Indochina (n= 30), Malayan Peninsula (n= 22), Sumatra (n = 16), and the Indian subcontinent (n = 15). The mtDNA sequences specified 54 variable sites defining 25 haplotypes (Table 2). Thirty of the polymorphisms were observed in more than one individual and were thus phylogenetically informative (Table 2), and 29 of the 30 changes were transitions.
Phylogenetic analyses of the mtDNA haplotypes using maximum parsimony (MP), minimum evolution (ME), and maximum likelihood (ML) approaches produced congruent topologies that defined major geographic partitions (Figure 3A). Eight haplotypes (SUM1 to SUM8) generated from 16 Sumatran tigers(P. t. sumatrae)formed a monophyletic group (80% MP, 70% ME, and 66% ML bootstrap support). A second monophyletic cluster of six haplotypes (TIG1 to TIG6) from 15 Bengal tigers(P. t. tigris)also received high bootstrap support (93% MP, 82% ME, and 90% ML). The rest of the mainland Asian haplotypes grouped together and partitioned into three distinct geographic groups: (1) a genetically invariant Amur tiger lineage (P. t. altaica) represented by a single haplotype in 13 individuals, (2) a northern Indochinese
Figure 2.Schematic ofP. tigrismtDNA
The position of PCR primers used for amplification of Cymt specific sequences and alignment of the homologous Numt sequence (outer, dashed line) in tiger mitochondria. Fifteen Cymt-specific primer sets spanning 6,026 bp of mtDNA were designed and screened for polymorphism in tigers (inner, solid line). Five indicated segments showed no variation among fifteen tigers that represented five traditional subspecies and therefore were excluded from further analysis. The ten variable segments (4,078 bp) were amplified in 100 tiger individuals. Primer sequences are listed in Table 1. Diamonds indicate polymorphic mtDNA segments; brackets indicate mono-morphic mtDNA segments among tigers that were excluded from phylogenetic analysis.
DOI: 10.1371/journal.pbio.0020442.g002
lineage (P. t. corbetti I) of individuals originating from south China to the Indochinese countries north of the Isthmus of Kra, and (3) a paraphyletic assembly of haplotypes from tigers from Malayan Peninsula (P. t. corbetti II). Support for subdividing the conventional Indochinese subspecies of tigers P. t. corbettiinto two clusters was high (bootstrap values forP. t. corbettiI were 94% MP, 96% ME, and 94% ML). The COR1/ AMO3 haplotype, represented by 22 individuals from Vietnam (n= 2), Cambodia (n= 14), northeast Thailand (n = 5), and south China (n= 1), was the only haplotype found in two classical subspecies lineages (P. t. amoyensis and P. t. corbetti) (Table 2).
Voucher samples of five captive tigers collected in China, designated South China subspeciesP. t. amoyensis,fell into two very distinct phylogenetic origins. Two tigers from the Suzhou Zoo (Pti-217 and Pti-218; Table 3) carried the COR1/AMO3 haplotype, and the third (Pti-222) contained haplotype AMO2, which differed by a single nucleotide substitution from COR1/AMO3 (Table 2). The two South China tiger haplotypes grouped phylogenetically with the northern IndochineseP. t. corbettiI haplotypes (COR1–COR3) in all phylogenetic analyses (Figure 3A and 3B), and likely indicate that the maternal (mitochondrial) lineages of these tigers derived from individuals from the P. t. corbetti I phylogenetic lineages. In contrast, two P. t. amoyensis tigers (Pti-219 and Pti-220) from the Chongqing Zoo collection had a haplotype (AMO1) that formed a separate lineage that was ten nucleotide substitutions from its nearest sequence (Sumatran; Figure 3B and Table 2). If affirmed by larger sampling, this lineage would reflect a uniqueP. t. amoyensis genetic haplotype.
A statistical parsimony network of the tiger mtDNA sequences provided additional analytical support for the differentiation of P. t. sumatrae, P. t. tigris, P. t. altaica, P. t. corbettiI,P. t. corbettiII, andP. t. amoyensis(AMO1 only) (Figure
3B). Haplotypes from the same geographic group tended to be interrelated, and intergroup distances among haplotypes were generally larger than branch lengths within each group (1–4 bp). The exceptions were two lineages within the Malayan P. t. corbettiII cluster that were separated by 7 bp, which may be a result of the existence of further population substructure or, alternatively, of limited sampling in the region. Each of the six tiger subspecies groups was connected to other groups in close but not exact correspondence to their geographic location. For instance, P. t. altaica was the sister taxon toP. t. corbettiI which was connected toP. t. corbetti II.P. t. sumatrae haplotypes were linked toP. t. tigrisby 7 bp and toP. t. amoyensisby 10 bp. Nonetheless, the phylogenetic relationships among the subspecies were not resolved to a robust hierarchy, and therefore were consistent with a contemporaneous divergence of extant phylogeographic lineages.
Composite genotypes from 30 felid-specific microsatellite loci (Menotti-Raymond et al. 1999) were obtained in 113 tiger samples. Neighbor joining (NJ) analyses of individual tiger genotypes based on the proportion of shared allele (Dps) and kinship coefficient (Dkf) genetic distances produced con-cordant topologies (Figures 4 and S1) that lend support to the same phylogeographic population subdivisions observed in the mtDNA analysis. Tigers from Sumatra (P. t. sumatrae) formed a monophyletic clade with 97% bootstrap support, and Amur tigers (P. t. altaica) grouped with 76% bootstrap support. The remaining tiger genotypes partitioned into two weakly supported monophyletic lineages (Indian Subconti-nent P. t. tigrisand Malayan PeninsulaP. t. corbetti II) and a paraphyletic assemblage of northern IndochineseP. t. corbetti I. For example, three individuals from Thailand (296, Pti-297, and Pti-301) clustered with samples from the India subcontinent, blurring the distinction betweenP. t. corbettiI andP. t. tigris.The three South China tigers from the Suzhou
Table 1.PCR Primers Specific for Cytoplasmic Mitochondrial DNA Sequences
Primer ID Mitochondrial
Segments
Forwarda Reversea Size(bp)
C53F1/T598R ND5 CCCAGATCCCTATATTAACCAGT TATATCATTTTGTGTGAGGGCAC 546
C708F/T1300R ND5 CCTTGTCTTCCTGCATATCTG CCATTGGAAAGTACCCGAGGAGGT 593
C1494F/T1936R ND6 TCTCCTTCATAATCACCCTGA TGGCTGGTGGTGTTGGTTGCGG 443
C2339F/T2893R CytB TTGCCGCGACGTAAACCACG GTTGGCGGGGATGTAGTTATC 555
CR-UPF/CR-R2B CR TCAAAGCTTACACCAGTCTTGTAAACC CGTGTTGTGTGTTCTGTAT 250
C4979F/T5424Rb 12S GCACTGAAAATGCCTAGATGAGT CCAGTTTGGGTCTTAGCTATCG 446
C-12S-F/N/C-12S-R 12S AAAGCCACAGTTAACGTAA TACGACTTGTCTCCTCTTGTGG 577
T7812F/C8294Rb ND1 CGTCGTAGGACCATACGGCC CTCAGTCTCCTTCTGTTAAAT 483
C8276F/T8620R ND1 CGAAGCGAGCTCCATTTGATTTA GTGGAATGCTTGCTGTAATGATGGG 345
T8942F/C9384R ND2 CTTATAGTCTGAATCGGCTTCG AGCTATGATTTTTCGTACCT 443
C9366F/T9882R ND2 GGGGAGTTAACCAAACCGAG CAAGGACGGATAGTATTGGTG 517
C10525F/T11013Rb COI GGAGGATTCGGAAACTGGCGA CCAGAAGTCTATATCTTAATCCCG 489
C11020F/T11428R COI CCAGAAGTCTATATCTTAATCCCG GCTCCTATTGACAAGACGTAGTGGA 409
T11988F/C12414b COII GGCATACCCCTTCCAACTAGGT TGCACACTTCTATTGCTAGT 427
C12618F/T12920Rb ATP8 TTGTCCATGAACTAGTCCCATCAT GGAAACAGCTATGACCGGCG 303
aPrimers are listed in the 59-to-39direction
bPCR products amplified using these primer sets show no variation among all samples
DOI: 10.1371/journal.pbio.0020442.t001
Table 2.Haplotypes and Variable Sites in Combined Analysis of 4,078 bp of Tiger(P.tigris)mtDNA Sequences
Gene ND5 ND6 CytB CR 12S ND1 ND2 CO1
Primers C53F1 C708F C1494F C2339F CR-UPF C-12S-F C8276F T8942F C9366F C11020F
T598R T1300R T1936R T2893R CR-R2B N/C-12S-R T8620R C9384R T9882R T11428R
Positiona 1 1 1 1 1 1 1 1 1 1 1 1 1 1 1 1 1 1 1 1 1 1 1 1 1 1 1 1 1 1 1 1 1 1 1 4 4 4 4 5 5 5 5 5 5 5 5 5 5 5 5 7 7 3 3 3 3 3 3 3 3 3 3 3 4 4 4 4 4 4 4 5 5 5 5 5 5 5 5 5 5 6 6 6 4 5 6 7 3 4 4 9 0 1 1 3 3 5 5 5 6 6 7 7 2 3 0 1 1 3 3 4 7 9 9 9 9 0 0 1 5 6 7 7 3 3 3 4 5 5 6 6 7 7 3 3 3 2 7 7 1 5 0 4 6 5 5 8 3 4 1 1 3 0 7 2 3 8 0 2 3 7 1 7 4 2 0 7 8 8 4 8 1 9 1 1 8 5 7 9 0 8 9 0 9 4 5 1 1 9 0 7 1 2 7 6 2 3 0 5 6 2 9 5 8 3 8 4 8 7 7 4 Subspecies Haplotypeb Nc 9 8 3 8 7 7 2 8 1 3 6 6 8 8 1 8 1 0 6 9 0 3 8 5 2 1 3 6 5 9 9
P. t. altaica ALT 13 G C A C C G Td A C C C C C C T C A C T T T G T G G C A C C T C T A T A T A A T G C T A C T A G G C T G C C G
P. t. amoyensisAMO1 2 A – G – – – C – – T – – – T C – G – – – – – – – – – – T – – – – – C – – G – – – – C – T C – A – – C A – T –
P. t. corbetti I AMO2 1 – – – – – – C – – – – – – – – – G – – – – A – A– – – – T – – – – – – – – – – – – – – T – – – – – – – – T –
COR1/AMO3e22 – T – – – – C – – – – – – – – – G – – – – A – A– – – – T – – – – – – – – – – – – – – T – – – – – – – – T –
COR2 2 – T – – – – C – – – – – – – – – G – – – – A – A– – – – T – – – – – – – – – – – – – G T – – – – – – – – T –
COR3 7 – T – – – – C – – – – – – – – – G – – – – A – A– – – – T – – – – – – C – – – – – – – T – – – – – – – – T –
P. t. corbetti II COR4 11 – – G – – – C – – – – – – – – – G – – – – – – – A T – T – – T – – C G – – – – – – – – T – – – – – – – – T –
(P. t. jacksoni) COR5 1 – – G – – – C – – – – – – – – – G – – – – – – – – T – T – – T – – C G – – – – – – – – T – – – – – – – – T –
COR6 2 – – G T – – C T – – – – – – – – G – – – – – – – – – – T – C – – – C – – – – – – – – – T – G – – – – – – T –
COR7 5 – – G T – – C T – – – – – – – – G T – – – – – – – – – T – C – – – C – – – – – – – – – T – G – – – – – – T –
COR8 3 – – G – – – C T – – – – – – – – G T – – C – – – – – – T – C – – – C – – – – – – – – – T – G – – – – – – T –
P. t. sumatrae SUM1 4 A – G – – – C – – – – – – T – – G – – – – – – – – – GT – – – C G C – – – – C – – C – T – – – – T – – – T –
SUM2 4 A – G – – – C – – – – – – T – – G – – – – – – – – – GT – – – – – C – – – – C – – C – T – – – – T – – – T –
SUM3 1 A – G – – – C – – – – – – T – – G – – – – – C – – – GT – – – – – C – – – – C – – C – T – – – – T – – – T –
SUM4 1 – – G – – – C – – – – – – T – – G – – – – – – – – – GT – – – – G C – – – – C – – C – T – – – – T – – – T –
SUM5 1 A – G – – – C – – – – – – T – – G – – C – – – – – – GT – – – – – C – – – – C – – C – T – – – – T – – – T –
SUM6 1 A – G – – – C – – – – – – T – – G – C – – – – – – – GT – – – – – C – – – – C – – C – T – – – – T – – – T A
SUM7 3 A – G – – – C – – – – – – T – – G – C – – – – – – – GT – – – – – C – – – G C – – C – T – – – – T – – – T A
SUM8 1 A – G – – – C – T – – T T T – – G – C – – – – – – – GT – – – – – C – – – G C – – C – T – – – – T – – – T A
P. t. tigris TIG1 1 – – G – T – C – – – T – – – – T G – – C – – – – – – – T – – – – – C – – – – – A T C – T – – – A – – – T T –
TIG2 1 – – G – – A C – – – – – – – – T G – – C – – – – – – – T – – – – – C – – – – C – T C – T – – – A – – – – T –
TIG3 1 – – G – – – C – – – – – – – – T G – – – – – – – – – – T – – – – – C – – – – C – T C – T – – – A – – – – T –
TIG4 1 – – G – – – C – – – – – – – – T G – – C – – – – – – – T – – – – – – – – – – C – T C – T – – – A – – – – T –
TIG5 6 – – G – – – C – – – – – – – – T G – – C – – – – – – – T – – – – – C – – – – C – T C – T – – – A – – – – T –
TIG6 5 – – G – – – C – – – – – – – – T G – – C – – – – – – – T – – – – – C – – – – C – T C – T – – – A – – – T T –
aNucleotide positions correspond to the complete reference
Felis catusmtDNA sequence (Lopez et al. 1996). bSubspecies abbreviation code as in Figure 1. Base pairs identical to haplotype ALT are indicated by a dash. cNumber of individuals with each haplotype. Individual tiger mtDNA haplotypes are listed in Table 3. dRed nucleotides are subspecies-specific sites.
eCOR1/AMO3 is a haplotype shared by 21 tigers that are initially designated as COR and one AMO (text and Table 3).
DOI: 10.1371/journal.pbio.0020442.t002
PLoS
Biology
|
www.plosbiolo
gy.org
December
2004
|
Volume
2
|
Issue
12
|
e442
2279
Tiger
Phylogeo
Zoo, China, that had clustered withP. t. corbettiI by mtDNA (Pti-217, Pti-218, and Pti-222) also associated more closely withP. t. corbettiI from northern Indochina by microsatellite analysis (Figure 4). The two distinct (by mtDNA)P. t. amoyensis individuals (Pti-219 and Pti-220) from the Chongqing Zoo, China, likewise formed a distinct lineage in the microsatellite analysis (Figure 4).
Population Subdivision Analysis
To quantify the extent of population differentiation in modern tigers, we evaluated four different geographic subdivision scenarios and compared them on the basis of analysis of molecular variance (AMOVA) with both mtDNA haplotypes and microsatellite genotypes (Table 4). P. t. amoyensisindividuals (Pti-219 and Pti-220) were excluded in this subdivision analysis due to our small sample size. In our first hypothesis, two groups were considered: theP. t. sumatrae island population and all contemporary mainland popula-tions (P. t. altaica, P. t. corbettiI,P. t. corbettiII,P. t. tigris). This recently proposed model (Cracraft et al. 1998; Kitchener 1999; Kitchener and Dugmore 2000) presumes continuous habitat distribution on the mainland. The second scenario considered tigers as three groups: the Sumatran population (P. t. sumatrae),the Amur tigers(P. t. altaica),which presently are isolated from other tiger populations by more than their maximum known dispersal distance (Mazak 1996), and a group of the other mainland tigers subspecies. The third hypothesis followed the division of the four traditional subspecies: (1) Amur tigers (P. t. altaica), (2) P. t. corbetti, including Indochina and part of south China, (3) Bengal tigers(P. t. tigris),and (4) Sumatran tigers(P. t. sumatrae).The fourth scenario, based on the results of the mtDNA phylogenetic analyses (see Figure 3) and the hypothesis that the Isthmus of Kra may serve as a potential geographic barrier (Kitchener 1999), further subdivided classical P. t. corbettiinto the northern Indochina regionP. t. corbettiI and the Malayan PeninsulaP. t. corbettiII, resulting in five groups. The AMOVA results for each of the four scenarios are presented in Table 4.
For both mitochondrial haplotype and microsatellite data, the five-group scenario yielded the highest Fst(for mtDNA, defined as the proportion of total genetic variation that is attributable to genetic differences between populations) and Rst(for microsatellites, an Fstanalogy suited for the stepwise mutation model that applies to microsatellite data) values. Under this model, 31% of the microsatellite variation discriminated between the five groups, while the balance, 69%, occurred within each group. For mtDNA the Fst was
very high (0.838), indicating that 84% of the variation was partitioned among the different phylogeographic subspecies. Each of the five subspecies showed highly significant population genetic differentiation (p , 0.0001) by pairwise Fstand Rstwith 10,000 permutations (Table 5). The contrast between the mtDNA and microsatellite genetic variation probably reflects the difference in the effective population size assessed by these two different markers and/or, to some extent, the intersexual differences in dispersal.
An alternative analysis of the combined microsatellite and mitochondrial haplotype data using a Bayesian approach (Figure S2 and Table S1) as implemented in the program STRUCTURE (Pritchard et al. 2000) supported the partition-ing ofP. t. altaica, P. t. sumatrae, P. t. tigris,andP. t. corbettiII, but further split the 33 P. t. corbetti I individuals into three distinctive population groups: (1) four tigers from China and Vietnam; (2) nine tigers from Cambodia; and (3) 20 tigers from Cambodia and northern Thailand (K = 7, Pr[K] = 0.993). In this scenario, most individuals were assigned to a cluster with high probability (q.0.90), indicating very low level of gene flow between the groups. However, because this additional substructure within P. t. corbetti I had little geographic or ecological basis, and because AMOVA analysis based on this population subdivision resulted in lower Fstand Rstvalues than that in the five-group scenario (unpublished data), the distinction was not considered to be a consistent basis for subspecies classification and may reflect additional population differentiation within a subspecies.
Genetic Variation in Tigers
Quantitative estimates of mtDNA diversity in tigers with comparable estimates from selected felid species demonstra-ted that overall, tigers had moderate levels of mtDNA diversity (Table 6), substantially less than leopards(P. pardus) (Uphyrkina et al. 2001), Geoffroy’s cat (Oncifelis geoffroyi), Pampas cat(O. colocolo),or tigrina(Leopardus tigrinus)(Johnson et al. 1999), but comparable to pumas(Puma concolor)(Culver et al. 2000) in percent variable sites, mean pairwise distance among individuals, and average nucleotide diversity. Four tiger subspecies (P. t. tigris, P. t. sumatrae, P. t. corbettiI, andP. t. corbettiII) showed moderate nucleotide diversity (p), ranging from 0.0001 to 0.0070 (Table 6). TheP. t. altaiasampling of 13 individuals showed no mtDNA haplotype variation. Of the five individuals originally designated asP. t. amoyensis,three were genetically indistinguishable fromP. t. corbettiI, resulting in an inadequate sample size for a meaningful estimation of population variation.
Parameters of microsatellite variation have been shown to
Figure 3.Phylogenetic Relationships among Tigers from mtDNA Haplotypes
(A) Phylogenetic relationships based on MP among the tiger mtDNA haplotypes from the combined 4,078 bp mitochondrial sequence (Table 2). Branches of the same color represent haplotypes of the same subspecies. Trees derived from ME and ML analyses have identical topologies. Numbers above branches represent bootstrap support from 100 replicates using the MP method, followed by bootstrap values using the ME-ML analyses (only those over 70% are indicated). Numbers below branches show number of MP steps per number of homoplasies from a strict consensus tree. Numbers in parentheses represent numbers of individuals sharing the same haplotype. MP analysis using heuristic search and tree-bisection-reconnection branch-swapping approach results in two equally most-parsimonious trees and the one resembling the ME and ML trees is shown here (tree length = 60 steps; CI = 0.900). The ME tree is constructed with PAUP using Kimura two-parameter distances (transition to transversion ratio = 2) and NJ algorithm followed by branch-swapping procedure (ME = 0.0142). The ML approach is performed using a TrN (Tamura-Nei)þI (with proportion of invariable sites) model, and all nodes of the ML tree were significant (a consensus of 100 trees, –
Ln likelihood = 5987.09).
(B) Statistical parsimony network of tiger mtDNA haplotypes based on 4,078 mtDNA sequences constructed using the TCS program (Clement et al. 2000). The area of the circle is approximately proportional to the haplotype frequency, and the length of connecting lines is proportional to the exact nucleotide differences between haplotypes with each unit representing one nucleotide substitution. Missing haplotypes in the network are represented by dots. Haplotype codes and the number of individuals (in parentheses) with each haplotype are shown (see Table 2). DOI: 10.1371/journal.pbio.0020442.g003
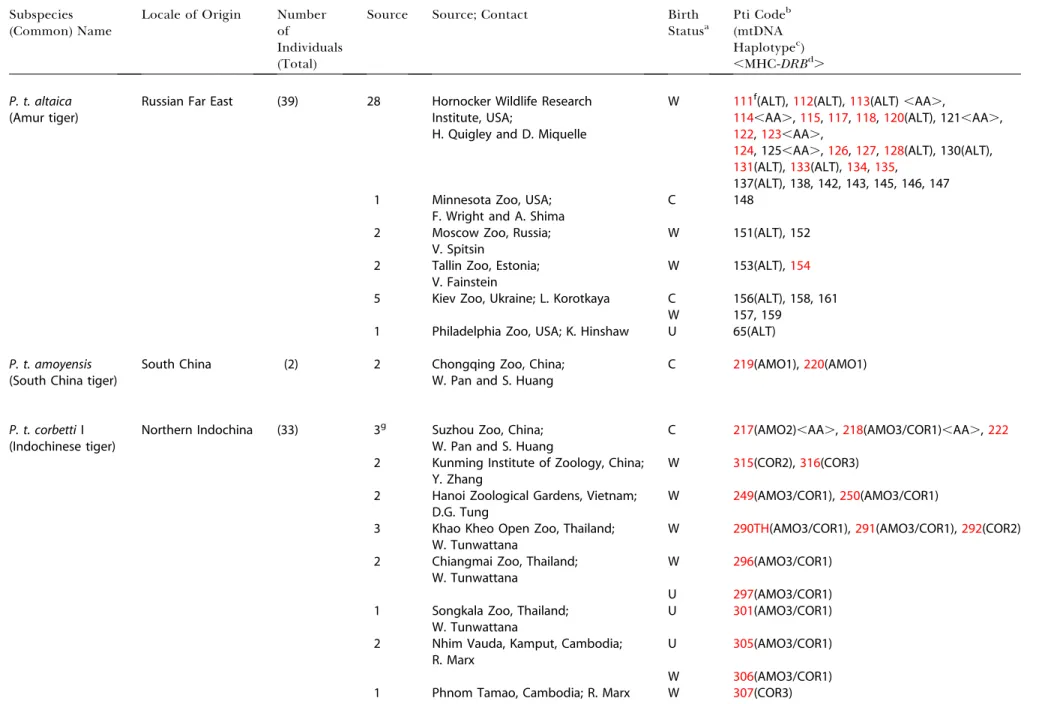
Table 3.Samples ofPanthera tigrisUsed in the Study
Subspecies (Common) Name
Locale of Origin Number of
Individuals (Total)
Source Source; Contact Birth
Statusa
Pti Codeb
(mtDNA Haplotypec)
,MHC-DRBd.
P. t. altaica
(Amur tiger)
Russian Far East (39) 28 Hornocker Wildlife Research
Institute, USA;
H. Quigley and D. Miquelle
W 111f(ALT),112(ALT),113(ALT) ,AA.,
114,AA.,115,117,118,120(ALT), 121,AA.,
122,123,AA.,
124, 125,AA.,126,127,128(ALT), 130(ALT),
131(ALT),133(ALT),134,135,
137(ALT), 138, 142, 143, 145, 146, 147
1 Minnesota Zoo, USA;
F. Wright and A. Shima
C 148
2 Moscow Zoo, Russia;
V. Spitsin
W 151(ALT), 152
2 Tallin Zoo, Estonia; V. Fainstein
W 153(ALT),154
5 Kiev Zoo, Ukraine; L. Korotkaya C 156(ALT), 158, 161
W 157, 159
1 Philadelphia Zoo, USA; K. Hinshaw U 65(ALT)
P. t. amoyensis
(South China tiger)
South China (2) 2 Chongqing Zoo, China;
W. Pan and S. Huang
C 219(AMO1),220(AMO1)
P. t. corbettiI (Indochinese tiger)
Northern Indochina (33) 3g Suzhou Zoo, China;
W. Pan and S. Huang
C 217(AMO2),AA.,218(AMO3/COR1),AA.,222
2 Kunming Institute of Zoology, China; Y. Zhang
W 315(COR2),316(COR3)
2 Hanoi Zoological Gardens, Vietnam; D.G. Tung
W 249(AMO3/COR1),250(AMO3/COR1)
3 Khao Kheo Open Zoo, Thailand; W. Tunwattana
W 290TH(AMO3/COR1),291(AMO3/COR1),292(COR2)
2 Chiangmai Zoo, Thailand; W. Tunwattana
W 296(AMO3/COR1)
U 297(AMO3/COR1)
1 Songkala Zoo, Thailand; W. Tunwattana
U 301(AMO3/COR1)
2 Nhim Vauda, Kamput, Cambodia; R. Marx
U 305(AMO3/COR1)
W 306(AMO3/COR1)
1 Phnom Tamao, Cambodia; R. Marx W 307(COR3)
PLoS
Biology
|
www.plosbiolo
gy.org
December
2004
|
Volume
2
|
Issue
12
|
e442
2282
Tiger
Phylogeo
Table 3.Continued
Subspecies (Common Name)
Locale of Origin Number of
Individuals (Total)
Source Source; Contact Birth
Statusa
Pti Codeb (mtDNA Haplotypec) ,MHC-DRBd.
P. t. corbettiI (Indochinese tiger)
17 Department of Forestry and Wildlife, Cambodia; S. Hean
W CB11e,f(AMO3/COR1),CB13e(AMO3/COR1),
CB14e(AMO3/COR1),CB15e(AMO3/COR1),
continued CB16e(AMO3/COR1),CB18e(AMO3/COR1),
CB22e(AMO3/COR1),CB24e(AMO3/COR1),
CB32e(AMO3/COR1),CB36e(AMO3/COR1),
CB6e(AMO3/COR1),CB7e(AMO3/COR1),
CB23e(COR3),CB27e(COR3),CB29e(COR3),
CB31e(COR3),CB34e(COR3)
P. t. corbetti II / P. t. jacksoni Malayan Peninsula (22) 1 San Diego Zoo, USA; D. Janssen C 108(COR4)
(Malayan tiger) (P. t. corbettiII/ P. t. jacksoni) 2 Cincinnati Zoo, USA; E. Maruskka C 211(COR4),BC. W 210(COR6),BD. 4 Singapore Zoo, Singapore;
P. Martelli and B. Harrison
C 247(COR4),253(COR4),254(COR4),255(COR4),
2 Songkala Zoo, Thailand; W. Tunwattana
C 303(COR4)
W 304(COR7)
8 Zoo Melaka, Malaysia; R.M. Abdullah and M.N. Yasak
W 267(COR4),263(COR5),163(COR6),265(COR7),
266(COR7),262(COR8),264(COR8),268(COR8) 3 Zoo Taiping, Malaysia;
K. Lazarus
C 269(COR4),270(COR4)
W 271(COR4)
2 Zoo Negara, Malaysia; V. Subramaniam
C 272(COR7),273(COR7)
P. t. sumatrae
(Sumatran tiger)
Sumatra (21) 11 Taman Safari Zoo, Indonesia;
J. Manansang and O. Byers
W 170(SUM1),EE.,171(SUM2),EF.,
172,EF.,174(SUM5),EF.,178(SUM7),EF., 179,EE.,
181,EE.,183(SUM6),EF.,184(SUM7),
185(SUM4),186,EF. 1 Phoenix Zoo, USA;
R. Hoyt
U 96(SUM3),EE.
3 San Diego Zoo, USA; D. Janssen C 97(SUM2),99(SUM2),150(SUM2) 1 Henry Dorley Zoo, USA;
D. Armstrong
U 100,EG.
1 San Antonio Zoological Gardens, USA U 206(SUM7) 1 Atlanta Zoo, USA;
R. McManamon
U 208(SUM1)
PLoS
Biology
|
www.plosbiolo
gy.org
December
2004
|
Volume
2
|
Issue
12
|
e442
2283
Tiger
Phylogeo
Table 3.Continued
Subspecies (Common Name)
Locale of Origin Number of
Individuals (Total)
Source Source; Contact Birth
Statusa
Pti Codeb (mtDNA Haplotypec) ,MHC-DRBd.
P. t. sumatrae 1 Louisville Zoo, USA; R. Burns U 209(SUM8)
(Sumatran tiger) continued
1 National Zoological Park, USA; M. Bush
W 216(SUM1)
1 Kebun Binatang Ragunan Zoo, Indonesia; B. Karesh
U 175(SUM1)
P. t. tigris
(Bengal tiger)
Indian Subcontinent (17) 1 Cincinnati Zoo, USA; M. Campbell C 90(TIG1)
4 Nagarhole National Park, India; M. Sunquist and U. Karanth
W 102,103(TIG2),104(TIG3),105
12 Chitwan National Park, Nepal; J.L.D. Smith and L. Johnson
W 165(TIG4),AA., NP1e(TIG5), NP7e(TIG6), NP9e(TIG6), NP11e(TIG5), NP14e(TIG5), NP18e(TIG6), NP20e(TIG6), NP23e(TIG5), NP24e(TIG5), NP25e(TIG5), NP26e(TIG6)
aBirth Status of each tiger: W, wild-born, C, captive-born; U, status unknown.
bIdentification number of tiger individuals as they are listed in the database at the Laboratory of Genomic Divesity, National Cancer Institute, Frederick, Maryland, United States. cMtDNA haplotype assigned to each sample sequenced in the study.
dMHC ClassII
DRBallele genotypes. eSamples of pelt or hair.
fRed samples represent samples with microsatellite data from 30 loci. gTigers individuals classified as South China tiger originally.
DOI: 10.1371/journal.pbio.0020442.t003
PLoS
Biology
|
www.plosbiolo
gy.org
December
2004
|
Volume
2
|
Issue
12
|
e442
2284
Tiger
Phylogeo
provide sensitive measures of historic demographic pertur-bations in felid and other species (Driscoll et al. 2002). Estimates of heterozygosity, average numbers of allele per locus, microsatellite variance in allele size, and allele size range in tigers were comparable to other felid species such as jaguar, leopard, puma, lions, and cheetahs across the same microsatellite loci (n = 17) (Table 7). After Bonferroni correction, eight of the 30 loci were significantly out of Hardy-Weinberg equilibrium inP. t. corbettiI (p, 0.00167), possibly reflecting further population subdivision in this region. Expected heterozygosity in tigers ranged from 0.456
in P. t. altaica to 0.670 in P. t. corbetti I (Table 7). Average microsatellite variance was highest inP. t. tigris(4.94) andP. t. corbettiI (3.58) and lowest inP. t. altaica(1.93).
All six phylogeographic subspecies groups showed popula-tion-specific alleles that tended to represent the extreme sizes of allele distributions (Table 8). Of the 49 private alleles, 26 were either the largest or smallest size class among all tigers, and 38 were either the smallest or the largest for a specific subspecies, thus supporting a recent derivation. Frequencies of such private alleles were low in each population, from 1.5% of total allele numbers inP. t. amoyensisto 14.6% inP. t.
Figure 4.Phylogenetic Relationships among the Individual Tigers from Composite Microsatellite Genotypes of 30 Loci
Branches of the same color represent tiger individuals of the same subspecies. The NJ tree, which is based on Dps and Dkf with the (1 – ps/kf) option in MICROSAT (Minch et al. 1995), generated similar topologies, and only the Dps tree is shown here. Numbers are individual Pti codes (Table 3). Bootstrap values over 50% are shown on the divergence node.
DOI: 10.1371/journal.pbio.0020442.g004
Table 4.Measures of Geographic Subdivision Based on AMOVA with MtDNA and Microsatellite Data
Subdivisiona Subspeciesb MtDNA F
st Microsatellite Rst
Two populations [SUM], [ALT, TIG, CORI, CORII] 0.480 0.252
Three populations [SUM], [ALT], [TIG, CORI, CORII] 0.525 0.273
Four populations [SUM], [ALT], [TIG], [CORI, CORII] 0.659 0.276
Five populations [SUM], [ALT], [TIG], [CORI], [CORII] 0.838 0.314
aPopulation subdivision scenarios are described in the text.
bSubspecies was grouped by brackets into populations for the analysis.
DOI: 10.1371/journal.pbio.0020442.t004
corbettiI (Table 8).In addition,P. t. corbettiI had the highest average number of alleles per locus, the highest average allele size range per locus, and the most continuous and heteroge-neous allele size distribution among all subspecies groups.
Major Histocompatibility Complex—DRBGene Variation
The most polymorphic gene complex in all mammals is the MHC. This critical region for immunological recognition of infectious agents has 147 genes in the domestic cat, including three functional class II DRB genes on chromosome B3 (Yuhki et al. 2003).DRBgene homologs were amplified from DNA extracted from 21 tigers and screened for sequence diversity using single strand conformational polymorphism (SSCP). There were a total of seven electrophoretic allele variants (A–G). This is a relatively low MHC-DR diversity compared to human and domestic cat, which possess 126 and 63 DRB alleles, respectively, for the same gene segment in samplings of 251 humans and 37 cats, respectively (Yuhki and O’Brien 1997; Bodmer et al. 1999). Despite this reducedDRB variation among tigers, there was detectable population differentiation. Three mainland subspecies P. t. tigris (n = 1), P. t. altaica (n = 5), and P. t. corbetti I (n = 2) were genetically identical forDRB-A allele sequence. Three addi-tionalDRBalleles (B, C, and D) were found only inP. t. corbetti II (n= 2), while three others (E, F, and G) were unique toP. t. sumatrae(n= 11) (Tables 3 and 8) (Wentzel et al. 1999).
Estimation of the Coalescence Time of Genetic Variations in Tigers
The mtDNA sequence divergences in a combined data set of 3,217 bp, of which homologous sequences from the tiger and leopard were both determined (see Materials and Methods), were used to estimate coalescence time for extant tiger mtDNA lineages and its 95% confidence interval (CI:6 two standard errors) based on a linearized tree method (Takezaki et al. 1995). Neither the two-cluster nor the branch-length molecular clock test revealed significant rate hetero-geneity among tiger sequences (confidence probability less than 95%), suggesting that the divergence of the mtDNA sequences were compatible with a molecular clock hypoth-esis. Thus, all sequences were used to construct a linearized tree using the NJ tree algorithm with Kimura two-parameter distances. Assuming a divergence time for leopards and tigers of 2 MY, there were an estimated 2.29310–8substitutions per site per y, or one substitution every 14,000 y in the segment examined. According to this rate, the estimated coalescence
time of mtDNA variation for extant tiger lineages was 72,000 y (95% CI = 39,000–104,000 y). An older fossil record calibration of 3 MY for the separation of leopards and tigers produced a rate of 1.53310–8substitutions per site per y, or one substitution every 20,000 y. According to this substitution rate, mtDNA diversity of modern tigers originated about 108,000 y (95% CI = 59,000–157,000 y) ago. Based on either calibration, the Amur tigers probably experienced a genetic reduction or founder event more recently (less than 20,000 y), as no variation was detected within the population.
The estimate of microsatellite variance in average allele repeat-size can also be used as a surrogate for evolutionary time based on the rate of allele range reconstitution subsequent to a severe founder effect (Driscoll et al. 2002). Using a standard curve for the relationship of microsatellite variance to elapsed time (see Figure 4 in Driscoll et al. [2002]), the variance for all tigers converged to 19,000 y ago. The age of different subspecies, based on populations for which we had an adequate sample size (n.15), ranged from 9,900 y in Amur tigersP. t. altaicato 18,437 y in northern Indochinese tigersP. t. corbettiI.
We estimated the historic population size required to sustain the level of mitochondrial genetic variation under the assumption of neutrality of substitution and mutation-drift equilibrium (Kimura 1955; Nei 1987), where the population parameter h = 2NelT, and Ne is the long-term effective female population size,l the substitution rate per site per year, and T the generation time. From a coalescent-based simulation of the mitochondrial sequences, the average estimate ofhwas 0.00255 per nucleotide site, with a 95% CI from 0.00147 to 0.00417. With the substitution rate calibrated from this study (1.91 3 10–8 bp–1 y–1) and an average generation time of 5 y for tigers (Smith and McDougal 1991), the historical effective population size is an estimated 13,350 females (95% CI = 7,700–21,830).
Discussion
Overall, tigers displayed moderate levels of molecular genetic variation in mtDNA and DRB sequences compared with other mammalian species, consistent with previous allozyme studies (O’Brien et al. 1987). There was a variable site every 75 bp, with 54 sites in the more variable 4-kb segment and one variable site every 112 bp in the larger 6,026-bp segment (see Materials and Methods). This value was less than what was observed in leopards in a smaller portion
Table 5.Measures of Pairwise Comparisons in Tigers Based on AMOVA with mtDNA and Microsatellite Data
ALT CORI CORII SUM TIG
ALT - 0.257 0.374 0.521 0.474
CORII 0.742 0.797 - 0.362 0.274
SUM 0.891 0.910 0.668 - 0.239
TIG 0.942 0.940 0.690 0.786
-Population pairwise Fstestimates under the five-group scenario using the combined data from the mitochondrial regions and Kimura two-parameter are below the diagonal;
Rstestimates using data from 30 microsatellite loci are above the diagonal. All populations are significantly different (p,0.0001) by Fstvalues based on mitochondrial data
or Rstvalues based on microsatellite data.
DOI: 10.1371/journal.pbio.0020442.t005
of mtDNA (one variable site every 15 bp in 727 bp of the gene encoding NADH dehydrogenase subunit 5, calledND5, and that for the control region, called CR; 34 haplotypes were found) (Uphyrkina et al. 2001). MHC class-II DRB gene variation was also low relative to human and domestic cat (Yuhki and O’Brien 1997; Bodmer et al. 1999). By contrast, estimates of tiger microsatellite variability were more similar to those of other felid species (Table 7) (Culver et al. 2000; Eizirik et al. 2001; Uphyrkina et al. 2001; Driscoll et al. 2002). The oldest tiger fossils, around two million y (MY) old, are from northern China and Java (Hemmer 1987). By the late Pliocene and early Pleistocene tigers were widely distributed in eastern Asia. However, Pleistocene glacial and interglacial fluctuations and other geological events probably caused repeated geographic restrictions and expansions (Hemmer 1987; Kitchener 1999; Kitchener and Dugmore 2000). We estimated the most recent common ancestor for tiger mtDNA haplotypes was 72,000–108,000 y ago, with a lower and upper bound of 39,000 y and 157,000 y, respectively. This estimate is much earlier than that derived for the leopard, which is considered to have originated in Africa 470,000–825,000 y ago and to have arrived in Asia 170,000–300,000 y ago (Uphyrkina et al. 2001). Likewise, extant jaguar(Panthera onca)
lineages diverged approximately 280,000–510,000 y ago (Eizirik et al. 2001). Our coalescence estimate for tigers corresponds roughly with the catastrophic eruption of Toba in Sumatra around 73,500 y ago (Rampino and Self 1992), which has been linked to the Late Pleistocene bottleneck in human evolution (Ambrose 1998) and to a major northward dispersal event in the Asian elephants (Fleischer et al. 2001). Based on the subspecies definition of O’Brien and Mayr (1991) and Avise and Ball (1990), our data suggest that there are at least five and possibly six tiger subspecies: Amur tigers (P. t. altaica); northern Indochinese tigers (P. t. corbetti I); southern Indochinese tigers (P. t. corbetti II), which are confined to the Malayan Peninsula; Sumatran tigers (P. t. sumatrae); Bengal tigers (P. t. tigris); and, if its uniqueness is affirmed by more extensive sampling, South China tiger(P. t. amoyensis). These conclusions are based on significant genetic structure among tigers from these different geographic regions with the MHC, mtDNA, and microsatellite data, and extremely limited gene flow as shown by disjunct distribu-tions of genetic variation (unique mtDNA haplotypes and microsatellite alleles) and the high mtDNA Fst and micro-satellite Rst values. In addition, each subspecies has an allopatric geographical distribution (see Figure 1) and
Table 6.Estimates of Molecular Genetic Variation from Combined MtDNA Sequences (4,078 bp)
N Length
(bp)
Number of Haplotypes
Number of Variable Sites
Percent Variable Sites
Number of Population-Specific Sites
Mean Number Pairwise Differences (6SD)
Nucleotide Diversity (p) (6SD)
Tigera 15 6,026 12 42 0.70 – 10.91
65.26 0.0018160.000979
Tiger 100 4,078 25 54 1.32 – 10.1164.66 0.0024860.00127
P.t.altaica 13 4,078 1 0 0 4 0 0
P.t.corbettiI 32 4,078 4 3 0.07 4 0.5460.46 0.00013260.000125
P.t.corbettiII(jacksoni) 22 4,078 5 10 0.25 0 4.8362.45 0.0011860.000670
P.t.sumatrae 16 4,078 8 11 0.27 2 2.9261.62 0.0071760.00444
P.t.tigris 15 4,078 6 8 0.20 3 1.4560.93 0.00035560.000256
P.t.amoyensis 2 4,078 1 0 0 7 0 0
Leopardb 69 611 33 50 8.18 – 8.6764.40 0.012160.0062
Far Eastern leopard 12 611 2 1 0.16 2 0.1760.24 0.000260.0004
Indian leopard 9 611 6 8 1.31 1 2.6161.54 0.003660.0024
Geoffroy’s catc 38 873 32 48 5.50 – – 0.0126
60.0065
Kodkod 6 873 3 7 0.80 – – 0.002960.0021
Pampas cat 22 873 14 44 5.04 – – 0.004960.0040
Tigrina 32 873 11 44 5.04 – – 0.002260.0026
Pumad 286 891 14 15 1.68 – 3.63 0.0032
S. A. Puma 87 891 11 11 1.23 – 2.10 0.0030
N. A. Puma 186 891 2 1 0.11 1 1.00 0.0002
Florida Puma 6 891 1 0 0 0 0 0
aFifteen tigers were screened in a 6,026 bp mtDNA segment, and 1,948 bp was excluded in the following large-scale sampling because of lack of variation. bFrom a combined analysis of mtDNAND5(611 bp) andCR(116 bp) (Uphyrkina et al. 2001).
cFrom a combined analysis of mtDNA16S(364 bp),ATP8(191 bp), andND5(318 bp) (Johnson et al. 1999). dFrom a combined analysis of mtDNA16S(382 bp),ATP8(191 bp), andND5(318 bp) (Culver et al. 2000).
DOI: 10.1371/journal.pbio.0020442.t006
differential natural history (Kitchener 1999; Seidensticker et al. 1999).
The hypothesis that tiger population structure reflects recent (less than 10,000 y ago), human-induced population fragmentation and random lineage loss from a single panmictic population is not supported by the strong geo-graphical partitioning of the mitochondrial lineages or by differences in measures of nucleotide diversity within each subspecies. Mismatch analysis (Rogers and Harpending 1992) of pairwise differences among all tiger mtDNA haplotypes also revealed a multimodal distribution significantly different from a Poisson expectation, indicating the existence of several highly divergent populations (unpublished data). It is plausible that tiger populations (subspecies) differentiated through the combined effects of genetic drift in isolated populations and local adaptation to rapidly changing habitats across the tiger range during the Holocene (Lister 2004). For
example, Sumatran tigers currently occupy tropical moist forests, and Bengal tigers range from tropical dry forests, terai forests, and tall grasslands to the Himalayan foothills. However, we cannot rule out the possibility that some of the current population subdivision, particularly in the case of the divergence ofP. t. altaicaandP. t. amoyensis/P. t. corbettiI, could be related to the disruption of an isolation-by-distance pattern caused by the recent extinction of intermediate populations; this hypothesis can be tested only when a larger geographic sampling is available.
The differences in molecular genetic patterns among the six hypothesized subspecies are dramatic (Table 8). Further, the results lend support to the hypothesis that the Pleistocene centrum of tiger radiation is located within northern Indo-china and southern China. ModernP. t. corbettiI has a large number of mtDNA diagnostic sites (three), the largest number of unique microsatellite alleles (19 out of 130), and the
Table 7.Genetic Variation across 30 Microsatellite Loci in Tiger Subspecies
N Number
of Loci Typed
Average Expected Heteozygosity
Average Observed Heteozygosity
Average Number of Alleles Per Locus
Average Microsatellite Variance
Average Allele Size range
(Repeats per Locus)
P.tigris 113 30 0.72060.0176 0.53760.0088 7.3062.25 3.68 7.47 17 0.72860.0149 0.51860.0117 7.0061.41 4.04 7.71 P.t.altaica 34 30 0.45660.0403 0.47360.0158 3.4761.22 1.93 4.43 17 0.40860.0614 0.40760.0206 3.3561.27 2.00 4.53 P.t.corbettiI 33 30 0.67060.0265 0.64460.0158 6.0361.81 3.58 6.20 17 0.70660.0224 0.66960.0209 5.8861.17 3.84 6.18 P.t.corbettiII(jacksoni) 22 30 0.57160.0272 0.55560.0196 3.9061.18 2.37 4.40 17 0.56360.0369 0.52860.0262 3.9461.20 2.58 4.82 P.t.sumatrae 16 30 0.49360.0390 0.46560.0240 3.6061.48 2.60 4.10 17 0.49560.0495 0.44860.0310 3.4161.33 2.61 4.29 P.t.tigris 6 30 0.57460.0381 0.52460.0399 3.5061.22 4.94 4.80 17 0.57760.0361 0.57660.0507 3.5361.07 4.45 4.94
Leopard 74 17 0.79060.0174 0.60660.0139 10.7162.31 5.80 11.71
Asian leopard 57 17 0.74760.0255 0.54660.0161 8.1262.06 4.21 8.41 Far Eastern leopard 12 17 0.32460.0557 0.36060.0338 2.6560.86 1.07 3.00
Jaguar 42 17 0.79260.0137 0.65160.0210 8.6761.72 7.69 10.93
Lion
African lion 50 17 0.61060.0348 0.54760.0204 5.0061.75 3.27 5.86
Asian lion 10 17 0.13260.0629 0.12960.0283 1.5060.94 0.23 0.71
Serengeti lion 10 17 0.54460.0404 0.55260.0425 3.8661.41 2.97 4.86
African cheetah 50 17 0.52860.0890 0.44760.0256 4.9262.87 3.14 4.85
Puma
S.A. puma 10 17 0.77460.0247 0.74060.0413 7.0061.76 12.95 11.08
N.A.puma 20 17 0.45760.0657 0.33060.0307 3.0861.00 3.10 4.08
Florida puma 10 17 0.19460.0605 0.20760.0375 1.6760.65 1.21 1.83
Included are values describing genetic variation across 30 microsatellite loci in the six revised tiger subspecies, and a comparison with other Felidae species across the same 17 loci. Estimates of microsatellite diversity are calculated across a subset of microsatellite loci used in previous studies (Driscoll et al. 2002; Uphyrkina et al. 2001; Eizirik et al. 2001).
DOI: 10.1371/journal.pbio.0020442.t007
highest overall microsatellite diversity (Tables 7 and 8). In addition, no microsatellite allele at any locus occurred with a frequency higher than 81%. The observed allele size distribution in P. t. corbetti I was generally continuous for most loci (there were fewer allele size gaps compared to other subspecies), evidence of a fairly stable demographic history,
and alleles found in the other subspecies were almost always a subset of those found inP. t. corbettiI.
Additional sampling of modern and/or historic samples could reveal additional structure (putative subspecies) in the P. t. corbetti I region (see Figure 1), as there were several microsatellite loci out of Hardy-Weinberg equilibrium, and
Table 8.Diagnostic Characters and Habitat of the Six Phylogeographic Tiger Groups or Subspecies
Subspecies Habitat mtDNA DRBAlleles
(Number of Tigers Tested)
Microsatellites
Number of mtDNA Diagnostic Sitesa
Number of mtDNA Subspecies-Specific Haplotypes
Unique Alleles /Number of Alleles (Percent)
Subspecies-Specific Microsatellite Alleles
P. t. altaica Temperate deciduous forest 4 1 A (5) 3/104 (2.9%) FCA77–160, FCA176–200, FCA441–138
P. t. amoyensis Subtropic/temperate forestb 7 1 ND 1/66 (1.5%) FCA126–142 P. t. corbettiI Mixed moist deciduous forest 3 4 A (2) 19/130 (14.6%) FCA005–160, FCA032–190, FCA043–115, 125, FCA044–110, FCA069–97, 99, FCA077–152,
FCA091–128, 130, 132, FCA123–140,
FCA139–146, FCA212–154, FCA220–208, FCA229–164, FCA290–224, FCA293–208, FCA391–224 P. t. corbettiII
(P. t. jacksoni)
Evergreen dipterocarp rain forest
0 5 B, C, D (2) 3/108 (2.8%) FCA008–132, 148,
FCA096–203 P. t. sumatrae Moist tropical forest 2 8 E, F ,G (11) 11/108 (10.2%) FCA032–204, FCA044–126, FCA077–156, FCA129–175, FCA176–218, FCA211–120, FCA229–160, FCA304–125, 139, FCA391–206, 214 P. t. tigris Dry tropical forest/grassland 3 6 A (1) 12/106 (11.3%) FCA005–140, 162,
FCA096–201, FCA126–128, FCA161–173, 187, FCA212–142, FCA229–174, FCA290–226, FCA304–121, FCA310–133, FCA441–148
aSee Table 2 for mtDNA nucleotide coordinates. bPossibly extinct in the wild (Tilson et al. 2004).
ND, no data.
DOI: 10.1371/journal.pbio.0020442.t008
the Bayesian population structure analysis identified possible substructure within P. t. corbetti I (Figure S2). The ultimate classification of tigers of the southern China and northern Indochina region is further complicated by the poor definition of the geographic boundary betweenP. t. corbettiI and P. t. amoyensis, and because the South China tiger subspecies is represented only by captive-born animals of imprecise origin. One of the two phylogenetic lineages in this captive population (Pti-217, Pti-218, and Pti-222) was indis-tinguishable from northern Indochinese tigers (see Figures 3 and 4), perhaps as a consequence of introgression of the northern Indochinese tigers into the Chinese captive pop-ulation or a more-northern distribution of the Indochinese tigers than had previously been recognized. A comprehensive morphological and genetic assessment of the captive pop-ulation (around 50 individuals) (Tilson et al. 2004), of historic samples, and of additional wild tigers from southern China, in the context of subspecies patterns seen here would be useful to resolve remaining uncertainties and to inform in situ and ex situ management strategies.
By contrast, the other subspecies delineations are better defined. To the north, Amur tigers, presently an isolated population of fewer than 500 individuals, are confined almost entirely to the Russian Far East (Matyushkin et al. 1999). They display low genetic diversity in comparison to other subspecies, with a single mtDNA haplotype that is likely derived fromP. t. corbettiI Indochinese tigers (Figure 3A). The Amur tiger genetic variability may have been reduced during a post-ice age colonization of the region around 9,000 y ago and/or during the early 20th century when an estimated 20– 30 tigers survived intense human persecution (Kaplanov 1948). In Indochina, the genetic distinction between P. t. corbettiI andP. t. corbettiII (pairwise mtDNA Fst= 0.797 and microsatellite Rst = 0.225, p , 0.0001; P. t. corbetti II is characterized by three unique microsatellite alleles and five subspecies-specific mtDNA haplotypes [Table 8]) supports the hypothesis that the Isthmus of Kra has been an ecological barrier restricting gene flow between tigers in Malaya Peninsula and mainland Southeast Asia. Previous biogeog-raphy studies have placed numerous species and subspecies boundaries of mammals (Corbett and Hill 1993; Tosi et al. 2002), birds (Hughes et al. 2003), and plants (Woodruff 2003) near the Isthmus of Kra, making it a significant biogeo-graphical transition between Indochina and Sundaic regions. The isolation of Sumatran tigers from mainland popula-tions is supported by multiple unique characters, including two diagnostic mtDNA nucleotide sites, eight mtDNA haplotypes, and 11 (of 108) unique microsatellite alleles (Table 8). Cracraft et al. (1998) and Hendrickson et al. (2000) also described genetic variation distinguishing Sumatran tigers from other tiger subspecies. The relatively high genetic variability and phylogenetic distinctiveness of Sumatran tigers suggest a historically large effective population size followed by highly restricted gene flow between the island and other populations.
The Bengal tigers are defined by three distinct mitochon-drial nucleotide sites and 12 unique microsatellite alleles. The pattern of genetic variation in the Bengal tiger corresponds to the premise that tigers arrived in India approximately 12,000 y ago (Kitchener and Dugmore 2000). This recent history of tigers in the Indian subcontinent is consistent with the lack of tiger fossils from India prior to the late Pleistocene
and the absence of tigers from Sri Lanka, which was separated from the subcontinent by rising sea levels in the early Holocene. Similar biogeographical boundaries to those separating the six tiger subspecies have been proposed in other species including leopard (Uphyrkina et al. 2001), Asian elephant (Fleischer et al. 2001), and rodents (Gorog et al. 2004), but warrant further study to determine their impor-tance as recent barriers to gene flow for large mammals in Asia.
Our results have several implications for tiger conserva-tion. Management strategies for the tiger, both in situ and ex situ, have been historically influenced by perceptions of its geographical variation and subspecific taxonomy (Maguire and Lacy 1990; Seidensticker et al. 1999), and several captive tiger breeding programs have attempted to maintain pure-bred lines (Foose 1987; Maguire and Lacy 1990). Our data suggest, however, that while supporting and refining most existing (and extant) tiger subspecies designations, there is additional substructure within some subspecies that should be considered when formulating management strategies for captive animals or when considering the maintenance of sufficiently large and interconnected wild populations. Specifically, the distinctiveness of tigers from Malayan Peninsula is comparable to differences among other recog-nized and separately managed subspecies. To be consistent, the Malayan subspecies should also be managed as such unless inbreeding depression has become an issue due to declined genetic variability. Since the current type specimen forP. t. corbettiis located in northern Vietnam (Mazak 1968), and no prior name has been given to the southern populations, we propose the newly defined tiger subspecies from Malayan Peninsula be designatedP. t. jacksoni,to honor the contribu-tions of Peter Jackson, the former Chair of the the World Conservation Union (IUCN) Cat Specialist Group, who tirelessly labored for more than 40 y on behalf of tiger conservation. We designate the type specimen of the Malayan tigers to Pti-163 from the Zoo Melaka, Malaysia, and the taxonomic diagnosis will be described elsewhere. The present status of tigers from northern Indochina and from Malayan Peninsula is uncertain, urging more extensive study and conservation.
Our results also show that, although modern tigers have a relatively young history, ecological, demographic, and bio-geographic factors have led to recognizable subdivisions among otherwise closely related populations. We therefore might expect that more extensive geographic sampling would reveal additional phylogenetic divisions among populations, especially in the Indian Subcontinent and the Indochina bioregions, or alternatively, would blur the apparent phylo-genetic subdivisions and reveal a clinal distribution of phylo-genetic variation across different subspecies. Further sampling of modern and historic specimens will also help clarify whether the patterns we have observed are attributable to the recent substantial population decline throughout the range in tigers, or whether the observed differentiations among tigers occurred earlier.
Materials and Methods
Samples. A total of 134 tiger individuals were sampled throughout the distribution range (see Figure 1 and Table 3). Of these, 100 were verified as either wild-born from a specific geographic locale or captive-born from geographically verified wild-born parents. An