Crabs?
Thi Hong Hanh Bui, Shing Yip Lee*
Australian Rivers Institute and School of Environment, Griffith University Gold Coast Campus, Southport, Qld, Australia
Abstract
In tropical mangroves, brachyuran crabs have been observed to consume high percentages of leaf litter production. However, questions concerning their ability to assimilate this low-quality food remain, as stable isotope analysis of C and N does not seem to support assimilation. Individuals of the common eastern Australian mangrove grapsid Parasesarma erythodactyla feeding on a mangrove leaf litter or mangrove+microphytobenthos diet developed a significantly higher
hepatosomatic index than those with access to only sediment. Lipid biomarker analysis and feeding experiments using13C and15N-enriched mangrove leaf litter confirmed rapid assimilation of mangrove C and N byP. erythodactyla. Eight-week feeding experiments utilizing three food types (mangrove leaf litter, microphytobenthos and prawn muscle) established different food-specific trophic discrimination values (Dd13C andDd15N) that are significantly different from those commonly applied to mixing model calculations. The meanDd13C(crab-mangrove)of+5.45%was close to the mean and median literature
values for grapsid-mangrove pairs in 29 past studies (+5.261.8% and +5.6%, respectively), suggesting that this large discrimination may generally be characteristic of detritivorous grapsid crabs. Solutions from the IsoConc mixing model using our determined trophic discrimination values suggest significantly higher and dominant contributions of mangrove C to the diet than those based on the global mean trophic discrimination values. Our results reaffirm the physiological capacity for and important mediating role of grapsid crabs in processing low-quality mangrove C in tropical estuaries, and caution against the use of global trophic discrimination values in stable isotope analysis of food-web data, especially those involving detritivores. While recent studies have questioned the trophic significance of mangrove detritus in coastal food chains, the contribution of this productive carbon source needs to be re-assessed in the light of these data.
Citation:Bui THH, Lee SY (2014) Does ‘You Are What You Eat’ Apply to Mangrove Grapsid Crabs? PLoS ONE 9(2): e89074. doi:10.1371/journal.pone.0089074
Editor:Craig A. Layman, North Carolina State University, United States of America
ReceivedDecember 24, 2013;AcceptedJanuary 13, 2014;PublishedFebruary 13, 2014
Copyright:ß2014 Bui, Lee. This is an open-access article distributed under the terms of the Creative Commons Attribution License, which permits unrestricted use, distribution, and reproduction in any medium, provided the original author and source are credited.
Funding:THHB is supported by an Australian Endeavour Postgraduate Award. The funders had no role in study design, data collection and analysis, decision to publish, or preparation of the manuscript.
Competing Interests:The authors have declared that no competing interests exist.
* E-mail: [email protected]
Introduction
Despite their limited global areal extent ofca.1.526105km2[1– 2], tropical mangrove forests are amongst the most productive ecosystems on earth [3–4]. Early paradigms on estuarine carbon dynamics emphasized the ‘outwelling’ role of mangroves and saltmarshes in subsidising nearshore consumers with organic matter [5–7], but the spatial extent and the trophic significance of exported vascular plant detritus in nearshore food webs seem to be overstated [4,8]. The generally low nutritive value (e.g. high C/N ratio) and recalcitrant nature (e.g. high structural carbon content) of mangrove and saltmarsh plant detritus has prompted recent suggestions that this production may be consumed or mineralized minimally (eg. [9–10]), thus promoting storage. Other reports argued that even when this detritus is consumed, it may lead to trophic ‘cul-de-sacs’ [11].
The notion that mangrove detritus contributes little to nearshore consumer food chains is apparently supported by the stable isotope tracer analysis data. Numerous studies, using stable isotope analysis of carbon, nitrogen and occasionally sulphur, covering a range of mangrove-dominated systems, have yielded consumer signatures deemed too distant (e.g..+5%ford13
C) to directly relate consumer biomass to assimilated mangrove detritus material (e.g. [12–14]; review in [15]). Alternatively, more 13 C-enriched producers such as the microphytobenthos (MPB),
seagrass and phytoplankton have been suggested as the primary C sources. This notion also corroborates with the paradigm that algal C is more easily utilizable by animals compared to mangrove leaf litter (with a low N content but high concentration of secondary metabolites).
its eventual utilization by other estuarine consumers [20]. This role is, however, dependent on the crabs’ ability to effectively digest and assimilate the low-quality mangrove leaf litter diet.
Recently, the nutritional dependence of mangrove grapsids on mangrove leaf litter, and thus implicitly their role in acting as initial processors of mangrove organic production, has been questioned. Firstly, the physiological mechanism that allows profitable utilization of this poor food source is unknown. Secondly, consumption of mangrove leaf litter, often fresh and without microbial enrichment, by the grapsids is considered trophically non-viable and there needs to be substantial additional nutrient sources particularly for N [27–28]. Finally, stable isotope analysis of the leaf litter-crab link apparently fails to produce data that support the dominant contribution of mangrove C in the grapsids’ diet. For example, recently Mazumder and Saintilan [9] claimed that mangrove (Avicennia marina) leaf litter could not be an important food source for the temperate grapsid crabsHelograpsus haswellianusandParasesarma erythodactylain Australia, as thed13C of the crabs were too high to indicate substantial utilization of this food item. There is a consistent large difference between thed13
C of mangrove leaf litter and those of consumers potentially benefitting from the mangrove detritus-based food chain, e.g. [15,27,29]. It should be noted, however, that the interpretation of stable isotope data (particularlyd13C andd15N) are based on a few assumptions, such as a constant trophic discrimination factor between consumer and food. In most analyses, values of,+1% and,+3%have been used for generating solutions from mixing models relating mangrove detritus and crab biomass d13C and d15
N values, respectively. The applicability of these values generated from a wide range of consumer-food combinations to explaining specific trophic paths such as the grapsid crab-mangrove detritus link has not been tested. Significant deviations from these assumed values would have strong impacts on the interpretation of the stable isotope data, and thus the importance of the trophic links concerned.
In order to reconcile the observation that mangrove grapsids do consume large quantities of mangrove leaf litter, and the apparently contradictory stable isotope data related to this important link in mangrove food chains, we conducted a series of feeding experiments utilizing naturally abundant and isotopi-cally enriched substrates to (1) investigate the ability of the mangrove grapsidP. erythodactyla, a common grapsid crab of the subtropical mangroves in eastern Australia, to directly utilize leaf litter of Avicennia marina; (2) empirically determine the trophic discrimination values of its potential food sources, namely mangrove leaves, MPB, and animal tissue; (3) estimate and compare diet compositions predicted from IsoConc mixing modelling based on the commonly assumed and our determined trophic discrimination values, and (4) discuss the implication of our results for the evaluation of the mangrove detritus food chain.
Methods
No ethics approval is required for this study according to current Australian law. The species used (Parasesarma erythodactyla) is not an endangered or a protected species. No specific permission is required for collection of grapsid crabs from the study location.
Collection of Crabs, Mangrove Leaf Litter and Sediment Intermoult male individuals ofP. erythodactylaof carapace width ranging from 11 to 20 mm were collected from an A. marina -dominated intertidal mangrove forest at Tallebudgera Creek, southeast Queensland, Australia. Crabs that were analyzed later as ‘field’ samples (hereafter referred as T0 sampling event) were
rinsed with distilled water and frozen immediately upon arrival to the laboratory while those for the laboratory experiments were transferred to individual growth compartments (l6w6h=136764 cm, each containing 50 ml of sea water) and starved for two days for acclimation to laboratory condition and gut evacuation.
Freshly senescent mangrove leaves (yellow leaves that were easily detached from the trees), MPB, and sediment were collected from the same sites where the crabs were caught. Leaves were soaked in seawater for 24 h to remove feeding deterrents, e.g. tannin, before being offered to crabs. Sediments were collected by scraping the top 1 cm surface sediment, homogenized with a shovel before adding into experimental tanks as an organic substrate in experiment 1 or used for MBP isolation.
Extraction of MPB from sediment. MPB was isolated from sediment by density gradient centrifugation in colloidal silica. Sediment was spread to ca. 3 cm depth in plastic trays (4563065
cm), which were exposed to white fluorescent light for 16 h to mediate vertical migration of MBP to the surface of the sediment. The top ca. 0.5 cm sediment was then scrapped, suspended in seawater, and then sieved through a 63mm to remove large detritus and nematodes. The filtrate was centrifuged at 4400 rpm for 5 min. Supernatant was poured off. Pellets were resuspended in left over supernatant, divided into 5 ml aliquots in individual centrifuge tubes, mixed with 40 ml of 30% Ludox colloidal silica (Sigma), and centrifuged at 4400 rpm for 5 min. The distinct layer of MPB, which was confirmed by microscopic examination, was collected, and washed with distilled water to remove Ludox before collected on pre-combusted glass filters. Each filter was loaded with the MPB suspension until it was clogged to maximize amount of MPB provided as a food source to the crabs in experiment 3. MPB containing filters were stored at220uC until used. Aliquots of MPB were dried at 60uC for stable isotope analysis.
Preparation of 13C and 15N enriched mangrove
leaves. Thirty Avicennia seedlings each with 4–6 leaves, were planted in two glass chambers (h6l6w = 40650630 cm) contain-ing 10 cm deep sediment. Seedlcontain-ings were grown at 24uC, under lighting from fluorescent tubes. The seedlings were labelled with 13
C and15N using methods modified from Bromandet al.[30] and Unsickeret al.[31]. Growth chambers were left open for two days, allowing water to evaporate from the top sediment before 1 ml of 61.2 mM15NH4Cl (99 atom%15N, Cambridge Isotope Labora-tories) was injected at each of the 15 injection points evenly distributed in each chamber. Injection was done at the depth of 2 cm from sediment surface using a 1 ml syringe. The top sediment was then re-wetted with distilled water. For13C labelling, a bottle containing 25 ml of 1 M NaH13CO3 (99 atom%
13 C, Cambridge Isotope Laboratories) was placed in each chamber before it was tightly sealed. One ml of 1 M HCl was added to the enriched bicarbonate bottle via a glass pipette passing through the top of the chamber every two days for 45 days to generate13CO2
in situ. A small fan (d = 8 cm) was turned on for 30 min after the addition of acid to facilitate even distribution of13CO2within the growth chamber.
Experiment 1. Condition of Crabs
treatment were filled with 3 cm sand. Sand was collected from the foreshore of a local beach, cleared of organic debris by elutriation before adding into the tanks. It is assumed that the low organic matter oceanic sand would serve only as a substrate but not a significant source of carbon for the crabs (organic contents of the sediment and sand used in this experiment were 5.2760.33% and 0.8060.02%, respectively). Crabs were maintained at temperature of 24uC and a photoperiod of 16 h light : 8 h dark. A recirculation water supply system was set up for each tank such that seawater of salinity of 25 (PSU) was supplied to each tank according to a semi-diurnal tidal cycle. The reservoir water was replaced with fresh sea water at the end of every week.
Crabs in the L and L+S treatments were provided oneAvicennia
leaf per day while those in the S treatment were not. Uneaten feed was removed from the tanks the following morning. Survival of crabs in the three treatments was recorded every day. After 63 days, all crabs were collected, rinsed with distilled water, and stored at 220uC until dissection of muscle and hepatopancreas tissues from each individual. These tissues and the remaining parts of each crab were freeze-dried and weighed. Hepatosomatic index (HSI) of each crab was determined as the percentage of the dry weight of the hepatopancreas to the rest of the body [32]. Freeze-dried muscle tissues were used for fatty acid analysis.
Experiment 2. Leaf Litter Assimilation
Another batch of crabs was fed dual 13C and 15N enriched mangrove leaves for four weeks and temporal changes in stable isotope values of their muscle tissue were studied. Crabs were randomly assigned into the treatment group (32 crabs) and the control group (8 crabs), each were allocated to individual rearing compartments (136764 cm, containing 50 ml of seawater). Crabs
in the treatment and control group were provided one enriched and one non-enrichedA. marinaleaf every three days, respectively. Potential stable isotope enrichment in crab tissue due to the utilization of water containing leachate from enriched leaves was assessed by soaking one enriched leaf in each control compart-ment. This leaf was separated from the crab by two layers of plastic sheets, which had small holes at alternate positions at the bottom, allowing free movement of water across the sheets but preventing the crabs from direct access to the leaf. Enriched leaves in the control compartments were also replaced by fresh ones every three days. Crabs were maintained at temperature of 24uC and a photoperiod of 16 h light: 8 h dark. Water in the rearing compartments was changed once every week.
Eight crabs fed on the enriched-leaf diet were randomly sampled every week for four weeks (these sampling events hereafter are referred to as T1, T2, T3 and T4, respectively). At each sampling time, feed was removed from rearing compart-ments; crabs were then left to evacuate their gut for 24 h, rinsed with distilled water, and stored at220uC until dissection. Control crabs were sampled similarly at the end of week 4. Crabs were dissected to collect muscle tissue, which was then dried at 60uC for 24 h. Eight ‘field’ crabs were also dissected to collect samples for T0 sampling event. To calculate assimilation efficiency, faeces were collected twice daily, dried at 60uC for 24 h. Faeces of individual crabs were pooled together at the end of the experiment. Dried muscle tissue and faeces from individual crabs were used for stable isotope analysis.
Experiment 3. Trophic Discrimination Values of Potential Food Sources
Carbon and nitrogen trophic discrimination values (Dd13 C and Dd15N, respectively) in P. erythodactyla for three common food sources (mangrove leaf litter, microphytobenthos and animal food)
were determined by a third feeding experiment. Crabs were fed freshly senescentA. marina leaves, MPB or frozen prawn muscle (Metapenaeus spp.) for eight weeks. Previously work on similar animals (S.Y. Lee, unpublished data) suggests that eight weeks is usually sufficient for tissue turnover to result in isotopic equilibrium with the diet. The same feeding experiment was conducted twice (in 2011 and 2012). Twenty crabs were used in the first experiment, half of which was fed prawn while the other half was offered mangrove leaves. In the latter experiment, 40 crabs were randomly assigned into two groups of 20 individuals each, which had either MPB or mangrove leaf diet. Crabs were maintained in individual rearing compartments (136764 cm,
containing 50 ml of seawater). Feed was provided ad libitum. Uneaten glass filter containing MPB and leaves were replaced with fresh ones the next morning while unconsumed prawns were removed at the end of the day.
At the end of week 1, 3, 5 and 8 (hereafter referred to as T1, T3, T5 and T8, respectively), five crabs were samples from each diet in the MPB-feeding experiment while the numbers of crabs sampled in the prawn-feeding experiment were 1, 2, 2 and 5, respectively. These experimental crabs and five ‘field’ crabs (T0) of each feeding experiments were treated similarly with those sampled in experiment 2.
Stable isotope analysis. Carbon and nitrogen stable isotopic values of muscle tissue and faeces of crabs,Avicennialeaves, MPB, prawn used as food sources were determined using a Europa GSL (Sercon) elemental analyzer coupled to a Hydra 20–22 (Sercon) isotope ratio mass spectrometer in continuous flow mode. Samples are weighed in tin capsules (about 1 mg for animal sample and 4 mg for MPB and plant samples). PeeDee Belemnite and atmospheric air were used as standards for C and N, respectively. Stable isotope values are reported ind-notation (%), i.e.d13C or d15N = (Rsample/Rstandard21)61000, where R is C13/C12 and
N15/N14 ratios for carbon and nitrogen analyses, respectively. The analysis also provided %C and %N of the samples, from which assimilation efficiency (A) was determined by the following equation:
A~ F{E
1{E
ð Þ|F|100 ½33
where F = fraction of carbon or nitrogen in feed; and E = fraction of carbon or nitrogen in faeces.
Fatty acid analysis. Freeze-dried tissues were ground into powder using a mortar and pestle. Lipid extraction was performed by the one-step method of Abdulkadir and Tsuchiya [34]. In brief, each sample was mixed with 5 ml of hexane and 2 ml of 14% BF3 in methanol in a 50 ml glass tube. The tube was heated under reflux on a hot plate at 100uC for 120 min and continuously stirred using a magnetic stirrer. The tube was left to cool to room temperature before 1 ml of hexane and 2 ml of distilled water were added. The tube was then vortexed for 1 min and then centrifuged at 2500 rpm for 3 min. The upper phase was transferred into a fresh tube using a Pasteur pipette. Fatty acid methyl esters (FAMEs) were separated from the extracted FA mix by thin layer chromatography following the method of Meziane and Tsuchiya [35].
min, held for 3 min, then increased to 210uC at 3uC/min, held for 17 min, then increased to 240uC at 5uC/min and held for 10 min. The resulting peaks were identified by comparing their retention times to those of standard FAMEs (Supelco).
Percentage contribution to total FA of FA markers of mangroves (18:2v6, 18:3v3, and the long-chain FA 26:0, 28:0, 30:0), branched FAs makers of bacteria (15:0 iso, 15:0 ant, 16:0 iso, 16:0 ant, 17:0 iso, 17:0 ant), and MPB (20:5v3, a diatom marker) in the crab muscle tissues were determined. These FA markers were selected based on Meziane and Tsuchiya [35] and Hallet al.[36], who used FA analysis to investigate the transfer of mangrove organic matter inP. erythodactyla.
Data Analysis
One-way ANOVA (a= 0.05) was used for the comparisons of HSI, the abundance of FA biomarkers, temporal changes in stable isotope values of crabs fed enriched mangrove leaves. Tests for normality (Shapiro-Wilk’s test) and homogeneity of variance (Levene’s test) were performed to check if assumptions of ANOVA were met before analysis. The Kruskal-Wallis H test was used instead of one-way ANOVA when these assumptions were violated. If significant ANOVA or Kruskal-Wallis H test results were obtained, statistical difference between specific treatments were determined by applying Tukey’s Honestly Significant Difference (HSD) post-hoc test or Mann-Whitney U test, respectively.
FA profiles of crabs of the three treatments in the leaf litter utilization study were compared using multivariate analyses with PRIMER version 6 software. Exploratory multi-dimensional scaling (MDS) was conducted based on similarity data built using the Bray-Curtis similarity co-efficient. No transformations were used to avoid giving artificial weight to FAs that only have minor contributions to FA profiles. Statistical differences between treatments were determined using ANOSIM and similarities between them were estimated using the SIMPER function.
Determination of trophic discrimination values. Change in isotopic value of the consumers in response to diet shift can be modelled as a function of time as
dt~dfzdi{df|e{kt
wheredtis the isotopic value of the tissue at time t (in days);dfis the isotopic value when consumer reaches isotopic equilibrium with the new diet;didenotes isotopic composition before the diet shift; and k is the turnover rate of the isotope of interest in the tested tissue [37]. This exponential model was fit to the C and N isotopic data of each feeding experiment to determine the isotopic composition of the muscle at equilibrium with the tested diet (df) by least square method using SigmaPlot 10.0. Model fitting was performed with thediterm was fixed to the mean isotopic values of the T0 samples. Food specific trophic discrimination factors (Dd13
C orDd15
N) were then calculated as the difference between dfand the mean isotopic value of the food.
Assessing diet composition by the IsoConc mixing model. Using the trophic discrimination values determined from experiment 3, the stable isotope values and the C and N concentrations of the tested food, the contribution of these food sources to the crabs’ diet was assessed using the IsoConc mixing model [38]. To compare the diet compositions predicted based on our determined isotopic discrimination values with those estimated based on the trophic fractionation factors that are commonly used in food web data analysis, IsoConc mixing model was also run using the mean trophic discrimination values reported for aquatic
consumers of 0.5% for d13C and 2.9% for d15N [39] with the same data set for other parameters.
Results
Experiment 1. Condition of Crabs
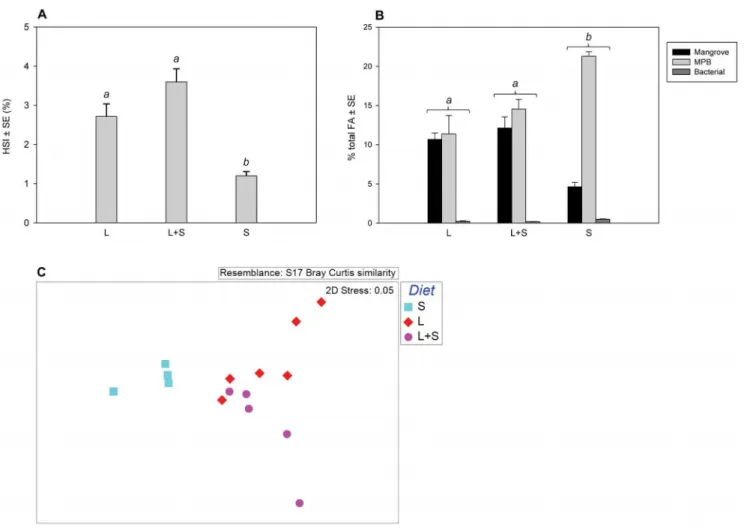
All six crabs on the sole mangrove leaf diet (the L treatment) survived through the nine-week experiment. Number of survivors in the L+S treatment, in which crabs had access to both mangrove leave and organic matter from the sediment, and the S treatment, where sediment was the only food source, were five and four, respectively. The type of available food sources significantly affected the hepatosomatic index of the crabs (one-way ANOVA, p = 0.001). Post-hoc analysis showed that there was no significant difference between the L and L+S crabs (Tukey’s HSD, p = 0.116). HSI of the S crabs was, however, significantly lower than those of both the L (p,0.001) and L+S treatments (p = 0.009) (Fig. 1A).
Fatty acid analysis showed that there were significant differences in the proportions of mangrove (one-way ANOVA, p = 0.001), bacterial (one-way ANOVA, p = 0.002), and MPB (Kruskal-Wallis H, p = 0.014) FA biomarkers to total FA in crab muscle tissue between treatments. Proportions of all three FA biomarkers were not significantly different in crabs which had access to mangrove leaves in the presence (the L+S treatment) or absence (the L treatment) of additional organic matter from the sediment (Tukey’s HSD post-hoc test, p = 0.58 for mangrove, p = 0.98 for bacterial, and Mann-Whitney U test, p = 0.46 for MPB markers). Crabs in the S treatment had significantly lower percentage of mangrove FA biomarker but significantly higher proportions of MPB and bacterial biomarkers (p,0.05) than those offered mangrove leaves (Fig. 1B).
A similar trend was also obtained when the fatty acid profiles (i.e. the collections of all FA detected from the muscle tissue) of crabs in the three treatments were compared by ANOSIM analysis. There were no significant differences in the profiles of the L and the L+S crabs (p = 0.08). The FA profiles of crabs of the S treatment, however, were significantly different from those of the L and L+S treatments (p#0.001). In addition, SIMPER analysis indicated that similarity between the S treatment and the other two treatments (,80% similarity) was lower than that between the L and L+S treatments (85% similarity). This confirms the observed separation of the S treatment from the L and L+S treatments on the MDS plot (Fig. 1C).
Experiment 2. Leaf Litter Assimilation
Muscle tissues of crabs fed the enriched mangrove leaves were clearly enriched in both13C and15N than those of the field crabs. After only one week on the enriched-leaf diet (T1), stable isotope values of the crabs were significantly higher than those of the field crabs (T0, Mann-Whitney U tests, p = 0.006 for d13
C and p = 0.009 ford15
N). The T4 crabs were significantly enriched in both13C and15N than crabs of the T1 and T2 sampling events but not significantly different from the T3 crabs (Fig. 2), showing that the enrichment was slowing down by the end of the feeding experiment. Meand13
C andd15
Experiment 3. Trophic Discrimination Values of the Potential Food Sources
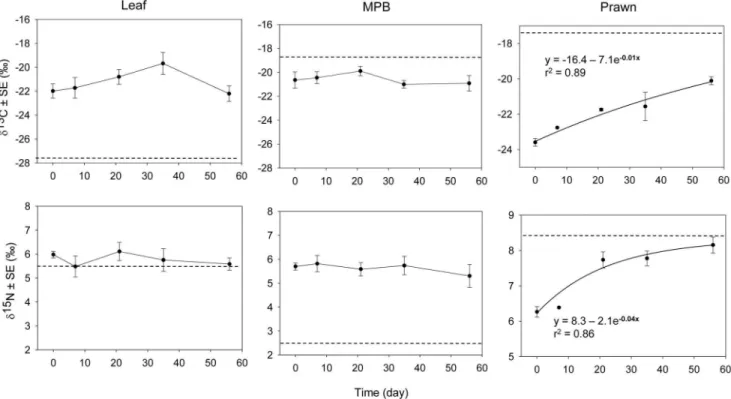
There are no obvious temporal changes in eitherd13 C ord15
N in crabs fed mangrove leaves and MPB (One-way ANOVA, p.
0.05, Fig. 3). The exponential equation predicted isotopic compositions of the consumer in response to diet shift, hence, was not fitted to these data. C and N isotopic profiles of crabs on the prawn-diet, however, showed a good fit with the model (p,
0.001, r2= 0.89 and 0.86, respectively).dfvalues were estimated to be216.4%(p = 0.037) and+8.3%(p,0.01) ford13
C andd15 N, respectively.
Table 1 presents the trophic discrimination values (Dd13 C and Dd15
N) determined for each food item.Dd13
C andDd15
N for the prawn diet were calculated from the differences between the respective dfvalues estimated from model fitting and the mean stable isotope values of the prawn muscle tissue. For the mangrove leaves and MPB, trophic discrimination factors were determined as the differences between the mean stable isotope values of the final sampling event and those of the food (this calculation will be justified in the discussion).
Assessing Diet Composition by the IsoConc Mixing Model
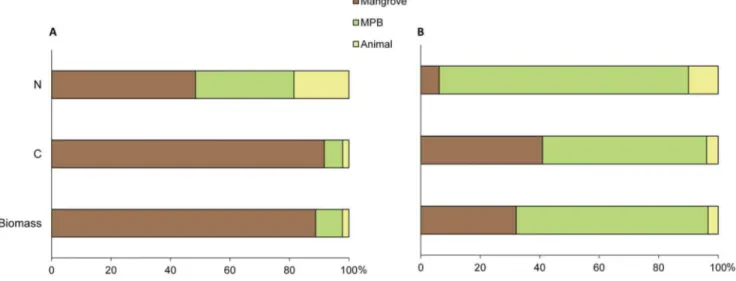
Results of IsoConc modelling using our trophic discrimination values (Table 1) show that mangrove leaf is the primary contributor to the diet of P. erythodactyla in terms of biomass (89%) and C (92%) but less important in term of N (48%, Fig. 4A). On the contrary, animal tissue makes up a minor proportion of the biomass (2%) and C intake (2%) but has a significant contribution to N (19%). Modelling based on the global mean trophic fractionation values reported for aquatic consumers ([39]), however, suggests that MPB but not the mangrove leaf would play a key role in the nutrition of this crab. In this scenario, mangrove litter was estimated to account for only 32, 41 and 6% of the biomass, C and N intakes, respectively (Fig. 4B).
Discussion
The Trophic Role of Mangrove Leaf Litter
Results of experiment 1 suggest that mangrove leaf litter was the ‘staple’ food ofP. erythodactylawhile the sediment organic matter sources have a minor contribution to its diet. Crabs on the mangrove litter only diet had comparable fitness and fatty acid profiles to those that had access to additional food sources Figure 1. Influence of available organic matter on the fitness ofP. erythodactyla.Crabs were offered mangrove leaves only (L, n = 6), mangrove leaves and sediment (L+S, n = 5) or sediment only (S, n = 4) for 63 days. Means HSI (A) and % to total FA in muscle tissue of FA biomarkers of the mangrove leaf litter, bacteria and MPB (B) were compared by one-way ANOVA or Kruskal-Wallis H non-parametric tests. Means marked with different letters are significantly different (Tukey’s HSD or Mann-Whitney U, p,0.05). Similarity of FA profiles of crabs in the three treatments was compared by ANOSIM and graphically presented in a MDS plot (C).
available from the sediment, such as benthic bacteria, micro-algae or aged detritus. Feeding on the sediment alone, on the contrary, may reduce the fitness of the crabs as indicated by the significant lower HSI (a proxy for fitness) of crabs in this treatment (Fig. 1). We were able to maintainP. erythodactylafor more than six months on the sole mangrove leaf diet in the laboratory with a good number of them moulted during that time (unpublished data), suggesting that these crabs had access to sufficient food supply [40]. Bacteria and benthic microalgae in the sediment may provide some subsidy to the N deficit leaf diet, but the crabs are not likely to depend strongly on this source as has been suggested from some studies [9,28]. From the analysis of C and N balance in the grapsid crabNeoepisesarma versicolour, Thongtham and Kristen-sen [41] also reported that mangrove C was the major C source of this crab while sediment bacteria and MPB, due to their low availability, may have only a minor contribution to the crab’s N requirement. In addition, leaf tissues were the dominant food items found in the gut of other mangrove grapsids such as
Chiromanthes onychophorum [22], N. versicolour, N. mederi [23],Aratus pisonii[21].
Our feeding experiment using d13
C and d15
N enriched leaf (Fig. 2) provides direct evidence of the assimilation of mangrove organic matter inP. erythodactyla.In previous studies on the feeding ecology of mangrove grapsids, the contribution of mangrove leaf
litter in their diets has been demonstrated from observations of the crabs’ foraging activities on leaf litter [19,42], the presence of leaf tissues in the stomach contents [22–23], the growth and survival of crabs in long-term feeding experiments [43], and the transfer of terrestrial plant biomarkers such as long-chain fatty acids to the animals [36]. The lack of convincing direct evidence showing the assimilation of mangrove organic matter in these detritivores is obviously one of the reasons why the role of mangrove leaf litter in their diets has been questioned in some recent studies [9,28]. We also showed thatP. erythodactylaassimilated C and N fromA. marina
at efficiencies (36% for C and 57% for N) comparable to those reported forNeosarmatium smithifed onCeriops tagalleaf detritus [44] and N. versicolour consuming brown (for % C assimilation) and green (for % N assimilation) leaves ofRhizophora apiculata[41].
The Change of Isotope Compositions in Experiment 3 When a new diet is introduced, isotopic compositions of the consumer will shift gradually toward those of the diet in time
following an exponential function, i.e.dt~dfz di{d
f
|e{kt
[37,45–46]. The isotope values of crabs on the prawn-diet showed a similar trend (Fig. 3) and fitted well to the proposed exponential model. Asymptotic values of the exponential curves (i.e. thedfterm of the exponential function) were, therefore, considered as the Figure 2. Temporal changes ind13C andd15N values ofP. erythodactylafed enriched mangrove leaves.Shown in the plot are the mean d13C andd15N values of crabs sampled at the start of the feeding experiment (T0, n = 7), at the end of every week (T1–T4, n = 8 for each sampling event), and those in the control (C, open circle, n = 8). Data points marked with different italic letters are significantly different (Mann-Whitney U tests, p,0.05).
expected isotope values of the crab muscle tissue when it reached equilibrium with the prawn food, which was subsequently used in the calculation of trophic discrimination values (Table 1). It must be noted that there was only a small difference betweendf15
N (+
8.3%) and the meand15N (+8.2%) of the samples collected at the final sampling event (T8), while the difference ind13C was larger,
216.4 vs. 220.1%, respectively. This suggests thatd15 N of the muscle had almost approached equilibrium with the diet within the time frame of the experiment but C isotope composition may require a longer feeding time to reach isotopic equilibrium. A similar response resulting from diet shift was reported in the mysid
Mysis mixta, whosed15N reached equilibrium with theArtemiaused as feed about 8–9 weeks after the diet switch while d13C took longer than 12 weeks to attain isotopic equilibrium [47].
In contrast to the prawn-feeding treatment, isotopic composi-tions of crabs on the mangrove leaves and MPB diets stayed more or less constant during the experiment (Fig. 3). Herbon and Nordhaus (2013) also reported the lack of change ind13
C in the sesarmid crabsEpisesarma singaporense andE. versicolorover the 12
week long feeding experiment, in whichR. apiculatasenescent leave was provided as the sole dietary item. Stabilization of isotopic values in our case may due to: 1) no food ingestion and/or assimilation in the tested animals; 2) the time frame of the experiment was not long enough for an isotopic change following diet switch to occur; 3) the tested diet was similar to the natural diet of the animal; or 4) isotopic discrimination values of the tested diet were coincidentally similar to the difference in stable isotope values of the consumer from the diet.
In our feeding experiments, feed consumption in all experi-mental crabs was confirmed by the observation of feed removal and defecation. If food was ingested but not assimilated, the animal would have been on long term starvation. Reduction in food consumption and starvation often cause enrichment ind15
N of the animals [48–51]. The increase in the 15N/14N ratio is probably due to the same mechanism that causes trophic discrimination of nitrogen: the animals metabolized their own proteins, continuously excreted14N without replenishment from the diet, and thus progressively become enriched in15N [52]. The Figure 3.d13C andd15N profiles of crabs on the mangrove leaf, MPB, and prawn diet.Temporal changes in stable isotope values of the muscle tissues of crabs fed the potential dietary items are indicated by the solid lines. Meand13C andd15N values of the tested food are presented as the broken horizontal lines. For the prawn-feeding data, the best fitting curves are plotted with the respective exponential functions and r2values.
doi:10.1371/journal.pone.0089074.g003
Table 1.Data used in the estimation of relative contributions of mangrove leaf, MPB and animal tissue in the diet ofP. erythodactylausing the IsoConc mixing model.
Food d13C (%) d15N (%) D d13C
(Crab-Food)# D d15N(Crab-Food)# [C] (%) [N] (%)
Mangrove 227.7 +5.5 +5.5 +0.1 45.6 0.8
MPB 219.0 +2.3 21.9 +3.0 30.6 5.4
Prawn 217.5 +8.3 +1.1 0.0 41.1 12.3
#D d13C
lack of change ind15N of the MPB and leaf feeding crabs during the feeding experiments suggests that these animals were not starved, thus ruling out the first explanation.
The results of the prawn-feeding treatment in experiment 3 and the enriched-leaf feeding experiment showed significant enrich-ment of bothd13
C and d15
N after the first three- and one-week periods on the tested diets (Fig. 2 and 3). Eight weeks would therefore be long enough for any change in isotope composition in crabs’ muscle tissue to be detected. Stabilization of stable isotope values throughout the experimental period, therefore, could be attributed to either of the last hypotheses. Under either scenario, difference between the mean stable isotope values of crabs of the last time point from values of the corresponding diet would be close to the true trophic discrimination values for the food of interest (Table 1).
Trophic Discrimination Values
Our determined trophic discrimination values (Table 1) are significantly different from the mean literature values (e.g.[39,53– 54]). These reviews, however, also indicated that variability in Dd13C and Dd15N is significant, i.e. values for specific pairs of consumer-diet vary widely from the global mean values. For example, McCutchan et al.[53] showed that C and N discrimi-nation values reported in literature may span the range of22.7 to
+5.5% and 22.4 to +9.2%, respectively. Variation in trophic discrimination values are attributed to food quality (e.g. lipid and protein contents), tissue type analyzed, feeding mode (e.g. fluid-feeding vs. others), and habitat of consumers [55–57]. However, mechanisms for the discrepancies are obscure.
Our results suggest that the degree of trophic discrimination is specific to particular food-consumer pair, with a variation of.7% for Dd13
C and , 3% for Dd15N between the three food types tested. Large variations in the C and N isotopic discrimination values of different food sources have also been reported in other animals but smaller differences are more common [39]. For examples, locust Locusta migratoria fed with corn and wheat had differences inDd13
C andDd15
N of these dietary items at 5.3% and 2.8%, respectively [58]. In the grasshopper Melanoplus sanguinipes,Dd15N of the corn seedling diet was 2.5%higher than that of the wheat seedling diet [59]. Indeed, trophic discrimination
values may be influenced by food quality. Changes in nitrogen discrimination values in response to variations in protein quality and quantity [60] and C/N ratio [61] of diets have been reported. In addition, selective assimilation and differential routing of nutrient components (i.e. carbohydrates, proteins, lipids), which are expected to differ among the foods tested in our experiment, may also have contributed to the variation in trophic discrimina-tion factors [52,62].
The difference in C13/C12ratio between the mangrove leaf and
P. erythodactyla (5.5%) is significantly higher than the commonly assumed trophic discrimination values used for analysing and interpreting grapsid crab food web studies. However, our Dd13
C(crab-mangrove) is close to C discrimination values recorded forR. apiculata in the grapsid crabsE. singaporense(5.1%) andE.
versicolour (4.1%) [63]. Interestingly, our value also only slightly deviates from the mean (5.2) and median (5.6) of theDd13
C values of the grapsid crab-mangrove leaf potential feeding link reported in the literature (Table 2). Caut et al. [55] reported a negative linear relationship between Dd13
C and food d13
C, which is consistent with the large discrimination value we have recorded for the crab-mangrove leaf feeding relationship. The highDd13
C may be due to selective assimilation of 13C-enriched dietary compo-nents. Carbohydrates such as monosaccharides or cellulose are often more enriched than bulk leaf tissue by,1%[64–66]. This difference could increase in extreme growing conditions, e.g. the leaves ofA. marinagrowing in a hypersaline lagoon demonstrated a difference up to 5% [67]. In leaves of mangroves and other terrestrial plants,d13C values of individual amino acids may vary greatly; variations ofca.20%or more have been recorded [68– 69]. Selective assimilation of carbohydrates or the more enriched amino acids, therefore, would increase the discrimination value. The unusually high Dd13Ccrab-mangrove values probably reflect some interesting and potentially unique features of the digestive physiology of the mangrove grapsid crabs, which invites further investigation. Nonetheless, these differences from the assumed values used in analyzing stable isotope data, whether through direct comparison or mixing model estimations, have significant implications for the results (see below).
Figure 4. Estimation of the diet composition ofP. erythodactylaby the IsoConc mixing model.Percentage contribution of the mangrove leaf, MPB and animal food sources in the crab’s diet were estimated by the IsoConc mixing model using (A) our determined isotopic discrimination values (Table 1) and (B) the global means of trophic discrimination values for aquatic food web of 0.5%for C and 2.9%for N [39].
Implication of the Food-Specific Trophic Discrimination Values for the Mangrove-Grapsid Link
Mixing model calculations using our food-specific isotopic discrimination values suggest a significantly higher contribution of mangrove leaf litter to the crab’s diet compared to results generated using the global mean values reported for aquatic consumers [39]. Increase in the contribution from mangrove leaf litter also means that contribution from the other common sources, such as the MPB, would decrease. The diet composition predicted using the experimentally determined values is in line with reports on the dominant proportion of leaf tissues in the gut contents of the mangrove grapsids. Microalgae and animal tissue remnants were also found, but at much lower fractions [21–23]. Our data question the proposed dominant dietary role of MPB based on modelling results obtained using the global mean trophic discrimination values. Firstly, there is no direct evidence on the consumption of large amount of MPB in mangrove grapsids. In addition, although MPB does offer some apparent nutritional
advantages, such as a higher N content and presumably higher digestibility, the grapsid crabs’ feeding appendages are not morphologically adapted to collecting microscopic food from the sediment. Mangrove grapsids have chelae with pointed ‘finger-tips’ that are more adapted to capturing, tearing and cutting large food items, rather than the spoon-tip feeding chelae found in deposit-feeding species such as the fiddler crabs (Uca spp.). Intertidal crabs that rely on microscopic food (e.g. MPB or the meiofauna) also possess specialised mouth parts or sediment processing behaviour, which are not present in the grapsids, to help efficiently extract food particles from the large volume of sediment that needs to be handled, e.g. ‘floatation feeding’ in soldier crabMictyris longicarpus[70]. Further, the limited growth of microalgae on the poorly lighted mangrove forest floor [71–72] would hardly meet nutritional requirement of the highly abundant grapsid communities if it is their main food item. The strong competition for MPB from ocypodid crabs, such as Heloecius cordiformison sub-tropical eastern Australian coast, which are also
Table 2.Difference ind13C values of the mangrove grapsid and their associated mangrove leaf litter from the literature.
Crab species Mangrove species Crabd13C Mangroved13C D d13C Reference
Australoplax tridentata AM 219.2 227.9 8.7 [80]
AM 22.8 228.8 6 [10]
Episesarma tetragonum AO 224.2 228.6 4.4 [29]
AO/BG/RA/RM 225.2 230.4 5.2 [81]
Episesarma versicolor AO 223.9 228.6 4.7 [29]
AM/AO/EA 225.4 228.6 3.2 [81]
Helice formosensis KC 221.5 228.3 6.8 [82]
Helograpsus haswellianus AM 221.4 227 5.6 [9]
Neoepisesarma versicolor RA 224.3 228.5 4.2 [27]
RM 224.2 229.3 5.1 [9]
Paragrapsus laevis AM 221 227.8 6.8 [9]
Parasesarma asperum AO 225.5 228.6 3.1 [29]
AM/AO/EA 223.8 228.6 4.8 [81]
Parasesarma erythodactyla AM 222 227.8 5.8 [9]
AM 222 227.9 5.9 [80]
AM 223 228.8 5.8 [10]
AM 220.7 227.8 7.1 [83]
Parasesarma plicata KC/AM/AC 224 226.2 2.2 [84]
Parasesarma plicatum AM/AO/EA 219.5 228.6 9.1 [81]
Perisesarma bengalensis AM/AO/EA 225.4 228.6 3.2 [81]
RA/EA/BG 225.7 231.4 5.7 [81]
Perisesarma bidens KC/AM/AC 224.2 226.2 2 [84]
Perisesarma dussumieri AO/BG/RA/RM 227.3 230.4 3.1 [81]
RA/EA/BG 225.8 231.4 5.6 [81]
Perisesarma guttatum AM/CT/XG/RM 223.3 229.3 6 [81]
Perisesarmasp. AM/CT/XG/RM 222.1 229.3 7.2 [81]
Psuedosesarma crassimanum AO/BG/RA/RM 224.3 230.4 6.1 [81]
Sesarmaspp. AA 224.0 227.4 3.4 [14]
Mean 223.1 228.3 5.2
SD 2.6 2.2 1.8
Median 223.9 228.6 5.6
AM –Avicennia marina; AO –A. officinalis; AC –Aegiceras corniculatum; BG –Bruguiera gymnorhiza; CT –Ceriops tagal; EA –Excoecaria agallocha; KC –Kandelia candel; RA –Rhizophora apiculata; RM –Rhizophora mucronata; XG –Xylocarpus granatum.
found at high density in more open mangroves, further reduces the availability of MPB to the grapsids. From the analysis of the N budget of the grapsid crab N. versicolorand the estimation of the nitrogen content of MPB in the sediment at the same site, Thongtham and Kristensen [41] showed that this crab must consume an unrealistically high amount of sediment to obtain sufficient N for its growth. N demand in the mangrove grapsids was more likely met by occasional consumption of animal tissue, through cannibalism, predation of other invertebrates or scaveng-ing rather than regular consumption of MPB [21,27].
Our results not only confirm the significance of grapsid crabs in directly processing mangrove leaf organic matter, but also highlights the risk of applying ‘global’ trophic discrimination values to analyzing stable isotope food web data. The values commonly used are mean values derived from a large number of consumer-food combinations, which expectedly result in a wide distribution of actual discrimination values (see [39,53–54]). The mean values, while offering some statistical information on the discrimination values, are of little direct value in analyzing specific feeding relationships [56]. Values specific to potential consumer-food combinations need to be obtained before their application to mixing model calculations. While this may not be logistically feasible for all potential food items, a more practical approach is to obtain the values at least at the food category level (e.g. vascular plant vs. animal food) in animals that use diverse food sources.
Studies on C dynamics in estuaries have been dominated by the ‘outwelling’ paradigm for decades [5,7,73]. While earlier rates of export may have been over-estimated [8], recent attention on tropical mangroves has taken a dramatic turn in highlighting the role of mangroves as prime ‘blue-carbon’ storages [74–76]. In-situ consumption of fresh mangrove leaf litter by detritivores such as grapsid crabs and gastropods is a major fate of mangrove production, especially in the Indo-west-Pacific [20,77]. In poorly flushed mangroves with little tidal export, the sediment carbon accumulation rate depends on the balance between litter production and mineralization (in-situ consumption by
macro-detritivores and microbial decomposition). Under-estimating detritus utilization resulting from inappropriate use of global trophic discrimination values in isotopic analyses would emphasize the storage role of mangroves while undervaluing the trophic contribution of wetland vascular plant production to coastal food chains. With recent reports on common occurrence of cellulases in estuarine invertebrates [78–79], these data together demand a re-examination of the general significance of the detritus-based food chain.
In conclusion, our study confirms the dominant role of mangrove leaf litter in the diet of grapsid crabs. Mechanisms by which these animals can benefit from a diet dominated by an apparently low-quality food item require further investigation. With a capacity to convert the low-quality mangrove C into biomass, the grapsid crabs would mediate the transfer of mangrove primary production to nearshore consumers. This link is particularly important in the Indo-west-Pacific mangroves, where the abundance and diversity of mangrove grapsids are maximal [20]. Other trophic links originating from vascular plant detritus may similarly have been undervalued because of the use of inappropriate trophic discrimination values in past isotopic studies. Our data suggest that the tide has not yet turned for mangrove trophic support to nearshore consumer communities.
Acknowledgments
We thank Brian Fry (Griffith University) and Wenqing Wang (Xiamen University, China) for useful discussions and advice on the enriched isotope experiment, and Rene Diocares (Griffith University) for expert technical help with stable isotope analysis.
Author Contributions
Conceived and designed the experiments: THHB SYL. Performed the experiments: THHB. Analyzed the data: THHB SYL. Contributed reagents/materials/analysis tools: THHB SYL. Wrote the paper: THHB SYL.
References
1. Spalding MD, Kainuma M, Collins L (2010) World Atlas of Mangroves. London: Earthscan. 319 p.
2. FAO (2007) The World’s Mangroves: 1980–2005. Rome: FAO. 89 p. 3. Alongi DM (2009) The energetics of mangrove forests. Heidelberg: Springer.
216 p.
4. Bouillon S, Borges AV, Castaneda-Moya E, Diele K, Dittmar T, et al. (2008) Mangrove production and carbon sinks: A revision of global budget estimates. Global Biogeochem Cycles 22: 1–12.
5. Odum WE, Heald EJ (1975) The detritus-based food web of an estuarine mangrove community. In: Cronin LE, editor. Estuarine Research. New York: Academic Press. 265–286.
6. Odum EP (1980) The status of three ecosystem level hypotheses regarding salt marshes: tidal subsidy, outwelling and the detritus based food chain. In: Kennedy VS, editor. Estuarine Perspectives. New York: Academic Press. 485– 496.
7. Teal JM (1962) Energy-Flow in Salt-Marsh Ecosystem of Georgia. Ecology 43: 614–624.
8. Lee SY (1995) Mangrove Outwelling - a Review. Hydrobiologia 295: 203–212. 9. Mazumder D, Saintilan N (2010) Mangrove Leaves are Not an Important Source of Dietary Carbon and Nitrogen for Crabs in Temperate Australian Mangroves. Wetlands 30: 375–380.
10. Oakes JM, Connolly RM, Revill AT (2010) Isotope enrichment in mangrove forests separates microphytobenthos and detritus as carbon sources for animals. Limnol Oceanogr 55: 393–402.
11. Bishop MJ, Cole MR, Taylor SL, Wilkie EM, Kelaher BP (2008) Size-specific predation by dominant consumers maintains a ‘trophic cul-de-sac’. Mar Ecol Prog Ser 354: 75–83.
12. Chong VC, Low CB, Ichikawa T (2001) Contribution of mangrove detritus to juvenile prawn nutrition: a dual stable isotope study in a Malaysian mangrove forest. Mar Biol 138: 77–86.
13. Newell RIE, Marshall N, Sasekumar A, Chong VC (1995) Relative importance of benthic microalgae, phytoplankton, and mangroves as sources of nutrition for
penaeid prawns and other coastal invertebrates from Malaysia. Mar Biol 123: 595–606.
14. Rodelli MR, Gearing JN, Gearing PJ, Marshall N, Sasekumar A (1984) Stable isotope ratio as a tracer of mangrove carbon in Malaysian ecosystems. Oecologia 61: 326–333.
15. Lee SY (2005) Exchange of organic matter and nutrients between mangroves and estuaries: myths, methodological issues and missing links. Int J Eco Environ Sci 31: 163–175.
16. Lee SY (1989) The importance of sesarminae crabs Chiromanthesspp. and inundation frequency on mangrove (Kandelia candel(L.) Druce) leaf litter turnover in a Hong-Kong tidal shrimp pond. J Exp Mar Biol Ecol 131: 23–43. 17. Robertson AI, Daniel PA (1989) The influence of crabs on litter processing in
high intertidal mangrove forests in tropical Australia. Oecologia 78: 191–198. 18. Emmerson WD, Mcgwynne LE (1992) Feeding and assimilation of mangrove
leaves by the crabSesarma meinertiDeman in relation to leaf-litter production in Mgazana, a warm temperate Southern African mangrove swamp. J Exp Mar Biol Ecol 157: 41–53.
19. Camilleri JC (1992) Leaf-litter processing by invertebrates in a mangrove forest in Queensland. Mar Biol 114: 139–145.
20. Lee SY (2008) Mangrove macrobenthos: Assemblages, services, and linkages. J Sea Res 59: 16–29.
21. Lopez B, Conde JE (2013) Dietary variation in the crabAratus Pisonii(H. Milne Edwards, 1837) (Decapoda, Sesarmidae) in a mangrove gradient in northwestern Venezuela Crustaceana 86: 1051–1069.
22. Malley DF (1978) Degradation of mangrove leaf litter by tropical sesarmid crab Chiromanthes onychophorum. Mar Biol 49: 377–386.
23. Poovachiranon S, Tantichodok P (1991) The role of sesarmid crabs in the mineralisation of leaf litter of Rhizophora apiculata in a mangrove, southern Thailand. Phuket Mar Biol Cent Res Bull 56: 63–74.
24. Sheaves M, Molony B (2000) Short-circuit in the mangrove food chain. Mar Ecol Prog Ser 199: 97–109.
26. Werry J, Lee SY (2005) Grapsid crabs mediate link between mangrove litter production and estuarine planktonic food chains. Mar Ecol Prog Ser 293: 165– 176.
27. Kristensen DK, Kristensen E, Mangion P (2010) Food partitioning of leaf-eating mangrove crabs (Sesarminae): Experimental and stable isotope (13
C and15 N) evidence. Estuar Coast Shelf Sci 87: 583–590.
28. Skov MW, Hartnoll RG (2002) Paradoxical selective feeding on a low-nutrient diet: why do mangrove crabs eat leaves? Oecologia 131: 1–7.
29. Bouillon S, Koedam N, Raman AV, Dehairs F (2002) Primary producers sustaining macro-invertebrate communities in intertidal mangrove forests. Oecologia 130: 441–448.
30. Bromand S, Whalen JK, Janzen HH, Schjoerring JK, Ellert BH (2001) A pulse-labelling method to generate C-13- enriched plant materials. Plant Soil 235: 253–257.
31. Unsicker SB, Renker C, Kahmen A, Spindler S, Buchmann N, et al. (2005) Testing the efficiency of three N-15-labeled nitrogen compounds for indirect labeling of grasshoppers via plants in the field. Entomol Exp Appl 116: 219–226. 32. Kennish R (1997) Seasonal patterns of food availability: Influences on the reproductive output and body condition of the herbivorous crab Grapsus albolineatus. Oecologia 109: 209–218.
33. Conover RJ (1966) Assimilation of organic matter by zooplankton. Limnol Oceanogr 11: 338–354.
34. Abdulkadir S, Tsuchiya M (2008) One-step method for quantitative and qualitative analysis of fatty acids in marine animal samples. J Exp Mar Biol Ecol 354: 1–8.
35. Meziane T, Tsuchiya M (2000) Fatty acids as tracers of organic matter in the sediment and food web of a mangrove/intertidal flat ecosystem, Okinawa, Japan. Mar Ecol-Prog Ser 200: 49–57.
36. Hall D, Lee SY, Meziane T (2006) Fatty acids as trophic tracers in an experimental estuarine food chain: Tracer transfer. J Exp Mar Biol Ecol 336: 42–53.
37. Tieszen LL, Boutton TW, Tesdahl KG, Slade NA (1983) Fractionation and turnover of stable carbon isotopes in animal tissues: Implications ford13
C analysis of diet. Oecologia 57: 32–37.
38. Phillips D, Koch P (2002) Incorporating concentration dependence in stable isotope mixing models. Oecologia 130: 114–125.
39. Vander Zanden MJ, Rasmussen JB (2001) Variation in delta N-15 and delta C-13 trophic fractionation: Implications for aquatic food web studies. Limnol Oceanogr 46: 2061–2066.
40. Micheli F (1993) Effect of mangrove litter species and availability on survival, moulting, and reproduction of the mangrove crabSesarma messa. J Exp Mar Biol Ecol 171: 149–163.
41. Thongtham N, Kristensen E (2005) Carbon and nitrogen balance of leaf-eating sesarmid crabs (Neoepisesarma versicolor) offered different food sources. Estuar Coast Shelf Sci 65: 213–222.
42. Camilleri J (1989) Leaf choice by crustaceans in a mangrove forest in Queensland. Mar Biol 102: 453–459.
43. Kwok PW, Lee SY (1995) The growth performances of two mangrove crabs, Chiromanthes bidens and Parasesarma plicata under different leaf litter diets. Hydrobiologia 295: 141–148.
44. Giddins RL, Lucas JS, Neilson MJ, Richards GN (1986) Feeding ecology of the mangrove crabNeosarmatium smithi(Crustacea : Decapoda : Sesarmidae) Mar Ecol Prog Ser 33: 147–155.
45. Guelinckx J, Maes J, Van Den Driessche P, Geysen B, Dehairs F, et al. (2007) Changes in delta C-13 and delta N-15 in different tissues of juvenile sand goby Pomatoschistus minutus: a laboratory diet-switch experiment. Mar Ecol Prog Ser 341: 205–215.
46. Buchheister A, Latour RJ (2010) Turnover and fractionation of carbon and nitrogen stable isotopes in tissues of a migratory coastal predator, summer flounder (Paralichthys dentatus). Can J Fish Aquat Sci 67: 445–461.
47. Gorokhova E, Hansson S (1999) An experimental study on variations in stable carbon and nitrogen isotope fractionation during growth ofMysis mixta and Neomysis integer. Can J Fish Aquat Sci 56: 2203–2210.
48. Hobson KA, Alisauskas RT, Clark RG (1993) Stable-Nitrogen isotope enrichment in avian tissues due to fasting and nutritional stress: Implications for isotopic analyses of siet. Condor 95: 388–394.
49. Olive PJW, Pinnegar JK, Polunin NVC, Richards G, Welch R (2003) Isotope trophic-step fractionation: a dynamic equilibrium model. J Anim Ecol 72: 608– 617.
50. Scrimgeour CM, Gordon SC, Handley LL, Woodford JAT (1995) Trophic levels and anomalousd15
N of iInsects on raspberry (Rubus IdaeusL.). Isotopes Environ Health Stud 31: 107–115.
51. Oelbermann K, Scheu S (2002) Stable isotope enrichment (d15 N andd13
C) in a generalist predator (Pardosa lugubris, Araneae: Lycosidae): Effects of prey quality. Oecologia 130: 337–344.
52. Gannes LZ, O’Brien DM, del Rio CM (1997) Stable isotopes in animal ecology: assumptions, caveats, and a call for laboratory experiments. Ecology 78: 1271– 1276.
53. McCutchan JH, Lewis WM, Kendall C, McGrath CC (2003) Variation in trophic shift for stable isotope ratios of carbon, nitrogen, and sulfur. Oikos 102: 378–390.
54. Peterson BJ, Fry B (1987) Stable isotopes in ecosystem studies. Annu Rev Ecol Syst 18: 293–320.
55. Caut S, Angulo E, Courchamp F (2009) Variation in discrimination factors (d15
N andd13
C): the effect of diet isotopic values and applications for diet reconstruction. J Appl Ecol 46: 443–453.
56. Layman CA, Araujo MS, Boucek R, Hammerschlag-Peyer CM, Harrison E, et al. (2012) Applying stable isotopes to examine food-web structure: an overview of analytical tools. Biol Rev Camb Philos Soc 87: 545–562.
57. Malpica-Cruz L, Herzka SZ, Sosa-Nishizaki O, Lazo JP (2012) Tissue-specific isotope trophic discrimination factors and turnover rates in a marine elasmobranch: empirical and modeling results. Can J Fish Aquat Sci 69: 551– 564.
58. Webb SC, Hedges REM, Simpson SJ (1998) Diet quality influences thed13 C andd15
N of locusts and their biochemical components. J Exp Biol 201: 2903– 2911.
59. Deniro MJ, Epstein S (1981) Influence of diet on the distribution of nitrogen isotopes in animals. Geochim Cosmochim Acta 45: 341–351.
60. Florin ST, Felicetti LA, Robbins CT (2011) The biological basis for understanding and predicting dietary-induced variation in nitrogen and sulphur isotope ratio discrimination. Funct Ecol 25: 519–526.
61. Adams TS, Sterner RW (2000) The effect of dietary nitrogen content on trophic level N-15 enrichment. Limnol Oceanogr 45: 601–607.
62. DeNiro MJ, Epstein S (1978) Influence of diet on the distribution of carbon isotopes in animals. Geochim Cosmochim Acta 42: 495–506.
63. Herbon CM, Nordhaus I (2013) Experimental determination of stable carbon and nitrogen isotope fractionation between mangrove leaves and crabs. Mar Ecol Prog Ser 490: 91–105.
64. Dungait JAJ, Docherty G, Straker V, Evershed RP (2010) Seasonal variations in bulk tissue, fatty acid and monosaccharide d13
C values of leaves from mesotrophic grassland plant communities under different grazing managements. Phytochemistry 71: 415–428.
65. Hyodo F, Kohzu A, Tayasu I (2010) Linking aboveground and belowground food webs through carbon and nitrogen stable isotope analyses. Ecol Res 25: 745–756.
66. Macko SA, Engel MH, Hartley G, Hatcher P, Helleur R, et al. (1991) Isotopic compositions of individual carbohydrates as indicators of early diagenesis of organic matter in peat. Chem Geol 93: 147–161.
67. Moers MEC, Jones DM, Eakin PA, Fallick AE, Griffiths H, et al. (1993) Carbohydrate diagenesis in hypersaline environments: application of GC-IRMS to the stable isotope analysis of derivatized saccharides from surficial and buried sediments. Org Geochem 20: 927–933.
68. Larsen T, Taylor DL, Leigh MB, O’Brien DM (2009) Stable isotope fingerprinting: a novel method for identifying plant, fungal, or bacterial origins of amino acids. Ecology 90: 3526–3535.
69. Larsen T, Wooller MJ, Fogel ML, O’Brien DM (2012) Can amino acid carbon isotope ratios distinguish primary producers in a mangrove ecosystem? Rapid Commun Mass Spectrom 26: 1541–1548.
70. Quinn RH (1980) Mechanisms for obtaining water for flotation feeding in the soldier crab,Mictyris longicarpusLatreille, 1806 (Decapoda, Mictyridae). J Exp Mar Biol Ecol 43: 49–60.
71. Alongi DM (1994) Zonation and seasonality of benthic primary production and community respiration in tropical mangrove forests. Oecologia 98: 320–327. 72. Lee SY (1990) Primary productivity and particulate organic-matter flow in an
estuarine mangrove-wetland in Hong-Kong. Mar Biol 106: 453–463. 73. Odum EP (1980) The status of three ecosystem level hypotheses regarding salt
marshes: tidal subsidy, outwelling and the detritus based food chain. In: Kennedy VS, editor. Estuarine Perspectives. New York: Academic Press. 485– 496.
74. Alongi DM (2012) Carbon sequestration in mangrove forests. Carbon Manage 3: 313–322.
75. Donato DC, Kauffman JB, Murdiyarso D, Kurnianto S, Stidham M, et al. (2011) Mangroves among the most carbon-rich forests in the tropics. Nat Geosci 4: 293–297.
76. Mcleod E, Chmura GL, Bouillon S, Salm R, Bjork M, et al. (2011) A blueprint for blue carbon: toward an improved understanding of the role of vegetated coastal habitats in sequestering CO2. Front Ecol Environ 9: 552–560. 77. Fratini S, Vigiani V, Vannini M, Cannicci S (2004) Terebralia palustris
(Gastropoda; Potamididae) in a Kenyan mangal: size structure, distribution and impact on the consumption of leaf litter. Mar Biol 144: 1173–1182. 78. Adachi K, Toriyama K, Azekura T, Morioka K, Tongnunui P, et al. (2012)
Potent cellulase activity in the hepatopancreas of mangrove crabs. Fish Sci 78: 1309–1314.
79. Niiyama T, Toyohara H, Tanaka K (2012) Cellulase Activity in Blood Cockle (Anadara granosa) in the Matang Mangrove Forest Reserve, Malaysia. Jarq-Japan Agricultural Research Quarterly 46: 355–359.
80. Guest MA, Connolly RM (2004) Fine-scale movement and assimilation of carbon in saltmarsh and mangrove habitat by resident animals. Aquat Ecol 38: 599–609.
81. Bouillon S, Moens T, Overmeer I, Koedam N, Dehairs F (2004) Resource utilization patterns of epifauna from mangrove forests with contrasting inputs of local versus imported organic matter. Mar Ecol Prog Ser 278: 77–88. 82. Hsieh HL, Chen CP, Chen YG, Yang HH (2002) Diversity of benthic organic
83. Nerot C, Meziane T, Provost-Govrich A, Rybarczyk H, Lee SY (2009) Role of grapsid crabs,Parasesarma erythrodactyla, in entry of mangrove leaves into an estuarine food web: a mesocosm study. Mar Biol 156: 2343–2352.