PRINT ISSN 2284-7995, E-ISSN 2285-3952
PRODUCTION OF RAPESEED IN THE UNITED KINGDOM, IN THE
ZONAL AND EUROPEAN CONTEXT (2010-2012)
RaduăLucianăPÂNZARU,ăDragoşăMihaiăMEDELETE
University of Craiova, Faculty of Agriculture and Horticulture,ăă1λăLibert ii,ă200421,ăCraiova,ă Romania, Phone: +40 251 416 595/146, Fax: + 40 251 418 475, E-mail: rlp1967craiova@yahoo.com, medelete @yahoo.com
Corresponding author: rlp1967craiova@yahoo.com
Abstract
Rapeseed is currently one of the world's most important oil species. Rapeseed oil contains varying proportions of saturated and unsaturated fatty acids: Oleic - 20%, linoleic 15%, linolenic - 9% -15% erucic, casenoic - 8%, palmitic - 4%, 1% stearic acid. Erucic acid from rapeseed oil used in diet has negative effects on the human body because it retards the growth of young organism causing diseases of the circulatory system and the adrenal glands, liver and thyroid gland. By reducing the erucic acid content has increased proportion of oleic acid, from 14-20% to more than 64%, and the percentage of linoleic acid from 13-15% to more than 24%, which increased the food quality of rapeseed oil which can replace in this respect the sunflower oil. It should be noted also that, rapeseed oil low in erucic acid content, has unique effects on serum total cholesterol, serum fatty acids and the level of anti-oxidants, compared to diets high in saturated fat or oil mono- or poly-unsaturated from sunflower. The work was
born following the presentation of producer’s performance placed in another area of culture, rather than national, through different environmental conditions and production (production structure, way of organizing the activity, degree of capitalization of the producers etc.).
Keywords: rapeseed acreage, average production, total production
INTRODUCTION
Oilseed rape is currently one of the world's most important oil species, cultivating seed is rich in oil 42-48% used in feed people, the preparation of margarine and industry.
Rapeseed oil has iodine index 94-112 and can be used in the textile, leather, plastics, varnishes, paints, inks, detergents, printing industry, lighting or as a lubricant, oil paintings, candles, to manufacture anti-dusting agent, as an adjunct to pesticides, hydraulic fluids.
The oilcake and grist remaining after oil extraction is a valuable fodder for animals, if taken in moderation. It contains 35-40% protein, 32-37% carbohydrate and 8-10% of mineral salts, thus having high biological value. From 100 kg rapeseed afford 30 - 35 kg oil and 50 - 55 kg of grist.
Oilseed rape can be cultivated also for feed purposes, using as green fodder, very late autumn, when it is sown in late summer or early spring when sown in autumn.
Oilseed rape is a very good melliferous plant,
from a hectare of rape yielding 50 kg of high-quality honey, energizing, anti-anemic also digestive.
PRINT ISSN 2284-7995, E-ISSN 2285-3952
compared with wheat (40-50) or peas. [3] In the culture of oilseed rape, the need of obtaining superior parameters of profitability and economic efficiency can be achieved by
increasing yield per hectare, proper
management of production costs and optimize marketing.
a. The increase in yield per hectare. It is directly related to the following factors: soil suitability in terms of compliance with the conditions required by this plant; use of varieties with high oil content; integrated control of weeds, pests and diseases; full mechanization of work, etc.
b. Managing production costs. Improving this aspect is based on: determination, knowledge also operation cost structure throughout the economic cycle; scheduled correlation yields per hectare costs; makers flexibility in light of changing production conditions during the growing season.
c.Optimizing marketing production.
Production quality is directly related to harvesting technology in two phases or directly to combine.
For both alternatives should be considered the optimal time for starting the harvesting operation.
Preparing production for sale involves bringing indices - hectoliter mass, foreign bodies and moisture to known standards. When negotiating the sale price should be considered also oil content of the seeds. In general, farms must have accurate information on market-especially rapeseed formation and evolution of supply and demand. [2]
MATERIAL AND METHOD
Based on the data used as a source document, the British succeeded in framing under
economic and geographical report (according to FAO), making reference to Europe, the European Union (interstate body to which the UK is a party), and in Northern Europe (geographical region used by FAO). In the first body includes countries such as UK, France, Germany, Belgium, Holland, Ireland, Italy, Denmark, Finland, Sweden, Spain, Portugal, Greece, Cyprus, Luxembourg, Malta, Poland, Slovenia, Slovakia, Czech Republic, Austria, Lithuania, Latvia, Estonia,
Hungary, Romania, Bulgaria. Northern
Europe region consists (according to FAO statistics), a series of countries such as Denmark, Finland, Sweden, Ireland, Norway, Lithuania, Latvia, Estonia.
The method of analysis used for the study is the comparison in time and space, and were used as indicators of cultivated area (thousand ha), total production (thousand tons) also average production per unit productive kg / (ha).
Adequate indicators based on building a dynamic (composed of levels of indicators for the years 2010, 2011 and 2012, to which was added period average), using fixed and mobile based indices (which allowed adequate analysis indicators).
RESULTS AND DISCUSSIONS
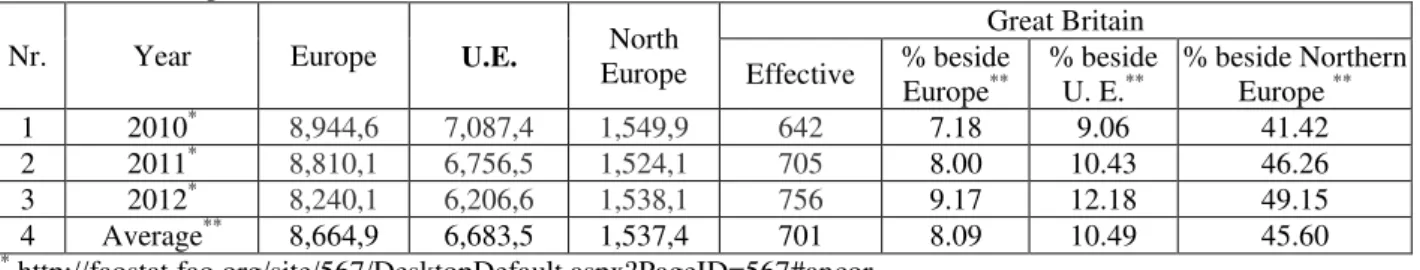
Cultivated area. The European continent is characterized by an area planted with rapeseed between 8,240,100 ha in 2012, and 8,944,600 ha in 2010, while the average period reached 8.6649 million ha (Table 1.).
ha in 2010 to 756,000 ha in the year 2012, while the average period reached 701,000 ha (705,000 ha in 2011).
Table 1. UK - Rapeseed, surface cultivated (thouand ha)
Nr. Year Europe U.E. North
Europe
Great Britain
Effective % beside Europe**
% beside U. E.**
% beside Northern Europe **
1 2010* 8,944,6 7,087,4 1,549,9 642 7.18 9.06 41.42
2 2011* 8,810,1 6,756,5 1,524,1 705 8.00 10.43 46.26
3 2012* 8,240,1 6,206,6 1,538,1 756 9.17 12.18 49.15
4 Average** 8,664,9 6,683,5 1,537,4 701 8.09 10.49 45.60
*
http://faostat.fao.org/site/567/DesktopDefault.aspx?PageID=567#ancor
**
PRINT ISSN 2284-7995, E-ISSN 2285-3952
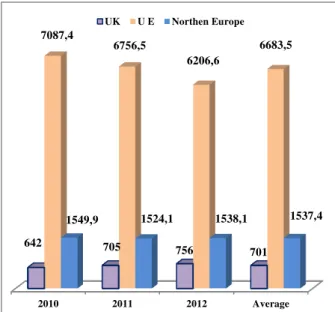
These levels relate to specific situations of the European continent, but also for the European Union (7,087.4, 6,756.5, 6,206.6 and 6,683,3 ha in 2010, 2011, 2012 and period average)
respectively Northern Europe (1,549.9,
1,524.1, 1,538.1 and 1,537.4 ha in the years 2010, 2011, 2012 and for the period average) as presented in Fig. 1.
Fig. 1. UK. Rapeseed cultivated surface (thousand ha)
in the European and regional context (2010-2012)
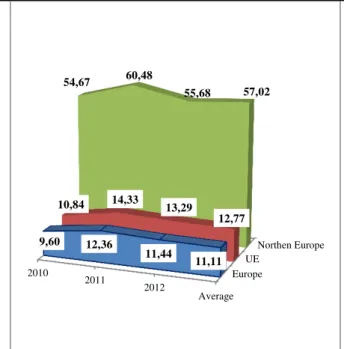
Referring to the cultivated area in the UK, one can observe the variation thereof, from 642,000
It is worth to note that Great Britain has held varying weights to the three levels of reporting. a. compared with the continental situation: from 7.18 to 9.17% (2010 and 2012), with a share of 8.09% of the average period ( Fig. 2); b. compared to the specific situation of the European Union: 9.06% in 2010, 10.43% in 2011, 12.18% in 2012, 10.49% compared with the average of the period (Fig. 2);
c. reported to Northern Europe: 45.60% average share, 41.42% in 2010, 46.26% in 2011, 49.15% in the year 2012 (Fig. 2).
Total production. Regarding the total European production of rapeseed (Table 2), it can be seen that this was an average of 22,632.7 thousand tons, annual sequential levels of 22,307.0 thousand tons in 2011, 22,355.1 thousand tons 2012 and 23,236.3 thousand tons for 2010.
Table 2. Great Britain - Rapeseed, total production (thousand tons)
Nr. Year Europe U.E. Northern
Europe
Great Britain
Effective % beside Europe**
% beside U. E.**
% beside Northern Europe **
1 2010* 23,236.3 20,576.7 4,079.1 2,230 9.60 10.84 54.67
2 2011* 22,307.0 19,249.3 4,560.2 2,758 12.36 14.33 60.48
3 2012* 22,355.1 19,247.0 4,592.3 2,557 11.44 13.29 55.68
4 Average** 22,632.7 19,691.0 4,410.5 2,515 11.11 12.77 57.02 * http://faostat.fao.org/site/567/DesktopDefault.aspx? PageID=567#ancor
**
own calculation
Fig. 2. UK. Rapeseed acreage, European and regional percentage (% )
If we analyze specific data of total British production, variation on indicator is found to 2.23 million t in 2010 to 2.758 million t in 2011.
The average of the period 2.515 million t (while the indicator reached 2.557 million t for 2012) as shown in Fig.3. The total production will be reported to the state of things specific to Europe, the European Union (20,576.7, 19,249.3, 19,247.0 and 19,691.0 thousand tons in 2010, 2011, 2012 and for the
period average) and Northern Europe
(4,079.1, 4,560.2, 4,592.3 and 4,410 thousand tones t in the years 2010.2011, 2012 and for the period average) as presented in Fig. 3.
2010 2011 2012 Average
642 705
756 701
7087,4
6756,5
6206,6
6683,5
1549,9 1524,1 1538,1 1537,4
UK U E Northen Europe
7,18 8,0 9,17 8,09
9,06 10,43
12,18
10,49 41,42
46,26
49,15
45,60
2010 2011 2012 Average
PRINT ISSN 2284-7995, E-ISSN 2285-3952
Fig. 3. UK. Rapeseed Total production (thousand tons) in the European and regional context
Realizing a comparison in space, we can see that Great Britain has held varying weights beside the terms of comparison, as follows: a. 9.60, 12.36, 11.44 and 11.11% beside the continental situation for 2010, 2011, 2012 and period average (Fig. 4);
b. 10.84, 14.33, 13.29 and 12.77% compared to the situation characteristic of the European Union for the years 2010, 2011, 2012 and for the period average (Fig. 4 );
Fig. 4. UK. Rapeseed - Total, European and regional percentage%
c. 54.67, 60.48, 55.68 and 57.02% for the years 2010, 2011, 2012 and for the period average compared to Northern Europe (Fig. 4).
European average yield (Table 3) was one that consistently exceeded the level of 2,500 kg / ha (average of the period reached 2,612 kg) as follows: 2,532 kg / ha in 2011, 2,598 kg / ha for 2010 and 2,713 kg respectively / ha for 2012.
Table 3. Great Britain, Rapeseed average production (kg / ha)
Nr. Year Europe U.E. Northern Europe
Great Britain
Effective % beside Europe**
% beside U. E.**
% beside Northern Europe
**
1 2010* 2,598 2,903 2,632 3,474 133.72 119.67 131.99
2 2011* 2,532 2,849 2,992 3,912 154.50 137.31 130.75
3 2012* 2,713 3,101 2,986 3,382 124.66 109.06 113.26
4 Average** 2,612 2,946 2,869 3,588 137.36 121.79 123.89
*
http://faostat.fao.org/site/567/DesktopDefault.aspx?PageID=567#ancor
** own calculation
In terms of average production per productive unit (ha), UK averaged 3,588 kg, 3,382 kg variation limits in 2012 and 3,912 kg in 2011 (3,474 kg in the case of 2010) as shown in Fig. 5.
The indicator levels evolved into a continental and regional context, quite variable (2,903, 2,849, 3,101 and 2,946 kg for the European Union in 2,632, 2,992, 2,986 and 2,869 kg for Northern Europe in the years 2010, 2011,
2012 and for average of the period, as shown in Fig. 5).
Compared to the continental and regional Great Britain is positioned, in terms of average production, as follows:
a. It exceeds by 24.66%, 33.72%, 37.36% and 54.50% the continental level in 2012, 2010 for the average of the period and the year 2011(Fig. 6);
2010 2011 2012 Average
2230 2758
2557 2515
20576,7
19249,3 19247,0 19691,0
4079,1 4560,2 4592,3 4410,5
UK U E Northen Europe
Europe UE
Northen Europe
2010
2011
2012
Average 9,60 12,36
11,44 11,11 10,84 14,33 13,29
12,77 54,67 60,48
PRINT ISSN 2284-7995, E-ISSN 2285-3952
Fig. 5. UK. Rapeseed Average yield (kg / ha) in the European and regional context
Fig. 6. UK. Rapeseed average production, percentage at European and regional level (% )
b. It outruns of 1.09, 1.19, 1.21 and 1.37 times the situation in the European Union for the years 2012, 2010, and that the average of the period 2011 (Fig. 6);
c. Its production is higher by 13.26%, 23.89%, 30.75% and 31.99% than the specific
level for Northern Europe in 2012, for the period average and year 2011 and 2010 (Fig.6).
CONCLUSIONS
This study led to the following conclusions: a. in terms of cultivated area, Great Britain represents a major player in Europe, beside the European Union and Northern Europe at the level average weights of 8.09%, 10.49% and 45.60% (noting the annual weights evolved ascending in all three reporting cases);
b. It is noticeable the upward trend of the surface (from 642 to 756,000 ha - 2010 and 2012), a situation favorable compared to the European Community and north Europe, areas for which the indicator has been descending or more fluctuating (North Europe);
c. The British total rapeseed production evolved uneven similar appearance to the
European one positive compared to
Community downward trend and negative compared with the situation in the North of Europe (characterized by increasing the index from 2010 to 2012);
d. The UK has achieved, in average, 11.11% of the total European production (3.02% exceeds the percentage recorded for the area), 12.77% of Community production (+ 2.28% compared to the share at the level of surface), 57.02% of the Europe the northern (+ 11.42% compared with the percentage of the area), which noted special attention given to this crop;
e. The uneven development of production has
entailed also variable annual weights
compared with the terms of reference;
f. The average production has recorded an uneven trend during the period under review, increases in 2011 (438 kg compared to 2010), followed by decreases in the case of 2012 (-530 kg compared with the previous term of dynamic series - 2011) . The appearance is unfavorable compared to the situation specific of the European continent (continuous growth), but similar to that for the European Union and the Northern Europe. This instability is mainly the result of the influence of climatic conditions;
2010 2011 2012 Average
3474
3912
3382 3588
2903 2849
3101
2946
2632 2992 2986 2869
UK U E Northen Europe
Europe
North…
2010 2011
2012
Average
133,72 154,50
124,66
137,36 119,67 137,31
109,6
121,79 131,99
130,75
113,26 123,89
PRINT ISSN 2284-7995, E-ISSN 2285-3952
g. It is noteworthy that Great Britain surpasses clearly all the terms for comparison - Europe,
European Union, Northern Europe -
demotions average of 1.37, 1.21 and the 1.23 times. Exceedances of European situation evolved upward, while towards the European Union and the Northern Europe, overruns were fluctuating.
It can be concluded that the UK is a major player in the European market of rapeseed, at least through the primary potential which it develops. Following are considered beneficial experiences of producers in this area, at least technically and technologically.
REFERENCES
[1]Pânzaru,ă R.L.,ă Medelete,ă D.M.,ă Ştefan,ă ż.,ă 200λ,ă
The Economics of crop production, Ed. Universitaria, Craiova, Chapter 2, pp. 68-140
[2]Ştefan,ăM.,ăConstantinescuăźmilia,ă2011,ăCropăIIIă+ă
IV, Distance learning university Manual, Ed. Universitaria, Craiova, Theme 2, p. 23-41