Trends and spatial patterns of mortality related to neglected
tropical diseases in Brazil
Francisco Rogerlândio Martins-Melo
a,b, Alberto Novaes Ramos Jr.
a,
Carlos Henrique Alencar
a, Jorg Heukelbach
a,c,d,⁎
aDepartment of Community Health, School of Medicine, Federal University of Ceará, Rua Professor Costa Mendes, 1608, Rodolfo Teófilo, 60430-140 Fortaleza, CE, Brazil bFederal Institute of Education, Science and Technology of Ceará, Rua Engenheiro João Alfredo, s/n, Pabussu, 61600-000 Caucaia, CE, Brazil
cAnton Breinl Centre for Public Health, James Cook University, Townsville, QLD 4811, Australia
dCollege of Public Health, Medical and Veterinary Sciences, Division of Tropical Health and Medicine, James Cook University, Townsville, QLD 4811, Australia
a r t i c l e
i n f o
a b s t r a c t
Article history:
Received 29 December 2015 Accepted 2 March 2016 Available online xxxx
We analysed nationwide trends and spatial distribution of NTD-related mortality in Brazil. We included all death certificates in Brazil from 2000 to 2011, in which NTDs were recorded as any causes of death. A total of 100,814/12,491,280 (0.81%) death certificates were identified, which mentioned at least one NTD. Age-adjusted NTD-related mortality rates showed a significant decrease over time (annual percent change [APC]:−2.1%; 95% CI:−2.8 to−1.3), with de-creasing mortality rates in the Southeast, South, and Central-West regions, stability in the Northeast region, and increase in the North region. We identified spatial and spatiotemporal high-risk clusters for NTD-related mortality in all regions, with a major cluster covering a wide geographic range in central Brazil. Despite nationwide decrease of NTD-related mortality in the observation period, regional differences remain, with increasing mortality trends espe-cially in the socioeconomically disadvantaged regions of the country. The existence of clearly defined high-risk areas for NTD-related deaths reinforces the need for integrated prevention and control measures in areas with highest disease burden.
© 2016 The Authors. Published by Elsevier Ltd on behalf of World Federation of Parasitologists. This is an open access article under the CC BY-NC-ND license (http://creativecommons.org/licenses/by-nc-nd/4.0/). Keywords:
Neglected tropical diseases Time trend analysis Spatial analysis Epidemiology Mortality Brazil
1. Introduction
Despite receiving more and more attention by clinicians, policy makers and the scientific community, Neglected tropical dis-eases (NTDs) continue being an important cause of morbidity and mortality in endemic countries, perpetuating the vicious cycle of poverty (WHO, 2010; Hotez et al., 2011).
Brazil–a country of continental dimensions with a population of about 200 million–is particularly affected, and has recently been considered to be a“hot spot”for NTDs (Hotez, 2014). In fact, 13 of the 17 NTDs are present in its territory (Martins-Melo et al., 2016a), with the largest numbers on the American continent of cases of leprosy, trachoma, schistosomiasis, leishmaniasis, soil-transmitted helminth infections, dengue fever,filariasis and Chagas Disease (Hotez, 2008; Hotez and Fujiwara, 2014).
We have recently described the epidemiological characteristics of NTD-related mortality over a period of 12 years, considering the underlying cause of death (Martins-Melo et al., 2016a). While the analysis of underlying causes of death is usually applied as
⁎Corresponding author at: Department of Community Health, School of Medicine, Federal University of Ceará, Rua Professor Costa Mendes 1608, 5. andar, Fortaleza, CE, 60430-140, Brazil.
E-mail address:[email protected](J. Heukelbach).
http://dx.doi.org/10.1016/j.parepi.2016.03.002
2405-6731/© 2016 The Authors. Published by Elsevier Ltd on behalf of World Federation of Parasitologists. This is an open access article under the CC BY-NC-ND license (http://creativecommons.org/licenses/by-nc-nd/4.0/).
Contents lists available atScienceDirect
Parasite Epidemiology and Control
standard, an analysis of multiple causes of death (i.e. underlying and associated causes of death) will facilitate trend and spatial analyses, besides the inclusion of information on NTDs that are usually not selected as an underlying cause of death ( Martins-Melo et al., 2012a, 2015a, 2014a, 2016b). Knowledge of the geographical distribution and trends of NTD-related deaths in endemic countries is essential for monitoring and evaluation of the impact of disease prevention and control intervention strategies, and the effectiveness of disease-specific control measures (Martins-Melo et al., 2012a, 2014a, 2014b). As the NTD burden differs by Brazilian regions, with most diseases occurring in areas of low socioeconomic status, mainly in the North and Northeast regions (Hotez, 2008; Hotez and Fujiwara, 2014; Lindoso and Lindoso, 2009), and as there have been particular characteristics of occurrence over time, we here present a trend and spatial analysis of NTD-related mortality in Brazil from 2000 to 2011, based on multiple causes of death.
2. Material and methods
2.1. Study design and population
We analysed nationwide temporal trends, spatial and spatiotemporal high-risk clusters of NTD-related mortality. We included all deaths in Brazil between 2000 and 2011, in which NTDs were mentioned on death certificates, either as underlying or as as-sociated causes of death (multiple causes of death). We selected all NTDs as defined by the World Health Organization, regardless if there are autochthonous cases reported or not (Martins-Melo et al., 2016a, WHO, 2010, 2013, 2014a). We used the Tenth Revision of the International Statistical Classification of Diseases and Related Health Problems (ICD-10) for coding causes of death (WHO, 2014b).
2.2. Data sources
Mortality data were obtained from death certificates, as available from the Mortality Information System (Sistema de Informação sobre Mortalidade—SIM) of the Brazilian Ministry of Health. Death certificates include information on sex, age,
edu-cation, ethnicity, marital status, date of death, place of residence, place of occurrence of death, and causes of death. The data are public domain (Ministério da Saúde do Brasil, Departamento de Informática do Sistema Único de Saúde, 2014). Details on downloading and processing the roughly 12.5 million data sets have been described previously in detail (Martins-Melo et al., 2016a, 2012a, 2015a, 2012b).
Census data were obtained from the Brazilian Institute of Geography and Statistics (Instituto Brasileiro de Geografia e Estatística
—IBGE)—we used exact information for 2000 an 2010 (years of demographic censuses in Brazil), and estimates for inter-census years (2001–2009, and 2011) (Instituto Brasileiro de Geografia e Estatística (IBGE), 2014).
2.3. Data analysis
Crude and age-adjusted NTD-related mortality rates (per 100,000 inhabitants) and their associated 95% confidence intervals (CIs) are presented for the overall population and subgroups. Age-standardized rates were calculated by applying the direct meth-od (Brazilian 2010 census as standard population).
As shown previously by our group (Martins-Melo et al., 2016a), the great majority of NTD-related deaths was associated with Chagas disease. Thus, we analysed separately deaths excluding Chagas disease, in addition to the analysis of all NTD-related deaths.
2.3.1. Trend analysis
Time trend analysis of age-adjusted mortality rates was performed using joinpoint regression models (Kim et al., 2000), strat-ified by region of residence. Details of the analysis have been described previously (Martins-Melo et al., 2015a, 2014a, 2014b). Statistical significance was tested using the Monte Carlo permutation test (Kim et al., 2000). The annual percent change (APC) and 95% CI are presented for each segment to describe and quantify the trend, and to assess significance (Kim et al., 2000).
2.3.2. Descriptive spatial analysis
We analysed the spatial distribution and spatial–temporal patterns of mortality using municipalities as the geographical units of analysis (n = 5565; Brazilian territorial division of 2010). Wefirst calculated the average annual crude mortality rates (per 100.000 inhabitants) by municipality. To correct for randomfluctuations and to provide greater stability of mortality rates mainly in small municipalities, we calculated smoothed mortality rates by applying the Local Empirical Bayesian smoothing method (Assunção et al., 1998).
2.3.3. Spatial cluster analysis
2.3.4. Spatiotemporal cluster analysis
We used retrospective Kulldorff's space-time scan statistics to identify high-risk spatiotemporal clusters (Kulldorff and Nagarwalla, 1995; Kulldorff, 1997). As the single events under analysis (deaths) are counts and considered rare, we used Poisson's discrete probability model. We used the following conditions: time of aggregation of 1 year, no geographical overlapping of clusters, circular clusters, maximum spatial cluster size of 20% of the population at risk, and a maximum temporal cluster of 50% of the study period. Most likely cluster and secondary clusters were detected through the log likelihood ratio (LLR) test. We computed significance using 999 Monte Carlo simulations.
Joinpoint regression analyses were carried out using Joinpoint Regression Programme version 4.0.4 (US National Cancer Institute, Bethesda, MD, USA). ArcGIS version 9.3 (Environmental Systems Research Institute, ESRI, Redlands, CA, USA) and TerraView version 4.2 (Instituto Nacional de Pesquisas Espaciais,INPE,São José dos Campos,SP, Brazil) were used for input, process-ing, calculation of spatial autocorrelation indicators, and construction of thematic maps. Scan statistics was performed using SaTScan software version 9.1.1 (Harvard Medical School, Boston and Information Management Service Inc., Silver Spring, MD, USA).
2.4. Ethical considerations
The Ethical Review Board of the Federal University of Ceará (Fortaleza, Brazil) approved the study (registered under the number 751,109/2014).
3. Results
3.1. NTD-related deaths
A total of 4482/5565 (80.5%) of Brazilian municipalities registered at least one NTD-related death. We identified 100,814/ 12,491,280 death certificates, which mentioned at least one NTD (proportional mortality: 0.81% [95% CI: 0.80–0.81]). Of these NTD deaths, 76,847 (76.2%) were reported as an underlying cause, and 23,967 (23.8%) as an associated cause of death. Chagas disease was responsible for 72.0% of these deaths (72,827), followed by schistosomiasis (8.7%; 8756) and leprosy (7.6%; 7732). The overall crude mortality rate in the 12-year period was 4.53 deaths/100,000 inhabitants (95% CI: 4.43–4.63), and age-adjusted rate was 5.67 deaths/100,000 inhabitants (95% CI: 5.56–5.77).
3.2. Time trends
Figs. 1 and 2present the temporal trends of mortality rates by NTD-related deaths and by NTD-related deaths excluding Chagas disease, respectively. Age-adjusted NTD-related mortality rates presented a significant decrease at national level (APC:−2.1%; 95% CI:−2.8 to−1.3) over the 12-year period. There were different patterns between regions (Fig. 1;Table 1) with a significant decrease of age-adjusted rates in the Southeast, South, and Central-West regions. The rates in the Northeast re-gion remained stable over time, and the North rere-gion presented a significant increase (Fig. 1;Table 1).
Mortality rates by NTD excluding Chagas disease maintained stable at national level, with similar patterns observed in the Northeast, Southeast and Central-West regions (Fig. 2;Table 1). The North region presented a significant increase and the South a significant decrease (Fig. 2;Table 1).
3.3. Spatial distribution
The Central-West (18.69 deaths/100,000 inhabitants), Southeast (5.91 deaths/100,000 inhabitants) and Northeast (5.32 deaths/100,000 inhabitants) regions had the highest regional age-adjusted mortality rates (Supplementary Table 1). The highest age-adjusted mortality rates by state of residence were observed in Goiás State (27.44 deaths/100,000 inhabitants), Federal Dis-trict (22.07 deaths/100,000 inhabitants) and Minas Gerais State (11.13 deaths/100,000 inhabitants) (Supplementary Table 1). On the municipality level, average annual crude rates reached a maximum of 136.4 deaths/100,000 inhabitants, and smoothed rates 83.0 deaths/100,000 inhabitants.
After exclusion of Chagas disease-related deaths, the highest average annual age-adjusted rates were observed in the Northeast (2.40 deaths/100,000 inhabitants), Central-West (2.37 deaths/100,000 inhabitants) and North regions (1.74 deaths/100,000 inhab-itants) (Supplementary Table 2). The states with highest age-adjusted rates were Alagoas (5.38 deaths/100,000 inhabinhab-itants), Per-nambuco (4.69 deaths/100,000 inhabitants) and Mato Grosso (3.57 deaths/100,000 inhabitants) (Supplementary Table 2).
Fig. 2.Trends of age-adjusted NTD-related mortality rates excluding Chagas disease (per 100,000 inhabitants) in Brazil and regions, 2000–2011.
Table 1
Joinpoint regression analysis of NTD-related mortality rates in Brazil, 2000–2011.
Region of residence Age-adjusted mortality rates (per 100,000 inhabitants)
APC 95% CI p-Value
Initial—2000 Final—2011
All NTD-related deaths
Brazil 5.74 4.66 −2.1a −2.8 to−1.3 b0.001
North 2.31 2.83 3.6a 1.2 to 6.0 0.001
Northeast 4.70 5.12 0.7 −0.3 to 1.7 0.131
Southeast 6.21 4.54 −3.2a −4.2 to−2.1 b0.001
South 2.52 1.38 −5.3a −6.8 to−3.8 b0.001
Central-West 20.03 13.73 −3.7a −4.8 to−2.6 b0.001
NTD-related deaths without Chagas disease
Brazil 1.36 1.44 0.6 −0.5 to 1.7 0.209
North 1.50 1.79 5.1a 1.7 to 8.5 0.001
Northeast 2.09 2.39 0.6 0.7 to 1.8 0.295
Southeast 1.05 1.08 −0.1 −2.1 to 1.8 0.882
South 0.75 0.45 −4.6a −6.1 to−3.1 b0.001
Central-West 1.98 1.84 3.0 −0.6 to 6.7 0.067
APC: annual percent change; CI: confidence interval.
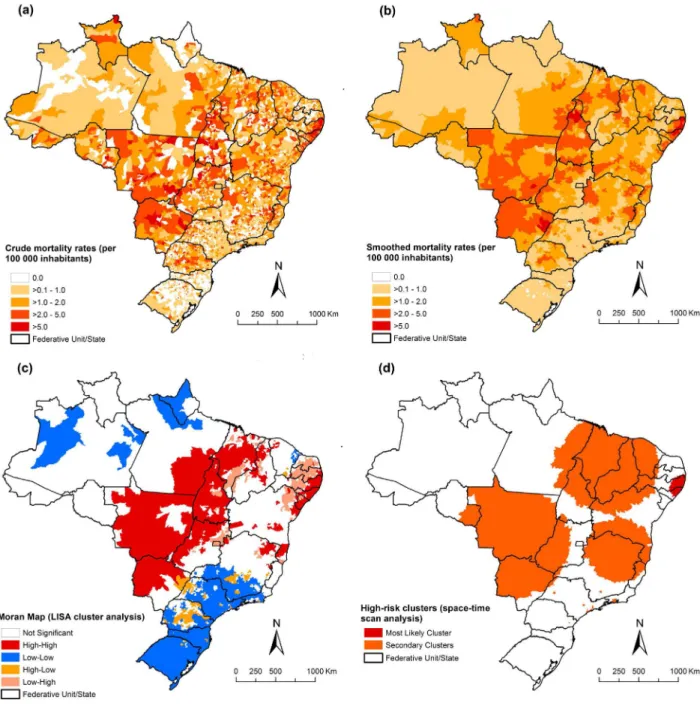
Figs. 3 and 4present the spatial distribution and cluster analysis of mortality rates by NTD-related deaths with and without Chagas disease, respectively. There were municipalities and clusters of municipalities with higher mortality rates (N10.0 deaths/ 100,000 inhabitants) located mainly in Northeast, Southeast and Central-West regions. We observed important areas with high rates mainly concentrated in the central region of Brazil, covering the states of Goiás, Minas Gerais, São Paulo, Tocantins, Bahia and Piauí, and the Federal District (Fig. 3-A and B). For NTD-related deaths without Chagas disease, there was a different pattern with concentration of municipalities with high mortality rates (N2.0 deaths/100,000 inhabitants) in the Central-West, North, Northeast and Southeast regions (Fig. 4-A and B).
3.4. Spatial cluster analysis
For all NTD-related deaths, global Moran's I index showed significant positive spatial autocorrelation (0.32; pb0.001), evidencing the existence of spatial dependence among NTD-related rates of the municipalities with similar patterns.Fig. 3-C Fig. 3.Spatial distribution of NTD-related deaths by municipality of residence, Brazil, 2000–2011: (a) average annual crude NTD-related mortality rates (per
presents the clusters of municipalities identified by LISA analysis. We identified high-risk mortality clusters in Northeast, South-east, South and Central-West regions. There was a large concentric cluster in central Brazil, covering most municipalities of the states of Goiás and Minas Gerais, Federal District, extending to other neighbouring states. We identified smaller high-risk cluster located in states of Piauí, Bahia, São Paulo and Paraná (Fig. 3-C).
For NTD-related deaths without Chagas disease, global Moran's I value was 0.29 and statistically significant (pb0.001). Clusters of municipalities with high-risk were identified in Central-West, North, and Northeast regions (Fig. 4-C). There was a major concentric cluster covering most of the states of the Central-West region and Tocantins state, extending to the southeast of Pará, most of the Maranhão state, west and central region of Piauí state and bordering the west of the Ceará state. In the Northeast and Southeast regions, other high-risk areas were identified, highlighting a cluster on the coastline of the Northeast re-gion (Fig. 4-C).
3.5. Spatiotemporal cluster analysis
The scan space-time analysis identified 13 significant spatiotemporal high-risk clusters for NTD-related deaths (Fig. 3-D; Table 2). The most likely cluster (primary cluster) occurred between 2000 and 2005, and included 689 municipalities distributed to several states in central Brazil. The annual crude mortality rate was 17.8 deaths/100,000 inhabitants (RR = 4.48). The second most significant cluster was identified in the period 2006–2011, with an annual rate of 9.1 deaths per 100,000 inhabitants (RR = 2.02). This cluster included 173 municipalities located in northeast of Bahia state (Fig. 3-D;Table 2). Other secondary clus-ters were located in states of North, Northeast, Southeast and South regions. The RRs of the secondary clusclus-ters ranged from 1.11 to 8.77, and annual crude mortality rates from 5.1 to 40.2 deaths/100,000 inhabitants (Table 2).
For NTD-related deaths without Chagas disease, we identified 12 spatiotemporal significant high-risk clusters covering areas in all regions (Fig. 4-D;Table 3). The most likely cluster occurred between 2001 and 2006 covering 181 municipalities in the states of Paraíba, Pernambuco and Sergipe in the Northeast region (annual mortality rate 4.9 deaths/100,000 inhabitants; RR = 4.10). Secondary high-risk clusters of mortality rates were located in the Central-West, Southeast and Northeast regions (annual mortal-ity rates from 1.9 to 40.1 deaths/100,000 inhabitants; RR = 1.56–31.36;Fig. 4-D;Table 3).
4. Discussion
We observed a significant decrease of NTD-related mortality in Brazil over a 12-year period, and identified spatial and spatio-temporal high-risk clusters. There was an outstanding heterogeneity of NTD-related mortality among Brazilian regions. Despite the nationwide decrease of NTD-related mortality, there was an increasing trend particularly in the socioeconomically disadvan-taged regions of the country.
The regional differences of NTD-related mortality are a consequence of specific geographical distribution of prevalence, vector habitats and reservoirs. In addition, low socioeconomic and environmental conditions, migration, limited access to water, sanita-tion, and to interventions and healthcare services also favour transmission, late diagnosis and high morbidity, and consequently increased mortality (Hotez and Fujiwara, 2014; Lindoso and Lindoso, 2009; Martins-Melo et al., 2014a, 2012b, 2015b; Yang et al., 2014).
The highest NTD-related death rates were observed in the Central-West and Southeast regions. This is explained by the impact of Chagas disease deaths in these regions, which have been important endemic areas (Martins-Melo et al., 2012b, 2014c; Ostermayer et al., 2011; Silveira, 2011; Silveira et al., 2011). There was also a considerable impact of mortality related to schisto-somiasis and leishmaniasis in the Northeast region, and leprosy and dengue fever in the Central-West region (Martins-Melo et al., 2015a, 2014a, 2014b, 2015b; Paixão et al., 2015; Nascimento and de Oliveira, 2014). The South, one of the most socioeconomically developed regions of Brazil, showed the lowest NTD-related mortality rates (Lindoso and Lindoso, 2009).
In the observation period, there was a significant decrease of age-adjusted NTD mortality rates in most regions. The decline occurred mainly in regions endemic for different NTD and can be attributed partially to the impact of control programme mea-sures implemented in last decades (Martins-Melo et al., 2014a, 2014c; Ostermayer et al., 2011; Amaral et al., 2006). There was a significant decline of Chagas disease-related mortality, the main cause of death among NTDs, in recent years (Martins-Melo
Table 2
Significant spatiotemporal clusters of NTD-related deaths, defined using space–time scan statistics by municipality of residence, Brazil, 2000–2011.
Cluster Time period
Number of municipalities
States Region Radius
(km) Number of deaths Expected number of deaths Annual mortality ratea
RR LLR p-Value
1 2000–2005 689 Tocantins, Bahia, Minas Gerais,
São Paulo, Distrito Federal, Goiás, Mato Grosso and Mato Grosso do Sul
North, Northeast, Southeast and Central-west
550.5 17,488 4510.4 17.8 4.48 11,638.80 b0.001
2 2006–2011 173 Bahia Northeast 206.5 4170 2105.7 9.1 2.02 806.69 b0.001
3 2000–2005 99 São Paulo and Paraná Southeast and South
106.2 1404 524.6 12.3 2.70 506.71 b0.001
4 2000–2005 42 Alagoas and Pernambuco Northeast 57.9 1130 451.7 11.5 2.52 360.09 b0.001
5 2006–2011 22 Pernambuco Northeast 36.5 581 216.8 12.3 2.69 209.23 b0.001
6 2006–2011 24 Piauí Northeast 83.3 210 35.2 27.3 5.97 200.25 b0.001
7 2001–2006 71 Minas Gerais Southeast 80.3 1904 1369.9 6.4 1.40 94.16 b0.001
8 2004–2009 32 Paraíba and Pernambuco Northeast 62.2 255 113.4 10.3 2.25 6511 b0.001
9 2000–2005 1 São Paulo Southeast 0.0 121 39.4 14.1 3.07 54.23 b0.001
10 2007–2010 36 Pará, Maranhão and Tocantins North and
Northeast 102.7 156 86.8 8.2 1.80 22.31 b0.001 11 2000–2005 14 São Paulo Southeast 28.7 4086 3687,8 5.1 1.11 21.58 b0.001
12 2005–2005 1 Maranhão Northeast 0.0 14 1.6 40.2 8.77 18.00 0.005 13 2004–2004 1 Paraná North 0.0 14 1.9 33.5 7.32 15.78 0.037 RR: relative risk for the cluster compared with the rest of the country; LLR: log likelihood ratio.
et al., 2016a). With implementation of systematic entomological surveillance and screening of blood donors, control of vector transmission and mother-to-child transmission, the number of new cases and deaths has been reduced dramatically in recent years (Martins-Melo et al., 2012a, 2014c, 2014d; Ostermayer et al., 2011; Ramos et al., 2010). However, in the North and North-east regions, where incidence is known to be relatively low, death rates have been increasing or stable over the years ( Martins-Melo et al., 2012a, 2012c; da Nóbrega et al., 2014). This can be explained in part by the low impact caused by the elimination of transmission by the main vector–the kissing bugTriatoma infestans–since this vector had not been frequent in the North and Northeast regions (Martins-Melo et al., 2012a, 2012c; Silveira, 2011; Braz et al., 2011). Secondary vectors such asTriatoma brasiliensisandTriatoma pseudomaculataappear to have still an important role in maintaining disease transmission in the North-east region. In addition, outbreaks of oral transmission have repeatedly been reported mainly from the Amazon region ( Martins-Melo et al., 2012a, 2012c).
Due to the impact of control measures implemented in recent decades, other NTDs with high mortality impact, such as schis-tosomiasis and leprosy, also presented decreasing trends, as shown previously (Martins-Melo et al., 2015a, 2014a; Amaral et al., 2006). Other factors not related to specific control programmes may have contributed to the decline in morbidity and mortality, such as increased urbanization, general improvements in housing, socioeconomic and sanitary conditions, and improved access to healthcare services (Martins-Melo et al., 2012a, 2014a, 2016b).
After exclusion of Chagas disease-related deaths from analysis, mortality rates remained stable in almost all regions, except the North, which presented a significant increase. This reinforces the importance of other important NTDs that showed increased morbidity and mortality in Brazil in recent years, such as visceral leishmaniasis and dengue (Martins-Melo et al., 2014b; Paixão et al., 2015).
The geographical distribution of NTD-related mortality was heterogeneous, with the occurrence of deaths concentrated in cer-tain regions and subpopulations. Independently from the spatial statistical approach used, we identified spatial and spatiotempo-ral high-risk clusters for NTD-related mainly in highly endemic and vector transmission regions for Chagas disease in previous decades (Martins-Melo et al., 2012b, 2014c; Silveira, 2011; Silveira et al., 2011). After exclusion of Chagas disease-related deaths, a different risk area pattern was identified, in highly endemic areas for several other NTDs, such as schistosomiasis located mainly on the east coast of the Northeast region, visceral leishmaniasis mainly in endemic areas of the Northeast and North regions, and leprosy and dengue fever in the Central-West region from where most cases have been reported (Martins-Melo et al., 2015a, 2014b, 2015b).
Our study confirmsfindings that the concentration of preventive and control interventions in high-risk areas can be an effec-tive strategy for control of disease burden, not only leading to reduced operational costs, but also contributing to the sustainability of NTD control programmes (Martins-Melo et al., 2014b, 2012b; Alencar et al., 2012; Bergquist et al., 2015). In line with current WHO initiatives (WHO, 2010, 2013, 2012; Uniting to Combat NTDs, 2012), Brazil launched in 2012 an integrated plan of strategic action (2012–2015) to eliminate important NTDs as a public health problem, such as leprosy,filariasis, schistosomiasis and oncho-cerciasis; to eliminate trachoma as an important cause of blindness; and to control more effectively soil-transmitted helminthiases Table 3
Significant spatiotemporal clusters of NTD-related deaths excluding Chagas disease, defined using space-time scan statistics by municipality of residence, Brazil, 2000–2011.
Cluster Time period
Number of municipalities
States Region Radius
(km) Number of deaths Expected number of deaths Annual mortality ratea
RR LLR p-Value
1 2001–2006 181 Paraíba, Pernambuco and Sergipe
Northeast 173.1 2509 656.1 4.9 4.10 1.576.51 b0.001
2 2006–2011 884 Pará, Tocantins, Maranhão, Piauí, Ceará, Rio Grande do Norte, Paraíba, Pernambuco and Bahia
North and Northeast
681.9 2892 1812.4 2.0 1.66 294.24 b0.001
3 2007–2011 395 Rondônia, Mato Grosso, Mato Grosso do Sul, Tocantins, Goiás, Minas Gerais and São Paulo
North, Central-west and Southeast
769.2 1190 598.7 2.5 2.03 232.53 b0.001
4 2006–2011 596 Bahia, Goiás, Minas Gerais and Espírito Santo
Northeast, Southeast and Central-west
432.8 1849 1213.8 1.9 1.56 150.55 b0.001
5 2000–2005 1 São Paulo Southeast 0.0 94 11.0 10.9 8.57 118.75 b0.001
6 2008–2008 11 Rio de Janeiro Southeast 34.4 320 122.7 3.3 2.63 110.21 b0.001
7 2010–2010 8 São Paulo Southeast 39.3 85 20.7 5.2 4.11 55.67 b0.001
8 2000–2004 1 Paraná South 0.0 33 5.2 8.1 6.31 32.99 b0.001
9 2000–2004 1 Minas Gerais Southeast 0.0 26 4.3 7.8 6.06 25.12 b0.001
10 2001–2006 1 Santa Catarina South 0.0 9 0.3 40.1 31.36 22.30 b0.001
11 2010–2010 4 São Paulo Southeast 11.8 10 0.6 20.9 16.31 18.53 0.002
12 2001–2004 1 São Paulo Southeast 0.0 48 17.7 3.5 2.72 17.64 0.005 RR: relative risk for the cluster compared with the rest of the country; LLR: log likelihood ratio.
(Ministério da Saúde do Brasil, 2012). This plan is one of the pillars of the Brazil's Without Extreme Poverty Plan (Plano Brasil Sem Miséria) of the Federal Government, which aims to reduce the burden of disease in elimination by prioritization of active case de-tection and timely provision of effective treatment in the most vulnerable population groups (Ministério da Saúde do Brasil, 2012). However, for effective and sustainable control of NTDs, specific prevention and control measures should be developed in conjunction with multisectoral and integrated interventions, such as improved living conditions, adequate sanitation, access to clean water, and better access to healthcare services (Hotez and Fujiwara, 2014; Martins-Melo et al., 2014a; Yang et al., 2014; Nascimento and de Oliveira, 2014). There is a need for more intensive research on drugs, vaccines, diagnostics and control methods for NTDs, as well as for a higher political commitment on different levels of management, with the strengthening of decentralized management bothfinancially and technically to state and municipality governments (Martins-Melo et al., 2014a; Nascimento and de Oliveira, 2014; Ministério da Saúde do Brasil, 2012). Programmes for control of specific diseases, which are usually considered of chronic nature and not a cause of death (such as leprosy) should also consider case fatality and mortality (Martins-Melo et al., 2016a, 2015a).
Our study has some limitations. Secondary mortality data may present inconsistencies in terms of coverage (proportion of deaths reported and estimated) and quality of information (Martins-Melo et al., 2016a, 2012a, 2014b; Santo, 2009). Coverage and proportion of ill-defined causes of death presented variations among regions of the country, mainly in the North and North-east (Martins-Melo et al., 2016a, 2015a, 2015b; Santo, 2009). During the 12-year observation period, an increasing number of deaths may also be related to increased coverage and improvements of death records, as well as to the improvement of access to health care services (Martins-Melo et al., 2012c). Interpretation of trend data and regional differences should consider these limitations. The underlying causes of death may have been coded as a complication or aggravation associated with some NTDs (for example such as gastrointestinal bleeding, portal hypertension and oesophageal varices for schistososmiasis, and heart failure for Chagas disease) (Martins-Melo et al., 2014a, 2012d; Nascimento and de Oliveira, 2014), or another underlying cause in which some NTD was recorded as associated cause. Data based on multiple causes of death reduced this error, and we identified all death certificates in which any NTDs were mentioned in any part of the death certificates. In fact, the number of NTD deaths in-creased about 24% when multiple causes of death were considered, as compared to merely underlying causes of death. With the inclusion of NTD deaths as associated causes, there was a considerable increase of deaths associated to diseases that are rarely characterized as underlying causes, and consequently do not appear as a common cause of death in mortality statistics (such as leprosy,filariasis and trachoma) (Martins-Melo et al., 2016a).
We conclude that multisectoral and integrated prevention and control measures should be prioritized considering geographical areas with the highest NTD-related morbidity and mortality burden in the country. Social determinants of health and regional dis-parities should be taken into account when designing specific disease control and prevention programmes.
Supplementary data to this article can be found online athttp://dx.doi.org/10.1016/j.parepi.2016.03.002.
Acknowledgements
JH is class 1 research fellow at theConselho Nacional de Desenvolvimento Científico e Tecnológico(CNPq/Brazil).
References
Alencar, C.H., Ramos Jr., A.N., dos Santos, E.S., Richter, J., Heukelbach, J., 2012.Clusters of leprosy transmission and of late diagnosis in a highly endemic area in Brazil: focus on different spatial analysis approaches. Tropical Med. Int. Health 17 (4), 518–525.
Amaral, R.S., Tauil, P.L., Lima, D.D., Engels, D., 2006.An analysis of the impact of the schistosomiasis control programme in Brazil. Mem. Inst. Oswaldo Cruz 101 (Suppl. 1), 79–85.
Anselin, L., 1995.Local indicators of spatial association—LISA. Geogr. Anal. 27, 93–115.
Assunção, R.M., Barreto, S.M., Guerra, H.L., Sakurai, E., 1998.Maps of epidemiological rates: a Bayesian approach. Cad Saude Publica 14 (4), 713–723.
Bergquist, R., Yang, G.J., Knopp, S., Utzinger, J., Tanner, M., 2015.Surveillance and response: tools and approaches for the elimination stage of neglected tropical dis-eases. Acta Trop. 141, 229–234.
Braz, S.C., Melo, M.F., Lorena, V.M., Souza, W.V., Gomes, Y.N., 2011.Chagas disease in the state of Pernambuco, Brazil: analysis of admissions and mortality time series. Rev. Soc. Bras. Med. Trop. 44 (3), 318–323.
Cliff, A.D., Ord, J.K., 1981.Spatial Processes: Models & Applications. Pion Ltd., London.
da Nóbrega, A.A., de Araújo, W.N., Vasconcelos, A.M., 2014.Mortality due to Chagas disease in Brazil according to a specific cause. Am.J.Trop. Med. Hyg. 91 (3), 528–533.
Hotez, P.J., 2008.The giant anteater in the room: Brazil's neglected tropical diseases problem. PLoS Negl. Trop. Dis. 2 (1), e177.
Hotez, P.J., 2014.Ten global“hotspots”for the neglected tropical diseases. PLoS Negl. Trop. Dis. 8 (5), e2496.
Hotez, P.J., Fujiwara, R.T., 2014.Brazil's neglected tropical diseases: an overview and a report card. Microbes Infect. 16 (8), 601–606.
Hotez, P.J., Mistry, N., Rubinstein, J., Sachs, J.D., 2011.Integrating neglected tropical diseases into AIDS, tuberculosis, and malaria control. N. Engl. J. Med. 364 (22), 2086–2089.
Instituto Brasileiro de Geografia e Estatística (IBGE), 2014. População Residente—Brasil. Instituto Brasileiro de Geografia e Estatística, Rio de Janeiro (bhttp://tabnet. datasus.gov.br/cgi/deftohtm.exe?ibge/cnv/popuf.defN).
Kim, H.J., Fay, M.P., Feuer, E.J., Midthune, D.N., 2000.Permutation tests for joinpoint regression with applications to cancer rates. Stat. Med. 19 (3), 335–351.
Kulldorff, M., 1997.A spatial scan statistic. Commun. Stat. Theory Methods 26 (6), 1481–1496.
Kulldorff, M., Nagarwalla, N., 1995.Spatial disease clusters: detection and inference. Stat. Med. 14 (8), 799–810.
Lindoso, J.A., Lindoso, A.A., 2009.Neglected tropical diseases in Brazil. Rev. Inst. Med. Trop. Sao Paulo 51 (5), 247–253.
Martins-Melo, F.R., Alencar, C.H., Ramos Jr., A.N., Heukelbach, J., 2012a.Epidemiology of mortality related to Chagas' disease in Brazil, 1999–2007. PLoS Negl. Trop. Dis. 6 (2), e1508.
Martins-Melo, F.R., Ramos Jr., A.N., Alencar, C.H., Lange, W., Heukelbach, J., 2012b.Mortality of Chagas' disease in Brazil: spatial patterns and definition of high-risk areas. Tropical Med. Int. Health 17 (9), 1066–1075.
Martins-Melo, F.R., Ramos Jr., A.N., Alencar, C.H., Heukelbach, J., 2012d.Multiple causes of death related to Chagas' disease in Brazil, 1999 to 2007. Rev. Soc. Bras. Med. Trop. 45 (5), 591–596.
Martins-Melo, F.R., Pinheiro, M.C,., Ramos Jr., A.N., Alencar, C.H., Bezerra, F.S., Heukelbach, J., 2014a.Trends in schistosomiasis-related mortality in Brazil, 2000–2011. Int J Parasitol. 44 (14), 1055–1062.
Martins-Melo, F.R., Lima, M.S., Ramos Jr., A.N., Alencar, C.H., Heukelbach, J., 2014b.Mortality and case fatality due to visceral leishmaniasis in Brazil: a nationwide anal-ysis of epidemiology, trends and spatial patterns. PLoS ONE 9 (4), e93770.
Martins-Melo, F.R., Ramos Jr., A.N., Alencar, C.H., Heukelbach, J., 2014c.Prevalence of Chagas disease in Brazil: a systematic review and meta-analysis. Acta Trop. 130, 167–174.
Martins-Melo, F.R., Lima, M.S., Ramos Jr., A.N., Alencar, C.H., Heukelbach, J., 2014d.Prevalence of Chagas disease in pregnant women and congenital transmission of Trypanosoma cruzi in Brazil: a systematic review and meta-analysis. Tropical Med. Int. Health 19 (8), 943–957.
Martins-Melo, F.R., Assunção-Ramos, A.V., Ramos Jr., A.N., Alencar, C.H., Montenegro Jr., R.M., Wand-Del-Rey de Oliveira, M.L., Heukelbach, J., 2015a.Leprosy-related mortality in Brazil: a neglected condition of a neglected disease. Trans. R. Soc. Trop. Med. Hyg. 109 (10), 643–652.
Martins-Melo, F.R., Pinheiro, M.C., Ramos Jr., A.N., Alencar, C.H., Bezerra, F.S., Heukelbach, J., 2015b.Spatiotemporal patterns of schistosomiasis-related deaths, Brazil, 2000–2011. Emerg. Infect. Dis. 21 (10), 1820–1823.
Martins-Melo, F.R., Alencar, C.H., Ramos Jr., A.N., Heukelbach, J., 2016a.Mortality from Neglected Tropical Diseases in Brazil, 2000–2011. Bull. World Health Organ. 94,
103–110.
Martins-Melo, F.R., Ramos Jr., A.N., Cavalcanti, M.G., Alencar, C.H., Heukelbach, J., 2016b.Neurocysticercosis-related mortality in Brazil, 2000–2011: epidemiology of a
neglected neurologic cause of death. Acta Trop. 153, 128–136.
Ministério da Saúde do Brasil, 2012.Integrated plan of strategic actions to eliminate leprosy, filariasis, schistosomiasis and onchocerciasis as a public health problem, trachoma as a cause of blindness and control of geohelmintiases: action plan 2011–2015. Ministério Da Saúde do brasil, Brasília.
Ministério da Saúde do Brasil, Departamento de Informática do Sistema Único de Saúde, Sistema de Informações Sobre Mortalidade (SIM), Ministério da Saúde do Bra-sil, Brasília, 2014.bhttp://tabnet.datasus.gov.br/cgi/sim/dados/cid10_indice.htmN.
Nascimento, G.L., de Oliveira, M.R., 2014.Severe forms of schistosomiasis mansoni: epidemiologic and economic impact in Brazil, 2010. Trans. R. Soc. Trop. Med. Hyg. 108 (1), 29–36.
Ostermayer, A.L., Passos, A.D., Silveira, A.C., Ferreira, A.W., Macedo, V., Prata, A.R., 2011.The national survey of seroprevalence for evaluation of the control of Chagas disease in Brazil (2001–2008). Rev. Soc. Bras. Med. Trop. 44 (Suppl. 2), 108–121.
Paixão, E.S., Costa, M.C., Rodrigues, L.C., Rasella, D., Cardim, L.L., Brasileiro, A.C., et al., 2015.Trends and factors associated with dengue mortality and fatality in Brazil. Rev. Soc. Bras. Med. Trop. 48 (4), 399–405.
Ramos Jr., A.N., Martins-Melo, F.R., Barbosa, J.C., Heukelbach, J., 2010.The role of operational research and the challenges for integration of care and control of Chagas disease in the Brazilian Unified Health System. Rev. Soc. Bras. Med. Trop. 43 (Suppl. 2), 12–17.
Santo, A.H., 2009.Chagas disease-related mortality trends, state of São Paulo, Brazil, 1985 to 2006: a study using multiple causes of death. Rev. Panam. Salud. Publica 26 (4), 299–309.
Silveira, A.C., 2011.Entomological survey (1975–1983). Rev. Soc. Bras. Med. Trop. 44 (Suppl. 2), 26–32.
Silveira, A.C., Silva, G.R., Prata, A., 2011.Seroprevalence survey of human Chagas' infection (1975–1980). Rev. Soc. Bras. Med. Trop. 44 (Suppl. 2), 33–39.
Uniting to Combat NTDs, 2012. The London Declaration on Neglected Tropical Diseases. (https://www.gov.uk/government/uploads/system/uploads/attachment_data/ file/67443/NTD_20Event_20-_20London_20Declaration_20on_20NTDs.pdfN).
WHO, 2010.Working to Overcome the Global Impact of Neglected Tropical Diseases: First WHO Report on Neglected Tropical Diseases. World Health Organization, Geneva.
WHO, 2012.Accelerating Work to Overcome the Global Impact of Neglected Tropical Diseases—A Roadmap for Implementation. World Health Organization, Geneva. WHO, 2013.Sustaining the Drive to Overcome the Global Impact of Neglected Tropical Diseases: Second WHO Report on Neglected Tropical Diseases. World Health
Organization, Geneva.
WHO, 2014a. Neglected Tropical Diseases. World Health Organization, Geneva (bhttp://www.who.int/neglected_diseases/diseases/en/N).
WHO, Statistical Classification of Diseases and Related Health Problems (ICD), 10th Revision, World Health Organization, Geneva, 2014b.bhttp://apps.who.int/ classifications/apps/icd/icd10onlineN.