1Depto. de Engenharia Agrícola/UFC, Campus do Pici, Bloco 804, Fortaleza, CE, Brazil, 60455-760; 2 Depto. Ciências do Solo/
UFC; 3Lab. Fisiol. Vegetal, Depto. Bioq. e Biol. Molecular/UFC. 4 CNPAT/Embrapa Agroindústria Tropical. *Corresponding
author: cfeitosa@ufc.br
Morpho-physiological responses of cowpea leaves to salt
stress
Claudivan F. Lacerda
1*, José O. Assis Júnior
1, Luiz C. A. Lemos Filho
1, Teógenes S. de Oliveira
2,
Francisco V.A. Guimarães
2, Enéas Gomes-Filho
3, José T. Prisco
3and Marlos A. Bezerra
4Respostas morfofisiológicas de folhas de feijão-de-corda ao estresse salino: Neste trabalho estudou-se a influência do estresse salino sobre as respostas morfológicas e fisiológicas de diferentes tipos de folhas de plantas de feijão-de-corda [Vigna unguiculata (L.) Walp.], buscando-se entender o processo de aclimatação da planta ao estresse salino. Sementes selecionadas foram semeadas em vermiculita e, após 7 d as plântulas foram transferidas para bandejas de plástico contendo solução nutritiva, e mantidas em casa de vegetação. Após a emergência do primeiro trifólio, as plantas foram transferidas para vasos contendo 3 L de solução nutritiva, deixando-se apenas uma planta por vaso. Utilizou-se um tratamento-controle (sem adição de NaCl) e um salino (75 mmol L-1 de NaCl), iniciando-se a adição parcelada do NaCl (25 mmol L-1 por dia) 5 d após o
transplantio para os vasos. Durante o período experimental, foram realizadas, na folha primária e nas 1a, 2a e 3a folhas
trifolioladas a partir da base da planta, as seguintes avaliações: área foliar, grau de suculência, massa específica, teores de íons, teor de clorofila e a taxa fotossintética líquida. No final do período experimental foram feitas as análises de crescimento da planta inteira. A salinidade não afetou a taxa fotossintética líquida, porém reduziu a produção de matéria seca e o número de ramos laterais. Os teores de Na, Cl, K e P aumentaram nas folhas de plantas estressadas, porém essas repostas foram especialmente influenciadas pelo tempo e pela idade da folha. Os maiores teores de Na e Cl nas folhas mais velhas podem contribuir para reduzir o acúmulo desses íons nas partes em crescimento, porém a tendência de acúmulo de K e P em folhas de plantas estressadas pode ser conseqüência da redução na retranslocação, não contribuindo para a aclimatação da planta ao estresse. Por outro lado, a salinidade aumentou a relação fonte/dreno, a suculência, a massa específica e o teor de clorofila por unidade de área foliar, sugerindo que essas mudanças observadas podem constituir parte de um processo integrado de aclimatação da planta ao estresse.
Palavras-chave: aclimatação, fotossíntese,partição de fotoassimilados, salinidade, teores de íons
The effect of salt stress of known intensity and duration on morpho-physiological changes in leaves of different ages from cowpea [Vigna unguiculata (L.) Walp.] plants was studied, aiming for a better understanding of the acclimation process of the whole-plant. Seeds were sown in vermiculite and seedlings were transferred to plastic trays containing aerated nutrient solution, and kept in a greenhouse. When the first trifoliate leaf emerged the seedlings were transplanted into 3 L plastic pots containing aerated nutrient solution. Salt additions started 5 d later, and the salt-treated plants received 25 mmol L-1 per day
until reaching a final concentration of 75 mmol L-1. During the experimental period primary leaves and the 1st, 2nd, and 3rd
trifoliate leaves were used for measurements of net photosynthesis, leaf area, leaf succulence, specific leaf mass, ions and chlorophyll concentrations. Growth analysis of the whole-plant was performed at the end of the experimental period. Salinity did not affect net photosynthesis, but reduced dry mass production and the number of lateral branches. Leaf concentrations of Na+, Cl-, K+ and P increased in salt-stressed plants, but these responses were dependent upon stress duration and leaf age.
The higher concentration of potentially toxic ions (Na+ and Cl-) in older leaves could contribute to the reduced ion
accumulation in growing tissues, but the tendency of K and P accumulation in leaves appeared to be the result of reduced re-translocation, i.e., not related to plant acclimation. Salinity also increased the source/sink ratio, leaf succulence, specific leaf mass, and chlorophyll accumulation per unit of leaf area, suggesting that the observed changes could be part of an integrated mechanism of whole-plant acclimation to salt stress.
INTRODUCTION
Soil salinity is regarded as being responsible for the reduction in plant growth and yield in arid and semi-arid regions of the world (Gheyi, 2000; Munns, 2002). Salt stress reduces shoot growth and leaf expansion (Bernstein et al., 1993) through both osmotic effects that provoke water deficit and specific ion effects that may cause toxicity and mineral deficiency (Greenway and Munns, 1980; Bernstein et al., 1995).
The mechanisms for salt tolerance are complex and depend upon anatomical and physiological changes occurring in the whole-plant rather than on a single cell. Therefore, the knowledge of the mechanisms of whole-plant acclimation could help whole-plant breeders in the establishment of selection parameters for the development of more salt-tolerant genotypes (Noble and Rogers, 1992). Cowpea (Vigna unguiculata) is a crop extensively grown in Northeast Brazil, both under irrigation and dry-farming conditions. Although cowpea is considered moderately salt tolerant (Ayers and Westcot, 1999), the physiological mechanisms responsible for its tolerance or sensitivity are not completely understood. Some responses of cowpea seedlings grown under salt stress have already been observed, and it is known that there is a delay in germination and seedling establishment as a result of salinity (Gomes-Filho et al., 1983; Sousa et al., 2003) related to changes in enzymatic activity (Gomes-Filho et al., 1983) and in gene expression (Sousa et al., 2003). In addition, there are changes in mineral accumulation (Cos-ta et al., 2003) and other physiological processes (Silva et al., 2003b).
The whole-plant acclimation to salt stress is considered an integrated response of different organs, especially roots and leaves (Munns, 2002). Although the roots constitute the primary barrier to salt uptake, leaves have received more attention from researchers, because they are the sites of carbon assimilation and, therefore, more directly related to plant growth and development. Some results have shown that most of the physiological and biochemical changes in the leaves are related to stress intensity or duration (Flowers, 2004), others to leaf age (Lacerda et al., 2003; Silva et al., 2003b), but in most studies these aspects have not been considered. This has led to conflicting results and interpretations, which makes difficult understanding the importance of leaf
physiology and morphology on whole-plant salt tolerance. Therefore, the objective of this paper was to explore the effects of salt stress of known intensity and duration on morpho-physiological changes in leaves of different ages, aiming for a better understanding of the acclimation process of the whole-plant.
MATERIAL AND METHODS
Plant material and growth conditions: The experiment was conducted in a greenhouse during the summer season (December and January) in Fortaleza (3o45S,
38o33W), Ceará State, Brazil. The duration of the light
period was around 12 h, and the average and maximal irradiance inside the greenhouse were approximately 1000 and 1600 µmol m-2 s-1, respectively. During the
experimen-tal period mean air temperature and relative humidity inside the greenhouse were 29 ± 5ºC and 63.5 ± 12.5%,
respectively.
Pitiuba cowpea (Vigna unguiculata (L.) Walp.) seeds were germinated in vermiculite. Seven days later, seedlings were transferred to plastic trays containing diluted (1/4 strength) and aerated Hoagland nutrient solution. Seedlings were grown for 5 d under these conditions and individuals whose first trifoliate leaf had emerged were transplanted into 3 L plastic pots containing aerated Hoagland nutrient solution (3/4 strength), and grown under the same environmental conditions.
Forty plants were divided into two equal lots and assigned to two treatments: nutrient solutions with 0 (control treatment) and 75 mmol L-1 of NaCl (saline
treatment). Salt (NaCl) additions to the nutrient solution started 5 d after plants were transplanted into the plastic pots, i.e. when the first trifoliate leaf had reached its full size and the second trifoliate leaf was starting its development. Salt was added into the nutrient solution stepwise (25 mmol L-1 d-1) until reaching 75 mmol L-1 as
final concentration. Nutrient solution level was maintained constant throughout the experimental period by adding distilled water, and its pH was kept at 5.5 by adding 0.1 N KOH or HCl. Nutrient solutions were replaced every 5 d, when the amount of salt added in the salt-stress treatment was restored in each pot.
leaves 1, 2 and 3 (1st, 2nd and 3rd leaves from the stem base,
respectively) were harvested and used to perform the following measurements: leaf area, fresh mass, dry mass, Na+, K+, Cl-, P and chlorophyll concentrations, and net
photosynthesis. At each harvest the leaves were taken from five independent plants per treatment, and the rest of plant material was discarded (except for the last harvest). After measuring leaf area, using a Li-Cor area meter (LI-3000, Li-Cor., Lincoln, USA), the fresh mass of the different leaves was determined, and then they were dried in a forced air circulation oven at 60oC for 72 h.
These data were used to estimate specific leaf mass (dry mass per leaf area) and leaf succulence [(fresh mass dry mass)/leaf area], according to Mantovani (1999).
At the 24t h d from the start of salt additions (last
harvest) plants were harvested and the following measurements were made: number of leaves on the main stem, number of lateral branches, dry mass of stems, leaves and roots, and total leaf area. Dry mass partitioning between the different vegetative organs was also estimated.
Sodium, K+, and P were extracted from 150 mg of dry
leaf material by adding 15 mL of 1 N HCl, agitating the mixture during 1 h, and filtering it through filter paper (Miyazawa et al., 1984). The concentrations of Na+ and K+
in this extract were determined by flame photometry and the total P concentration was determined by a colorimetric method (Malavolta et al., 1989). Chloride (Cl
-) was also extracted from dry plant material in an aqueous medium and its concentration was determined by visible spectrophotometry, according to Gaines et al. (1984).
Chlorophyll concentration was determined according to Arnon (1949). Net photosynthesis measurements were performed using an infrared gas analyzer IRGA (LCA-2,
ADC, Hoddesdon, UK), in an open system. These measurements were made between 1000 h and 1200 h, at 28 ± 2°C, relative humidity of 60 ± 10%, and under saturating photosynthetic active radiation (~1500 µmol m-2 s-1).
Experimental design and statistical analysis:The expe-rimental design was completely randomized, with five replicates per harvest per treatment. The data were subjected to analysis of variance, and the means were compared by Tukeys test at 1 and 5% probability. When appropriate, data were subjected to regression analysis. The statistical analysis was performed using the software SAEG/UFV (Ribeiro Júnior, 2001).
RESULTS
Growth and dry mass partitioning: Table 1 shows the growth parameters measured at the end of the experimen-tal period. Salinity did not affect the number of leaves on the main stem, but reduced the number of lateral branches, total leaf area, and dry mass production of the different plant organs. The changes in dry mass between the two treatments showed that salinity reduced total plant dry mass by about 32% (from 44.6 to 30.2 g). However, this reduction was not equally distributed among the different plant organs. In control plants, about 38% of dry matter was partitioned to leaves, 45% to stems and 17% to roots, against 41%, 42%, and 17% respectively for leaves, stems and roots of salt-stressed plants. As a result, salt stress provoked an increase of about 14% in the ratio (dry mass) of leaves/stems + roots, suggesting an alteration in the source/sink ratio.
Figure 1 shows that the effect of salt stress on leaf growth was dependent upon time of stress and leaf age. Salinity did not affect growth of primary leaves because
Table 1. Growth parameters of cowpea plants grown for 24 d in nutrient solutions containing two NaCl concentrations, 0 (control) or 75 mmol L-1 (saline). NL = number of leaves on the main stem; NB = number of lateral branches; TLA = total
leaf area; mass of petioles is included in mass of stems. Means followed by the same letter in columns do not differ significantly (Tukeys test, P > 0.05); n = 5
Control 13.3 a 7.5 a 0.84 a 20.1 a 7.5 a 17.0 a 44.6 a 0.61 b
Saline 12.6 a 4.8 b0.46 b 12.7 b 5.1 b 12.4 b30.2 b 0.70 a
Treatment NL NB TLA (m2)
Dry mass (g)
Stems Roots Leaves Total
they were already fully expanded when treatments were imposed. Salinity reduced leaf expansion of the first, second and third trifoliate leaves throughout the experi-mental period. This effect was exacerbated on the third trifoliate leaf, which developed after the nutrient solution of the salt treatment had reached 75 mmol L-1 of NaCl. In
trifoliate leaf 3, salinity, in addition to inhibiting leaf expansion, also delayed its emergence (data not shown).
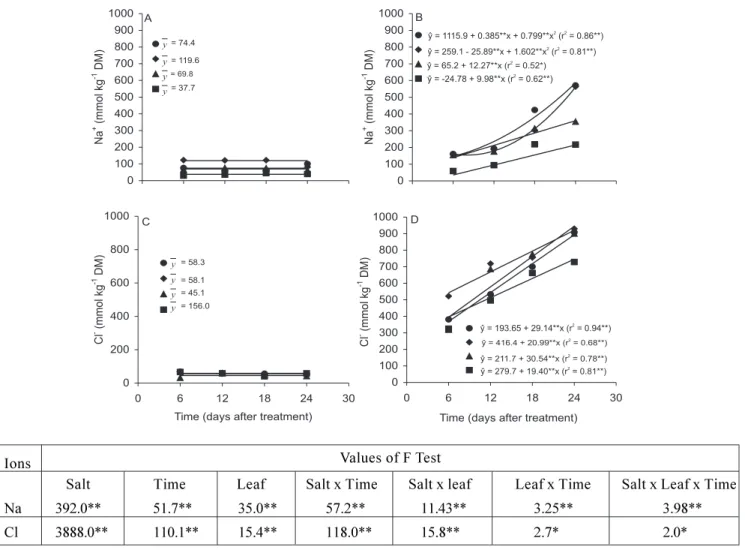
Leaf ion concentration: In general, mineral concentrations were affected by salt treatment and this effect was dependent on both time of stress and leaf type (Figures 2 and 3). In control plants, Na+ and Cl
-concentrations in all types of leaves did not vary significantly along the experimental period (Figure 2).
However, their concentrations increased significantly in all types of leaves with time of exposure to salt. In gene-ral, the increases in leaf Na+ and Cl- concentration were
higher in older than in younger leaves.
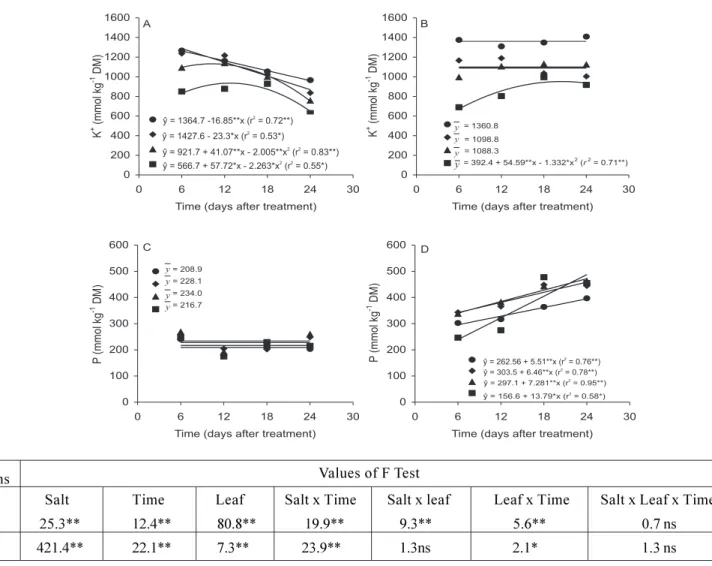
Changes in K+ concentration during the experimental
period were affected by leaf age, time of stress, and salt concentration in the nutrient solution (Figure 3). In control leaves K+ concentration tended to decrease along
the experimental period, but this appeared largely related to leaf age; such a decrease started at 6, 12 and 18 d after applying treatments, respectively in older leaves (primary and trifoliate 1), intermediate leaf (trifoliate 2), and younger leaf (trifoliate 3). On the other hand, in leaves of salt-treated plants K+ concentration did not change in
Salt Time Leaf Salt x Time Salt x leaf Leaf x Time Salt x Leaf x Time 315.5** 198.7** 783.9** 5.96** 40.5** 126.7** 2.2*
Values of F Test
Figure 1. Leaf area of primary leaf (A) and trifoliate 1 (B), 2 (C), and 3 (D) of cowpea plants grown in nutrient solutions containing two NaCl concentrations, 0 (D) or 75 mmol L-1 ( ), at different times along the experimental period. *Statistically
significant (P < 0.05); **Statistically significant (P < 0.01); n = 5. p
0.00 0.01 0.02 0.03 0.04
0 6 12 18 24 30
Leaf
A
rea
(m
2)
A
= 0.0095 = 0.0099
y y
0.00 0.01 0.02 0.03 0.04
0 6 12 18 24 30
Leaf
A
rea
(m
2) = 0.016
B
= 0.019
y
y
0.00 0.01 0.02 0.03 0.04
0 6 12 18 24 30
Time (days after treatment)
Leaf
A
rea
(m
2)
? = 0.0209 + 0.00027**x (r2 = 0.67*)
? = 0.0083 + 0.0013**x - 0.000040*x2 (r2= 0.67*)
C
0.00 0.01 0.02 0.03 0.04
0 6 12 18 24 30
Time (days after treatment)
Leaf
A
rea
(m
2)
? = 0.0123 + 0.0048**x - 0.00012**x2 (r2= 0.85**)
? = 0.0216 + 0.0055**x - 0.000150*x2 (r2= 0.93**)
D
ŷ = 0.0209 + 0.00027**x (r2= 0.67*)
ŷ = 0.0083 + 0.0013**x - 0.000040*x ( = 0.67*)
2 2
r
ŷ = 0.0123 + 0.0048**x -0.00012**x ( = 0.85**)2 2
r
primary and in trifoliate (1 and 2) leaves, but tended to increase in the younger leaf as the time of stress increased. Differences in leaf K+ concentrations were
found to be time dependent when comparing control and salt-stressed plants at each measurement: after 6 d of salt stress, K+ concentrations in trifoliates 1, 2 and 3 were
higher in control than in stressed plants, but an opposite response was observed after 24 d (last observation) of salt stress.
Leaf phosphorus concentration from control plants did not differ significantly among the different types of leaves, and along the experimental period (Figure 3). However, leaf P concentrations from salt-stressed plants increased linearly until the end of experimental period. After 24 d of treatment application, P concentrations from
salt-treated leaves were double those from control leaves. The increase in P concentration was propor-tionally higher in trifoliate 3, which started its development after the plants had been exposed to 75 mmol L-1 of NaCl in the nutrient solution.
Leaf succulence and specific leaf mass: Leaf succulence increased in trifoliate leaves 2 and 3 of control plants, especially between 6 and 18 d after treatment imposition, and was kept relatively constant throughout the experi-mental period in the other leaves (Figure 4). However, salt-stressed leaves showed progressive increases in succulence with the time of exposure to salt, and after 18 d of stress these values were higher than in control plants. The highest and the lowest values of leaf
Salt Time Leaf Salt x Time Salt x leaf Leaf x Time Salt x Leaf x Time Na 392.0** 51.7** 35.0** 57.2** 11.43** 3.25** 3.98** Cl 3888.0** 110.1** 15.4** 118.0** 15.8** 2.7* 2.0*
Ions Values of F Test
0 100 200 300 400 500 600 700 800 900 1000
0 6 12 18 24 30
Na +(mmol k g -1 DM) = 74.4 = 37.7 = 69.8 = 119.6 A y y y y 0 100 200 300 400 500 600 700 800 900 1000
0 6 12 18 24 30
Na + (mmol k g -1 DM)
? = -24.78 + 9.98**x (r2= 0.62**) ? = 65.2 + 12.27**x (r2= 0.52*) ? = 259.1 - 25.89**x + 1.602**x2
(r2= 0.81**) ? = 1115.9 + 0.385**x + 0.799**x2
(r2= 0.86**) B 0 200 400 600 800 1000
0 6 12 18 24 30
Time (days after treatment)
Cl -(mmol k g -1 DM) = 156.0 = 45.1 = 58.1 = 58.3 C y y y y 0 100 200 300 400 500 600 700 800 900 1000
0 6 12 18 24 30
Time (days after treatment)
Cl - (mmol k g -1 DM)
? = 279.7 + 19.40**x (r2= 0.81**) ? = 211.7 + 30.54**x (r2= 0.78**) ? = 416.4 + 20.99**x (r2= 0.68**) ? = 193.65 + 29.14**x (r2= 0.94**) D
ŷ = 1115.9 + 0.385**x + 0.799**x (r = 0.86**)2 2 ŷ = 259.1 - 25.89**x + 1.602**x (r = 0.81**)2 2 ŷ = 65.2 + 12.27**x (r = 0.52*)2
ŷ = -24.78 + 9.98**x (r = 0.62**)2
ŷ = 193.65 + 29.14**x (r = 0.94**)2
ŷ = 416.4 + 20.99**x (r = 0.68**)2 ŷ = 211.7 + 30.54**x (r = 0.78**)2 ŷ = 279.7 + 19.40**x (r = 0.81**)2
Figure 2. Sodium and chloride concentrations of primary leaf ( ) and trifoliate 1 (♦), 2 ( ), and 3 ( ) of cowpea plants
grown in nutrient solutions containing two NaCl concentrations, 0 (A,C) or 75 mmol L-1 (
B,D), at different times along the
Salt Time Leaf Salt x Time Salt x leaf Leaf x Time Salt x Leaf x Time K 25.3** 12.4** 80.8** 19.9** 9.3** 5.6** 0.7 ns P 421.4** 22.1** 7.3** 23.9** 1.3ns 2.1* 1.3 ns
Ions Values of F Test
Figure 3. Potassium and phosphorus concentrations of primary leaf ( ) and trifoliate 1 ( ), 2 ( ), and 3 ( ) of cowpea plants grown in nutrient solutions containing two NaCl concentrations, 0 (A,C) or 75 mmol L-1 (
B,D), at different times along the experimental period. ns, non significant (P > 0.05); *Statistically significant (P < 0.05); ** Statistically signi-ficant (P < 0.01); n = 4.
p t
succulence were observed in older (primary) and in younger (trifoliate 3) leaves, respectively. The relative increases in leaf succulence as a function of time of stress were higher in younger than in older leaves.
Specific leaf mass did not show an increasing or decreasing tendency in control or salt stressed plants, considering the values obtained between 6 and 24 d after treatment application (Table 2). However, there were significant increases in specific leaf mass in the initial period of salt stress especially for trifoliate leaves 1, 2, and 3, and these values remained higher than those observed in control plants (Table 2). On the other hand, a direct relationship between specific leaf mass and leaf age was not found.
Chlorophyll concentration and rate of photosynthesis: Leaf chlorophyll concentration on a fresh mass basis did not differ between control and salt-stressed plants at both 12 and 24 d from the beginning of salt additions (Table 3). Salinity did not affect chlorophyll concentrations on an area basis in older leaves (primary and trifoliate 1) at day 12, but did increase it in younger leaves (trifoliate 2 and 3). However, by the end of the experiment (at day 24) the chlorophyll concentrations in all types of leaves from salt-stressed plants were higher than in leaves from the control treatment. A tendency for decreasing chlorophyll concentration, regardless of whether expressed on mass or area bases, in each type of leaf from day 12 to 24 after imposing treatments was also found.
0 200 400 600 800 1000 1200 1400 1600
0 6 12 18 24 30
Time (days after treatment)
K
+ (mmol
kg
-1 DM)
? = 566.7 + 57.72*x - 2.263*x2( r2= 0.55*) ? = 921.7 + 41.07**x - 2.005**x2(
r2= 0.83**) ? = 1427.6 - 23.3*x (r2= 0.53*)
? = 1364.7 -16.85**x (r2= 0.72**)
A 0 200 400 600 800 1000 1200 1400 1600
0 6 12 18 24 30
Time (days after treatment)
K + (mmol kg -1 DM) = 1088.3 = 1098.8 = 1360.8
? = 392.4 + 54.59**x - 1.332*x2( r2= 0.71**)
B y y y 0 100 200 300 400 500 600
0 6 12 18 24 30
Time (days after treatment)
P( m m o lk g
-1 DM) = 216.7
= 234.0 = 228.1 = 208.9 C y y y y 0 100 200 300 400 500 600
0 6 12 18 24 30
Time (days after treatment)
P( m m o lk g -1 DM)
? = 156.6 + 13.79*x (r2= 0.58*) ? = 297.1 + 7.281**x (r2= 0.95**) ? = 303.5 + 6.46**x (r2= 0.78**) ? = 262.56 + 5.51**x (r2= 0.76**)
D ŷ = 1364.7 -16.85**x (r = 0.72**)2
ŷ = 1427.6 - 23.3*x (r = 0.53*)2
ŷ = 566.7 + 57.72*x - 2.263*x (r = 0.55*)2 2
ŷ = 921.7 + 41.07**x - 2.005**x (r = 0.83**)2 2
Salt Time Leaf Salt x Time Salt x leaf Leaf x Time Salt x Leaf x Time 147.3** 98.2** 209.9** 35.4** 5.5** 7.6** 0.7*
Values of F Test
Figure 4. Leaf succulence of primary leaf ( ) and trifoliate 1 (♦), 2 ( ), and 3 ( ) of cowpea plants grown in nutrient
solutions containing two NaCl concentrations, 0 (A) or 75 mmol L-1 (
B), at different times along the experimental period.
ns, non significant (P > 0.05); *Statistically significant (P < 0.05); **Statistically significant (P < 0.01); n = 5. p
Table 2. Specific leaf mass, as measured along the stress imposition period, of cowpea plants grown in nutrient solutions containing two NaCl concentrations, 0 (control) or 75 mmol L-1 (saline). Trifoliate leaves 1, 2 and 3 are respectively the
1st, 2nd and 3rd leaves from the stem base. Means followed by the same letter in columns, for each leaf type, do not differ
significantly (Tukeys test, P > 0.05); n = 5
Primary Control 25.1 a 28.1 a 24.8 b22.2 b
Saline 28.1 a 29.7 a 30.1 a 30.4 a
Trifoliate 1 Control 21.7 b24.1 b24.2 b22.9 b
Saline 26.3 a 28.2 a 29.2 a 27.3 a
Trifoliate 2 Control 19.5 b24.9 b22.4 b21.3 b
Saline 25.6 a 28.4 a 31.3 a 29.4 a
Trifoliate 3 Control 21.1 b23.1 b22.6 b21.2 b
Saline 30.0 a 27.5 a 27.9 a 31.5 a
Type of leaf Treatment Specific leaf mass (g DM m
-2)
6 d 12 d 18 d 24 d
Figure 5 shows the rate of net photosynthesis throughout the experimental period. Salinity did not affect the rate of photosynthesis in the different types of leaves. There was a tendency, observed for both control and salt-treated plants, for decreasing photosynthetic rates from day 7 to the end of the experiment, especially in older leaves. In trifoliate 2 the rate of photosynthesis did not differ between the first (7 d) and second (14 d) measurements, but decreased in about 40% for both
treatments at the last observation performed at 21 d after treatment application.
DISCUSSION
Salinity inhibition of shoot development and of leaf expansion (Table 1, Figure 1) has been observed for other plant species (Bernstein et al., 1993; Lacerda et al., 2003). In addition to reducing lateral branch emergence,
salt-0 50 100 150 200 250 300 350
0 6 12 18 24 30
Time (Days after treatment)
Leaf
succulence
(g
H2
Om
-2)
= 262.0 = 213.0
? = 155.2 + 6.87**x - 0.174*x2 (r2= 0.48*)
? = 116.6 + 7.03*x - 0.165*x2 (r2= 0.63*)
A
y y
0 50 100 150 200 250 300 350
0 6 12 18 24 30
Time (days after treatment)
Leaf
Succulence
(g
H2
Om
-2 )
? = 246.7 + 1.81**x (r2= 0.96**)
? = 182.8 + 3.72**x (r2= 0.77**)
? = 119.4 + 12.92** - 0.258*x2 (r2= 0.82**)
? = 127.86 + 5.48**x (r2= 0.92**)
B
ŷ = 246.7 + 1.81**x (r = 0.96**)2 ŷ = 182.8 + 3.72**x (r = 0.77**)2 ŷ = 119.4 + 12.92** - 0.258*x (r = 0.82**)2 2 ŷ = 127.86 + 5.48**x (r = 0.92**)2
Table 3. Leaf chlorophyll concentration of cowpea plants grown in nutrient solutions containing two NaCl concentrations, 0 (control) or 75 mmol L-1 (saline). Leaves
were analyzed at 12 and 24 d after salt treatment application. Means followed by the same letter in rows, for each leaf type and each basis for expressing chlorophyll concentration, do not differ significantly (Tukeys test, P > 0.05); n = 5
12 d
Primary 1.3 a 1.5 a 1169 a 1158 a
Trifoliate 1 1.5 a 1.7 a 574 a 669 a
Trifoliate 2 1.8 a 1.9 a 628 b751 a
Trifoliate 3 2.2 a 2.3 a 648 b745 a
24 d
Primary 0.8 a 0.9 a 331 b414 a
Trifoliate 1 1.4 a 1.4 a 473 b604 a
Trifoliate 2 1.5 a 1.8 a 544 b690 a
Trifoliate 3 1.8 a 1.9 a 565 b764 a
Chlorophyll concentration
Type of leaf
Control Saline Control Saline
g kg-1 FM g m-2
Figure 5. Net photosynthesis in leaves of cowpea plants grown in nutrient solutions containing two NaCl concentrations, 0 (A) or 75 mmol L-1 (
B), at different times along the experimental period. ns, non significant (P > 0.05); *Statistically significant (P < 0.05); ** Statistically significant (P < 0.01); n = 5. Bars represent SE.
Values of F Test
Salt Time Leaf Salt x Salt x Leaf x Salt x
0.5 ns 124.4** 48.1** 1.9 ns 1.3 ns 31.9** 4.2** Time leaf Time Leaf x Time
stressed plants produced proportionally more leaves than stems and roots, indicating an increase in source/ sink ratio. This difference in photoassimilate partitioning could be interpreted as a result of salt stress acclimation, apparently compensating for the considerable reduction in total leaf area used for carbon assimilation. These changes in source/sink ratio can also contribute to compensate the increase in metabolic cost, which are needed for plant acclimation to imposed stress (Munns, 2002).
Salt stress inhibited leaf growth, with the exception of primary leaves. Such an inhibition was related to developmental stages, i.e. younger leaves showed higher reduction in their final size (Figure 1). These results evidence a sensibility of leaf expansion to salt stress, which has been mainly associated with the osmotic component of salt stress (Munns, 2002). Trifoliate leaf 3, which developed after stress imposition, showed a slight delay in emergence (Figure 1), which had also been already observed for cowpea seedlings (Sousa et al., 2003) and for other plant species (Silva et al., 2003a). This delay in leaf emergence was not large enough to cause a reduction in number of leaves on the main stem, but
P
hot
os
ynt
he
si
s
(
µ
m
ol
m
-2 s -1)
P
hot
os
ynt
he
si
s
(
µ
m
ol
m
-2 s -1)
caused significant reduction in lateral branch emergence (Table 1). These changes in morphology can contribute to plant acclimation to salt stress, through the adjustment of leaf area to the water available (Taiz and Zeiger, 2002). Unfortunately, this could also result in a reduction of the number of reproductive branches and in plant yield.
potentially toxic ion accumulation, especially Na+, was
relatively small (Figure 2).
The reduction in K+ concentration is a common
response observed in plants subjected to NaCl stress, and it appeared to be related to an antagonistic relationship between K+ and Na+ on root surfaces during
the absorption process (Marschner, 1995). However, conflicting results have been produced, varying from salt-induced K+ accumulation (e.g., Silva et al., 2003b) to
reduction of shoot K+ concentration (e.g., Azevedo Neto
and Tabosa, 2000; Lacerda et al., 2003). The present results indicate that time of stress imposition and age of sampled leaf can produce different results and interpretations (Figure 3). For example, results obtained after 6 d of stress indicated reduction in K+ concentration
as a consequence of NaCl stress, while an opposite response was found at the end of experiment. It is important to note that these differences in K+
concentration can be related to differences in K+
re-translocation, which could be more intense in leaves of control plants, especially at the final period of cultivation. Therefore, this response is just a consequence of salt stress on plant growth and apparently unrelated to salt tolerance.
The increase in leaf P concentration resulting from salt stress is consistent with previous results obtained with mature and immature cowpea leaves (Silva et al., 2003b). In fact, salinity likely enhances P absorption (Roberts et al., 1984; Marschner, 1995; Navarro et al., 2001). However, toxic leaf P concentration can also be reached faster in plants grown in saline environments (Nieman and Clark, 1976; Grattan and Maas, 1984; Grattan and Grieve, 1999). On the other hand, P accumulation in salt-stressed plants could be a consequence of reduced translocation associated with a decreased demand for growth.
The increase in leaf succulence (Figure 4) could be considered an important morpho-physiological response that could help plant acclimation to salt stress by promoting a dilution of potentially toxic ions, therefore, reducing their negative effects (Larcher, 2000). The results showed increases in leaf succulence (Figure 4) and specific leaf mass (Table 2) in leaves growing during salt stress and in leaves already developed before stress application, but only leaf succulence was correlated to ion accumulation (data not shown), especially chloride,
as suggested by others (e.g., Strogonov, 1964; Zekri, 1991). The increase in specific leaf mass in fully expanded mature leaves suggest that this response could be directly associated with increase in mesophyll thickness, thus not being a response due simply to reduction in leaf growth and increased cell wall thickness (Wigharajah et al., 1975; Shannon et al., 1994; Costa et al., 2003).
Leaf chlorophyll accumulation per unit leaf area in salt-stressed plants (Table 3) could be another evidence of increasing mesophyll thickness associated with increase in leaf succulence and specific leaf mass. In this case, chlorophyll concentration (both on a mass and area basis) did not evidence the progress of leaf senescence, contrarily to what has been shown in other plant species (e.g., Prisco and OLeary, 1972; Lacerda et al., 2003). In the present study, chlorophyll concentration (on leaf area basis) decreased more in control than in salt-stressed plants along the experiment. This response could be associate with an increase in source/sink ratio in salt-stressed plants (Table 1), which could reduce re-mobilization of mobile substances, as K+ (Figure 3), and,
consequently, reducing the intensity of leaf senescence. Maintenance of photosynthesis rate in salt-stressed plants in comparison to controls (Figure 5), confirm previous observations that photosynthesis rate is less sensitive to salt stress than leaf growth (Bezerra et al., 2003). This response might be a consequence of several morpho-physiological responses (increases in leaf succulence, specific leaf weight, and leaf chlorophyll concentration per unit of leaf area), which partially reduce the deleterious effects of salt on important process like photosynthesis. In addition, changes in plant morphology, e.g. reduction in lateral branches (Table 1), could affect light availability for remaining leaves and promote leaf area adjustment to the water available during the time of cultivation.
The present results indicate that salinity alters leaf morphology and physiology of cowpea plants, and these alterations are dependent on stress duration and leaf age. Interactions (salt x time and salt x leaf age) were more evident for mineral concentrations, which could indicate that time of stress imposition and the age of the sampled leaf could be associated, at least partially, with different results and interpretations published. The higher concentration of potentially toxic ions (Na+ and Cl-) in
REFERENCES
Arnon DI (1949) Copper enzyme in isolated chloroplasts. Polyphenoloxidase in Beta vulgaris. Plant Physiol. 24:1-15. Ayers RS, Wescot DW (1999) A qualidade da água na
agricultura. UFPB, Campina Grande.
Azevedo Neto AD, Tabosa JN (2000) Estresse salino em plântulas de milho: Parte II. Distribuição dos macronutrientes catiônicos e suas relações com sódio. Rev. Bras. Eng. Agríc. Ambient. 4:165-171.
Bernstein N, Silk WK, Läuchli A (1993) Growth and development of sorghum leaves under conditions of NaCl stress. Planta 191:433-439.
Bernstein N, Silk WK, Läuchli A (1995) Growth and development of sorghum leaves under conditions of NaCl stress: possible role of some mineral elements in growth inhibition. Planta 196:699-705.
Bezerra MA, Oliveira RA, Lacerda CF, Prisco JT, Gomes-Filho E (2003) Fotossíntese de plantas de cajueiro-anão precoce submetidas ao estresse salino. Proc. Interamer. Soc. Trop. Hort. 47:149-152.
Costa PHA, Silva JV, Bezerra MA, Enéas-Filho J, Prisco JT, Gomes-Filho E (2003) Crescimento e níveis de solutos orgânicos e inorgânicos em cultivares de Vigna unguiculata submetidos à salinidade. Rev. Bras. Bot. 26:289-297.
Flowers TJ (2004) Improving crop salt tolerance. J. Exp. Bot. 55:307-319.
Gaines TP, Parker MB, Gascho GJ (1984) Automated determination of chlorides in soil and plant tissue by sodium nitrate. Agron. J. 76:371-374.
Gheyi HJ (2000) Problemas de salinidade na agricultura irrigada. In: Oliveira TS, Assis Jr. RN, Romero RE, Silva JRC (eds), Agricultura, Sustentabilidade e o Semi-Árido, pp.329-346. Sociedade Brasileira de Ciências do Solo, Viçosa.
Gomes-Filho E, Prisco JT, Campos FAP, Enéas-Filho J (1983) Effects of NaCl salinity in vivo and in vitro on ribonuclease activity of Vigna unguiculata cotyledons during germination. Physiol. Plant. 59:183-188.
Grattan SR, Maas EV (1984) Interactive effects of salinity and substrate phosphate on soybean. Agron. J. 76:668-676. Grattan, SR, Grieve CM (1999) Salinity-mineral nutrition
relations in horticultural crops. Sci. Hort. 78: 127-157. Greenway H, Munns R (1980) Mechanisms of salt tolerance
in nonhalophytes. Annu. Rev. Plant Physiol. 31:149-190. Lacerda CF, Cambraia J, Cano MAO, Ruiz HA, Prisco JT
(2003) Solute accumulation and distribution during shoot and leaf development in two sorghum genotypes under salt stress. Environ. Exp. Bot. 49:107-120. Larcher W (2000) Ecofisiologia Vegetal. Rima Artes e
Textos, São Carlos.
Malavolta E, Vitti GC, Oliveira AS (1989) Avaliação do Estado Nutricional das Plantas: Princípios e Aplicações. Associação Brasileira para Pesquisa da Potassa e do Fosfato, Piracicaba.
Mantovani A (1999) A method to improve leaf succulence quantification. Braz. Arch. Biol. Technol. 42:9-14. Marschner H (1995) Mineral Nutrition of Higher Plants.
Academic Press, London.
Miyazawa M, Pavan MA, Bloch MFM (1984) Avaliação de métodos com e sem digestão para extração de elementos em tecidos de plantas. Ciênc. Cult. 36:1953-1958.
Munns R (2002) Comparative physiology of salt and water stress. Plant Cell Environ. 25:239-250.
Navarro JM, Botella MA, Cerda A, Martinez V (2001) Phosphorus uptake and translocation in salt-stressed melon plants. J. Plant Physiol. 158:375-381.
Nieman RH, Clark RA (1976) Interactive effects of salinity and phosphorus nutrition on the mature photo-synthesizing corn leaves. Plant Physiol. 57:157-161. Noble CL, Rogers ME (1992) Arguments for the use of
physiological criteria for improving the salt tolerance in crops. Plant Soil 146:99-107.
Prisco JT, OLeary JW (1972) Enhancement of intact bean leaf senescence by NaCl salinity. Physiol. Plant. 27:95-100. Ribeiro Júnior JI (2001) Análises Estatísticas no SAEG.
Editora UFV, Viçosa.
Roberts JKM, Linker CS, Benoit AG, Jardetzky O, Nieman RH (1984) Salt stimulation of phosphate uptake in maize root tips studies by 31P nuclear magnetic resonance.
Plant Physiol. 75:947-950.
Silva JV, Lacerda CF, Azevedo-Neto AD, Costa PHA, Prisco JT, Enéas-Filho J, Gomes-Filho E (2003a) Crescimento e osmorregulação em dois genótipos de sorgo forrageiro submetidos a estresse salino. Ciênc. Agron. 33:125-131. Silva JV, Lacerda CF, Costa PHA, Enéas-Filho J, Gomes-Filho E, Prisco JT (2003b) Physiological responses of NaCl stressed cowpea plants grown in nutrient solution supplemented with CaCl2. Braz. J. Plant Physiol. 15:99-105.
in growing tissues, but the trend of K and P accumulation in leaves appeared to be consequence of reduced retranslocation rather than associated with plant acclimation. On the other hand, salinity did increase the source/sink ratio, leaf succulence, specific leaf mass, and chlorophyll accumulation per unit leaf area, and these responses could be part of an integrated mechanism to whole-plant acclimation to salt stress.
Sousa MF, Campos FAP, Prisco JT, Enéas-Filho J, Gomes-Filho E (2003) Growth and protein pattern in cowpea seedlings subjected to salinity. Biol. Plant. 47:341-346. Strogonov BP (1964) Physiological basis of salt tolerance of plants. Program for Scientific Translations, Jerusalem. Taiz L, Zeiger E (2002) Plant Physiology. Sinauer
Associates, Massachusetts.
Wigharajah K, Jennings DH, Handley JF (1975) The effects of salinity on growth of Phaseolus vulgarias L. I. Anatomical changes in the first trifoliate leaf. Ann. Bot. 39:1029-1038.