Gonçalo João Pereira Pinheiro
The impact of currency shocks on
cross-border M&As
Dissertação de Mestrado
Mestrado em Finanças
Trabalho efetuado sob a orientação do
Professor Doutor Gilberto Ramos Loureiro
ii
Este é um trabalho académico que pode ser utilizado por terceiros desde que respeitadas as regras e boas práticas internacionalmente aceites, no que concerne aos direitos de autor e direitos conexos.
Assim, o presente trabalho pode ser utilizado nos termos previstos na licença abaixo indicada. Caso o utilizador necessite de permissão para poder fazer um uso do trabalho em condições não previstas no licenciamento indicado, deverá contactar o autor, através do RepositóriUM da Universidade do Minho.
Licença concedida aos utilizadores deste trabalho
Atribuição-NãoComercial CC BY-NC
iii
helpfulness, knowledge, constructive criticisms and patient. Without him, writing my master’s dissertation would be impossible and for this I will always be grateful.
I am grateful to all my family – my mother Ermelinda, my father Victor, my sister Carolina, my brother Manuel, and the rest of them I thank you for all the support, care and patience towards me.
Furthermore, I would like to thank my close friends who helped me in the bad times, gave me strength and encourage me to keep my focus in these last months. A special thanks to César, Abílio, Aurélio, Gato, Joca, Faria, Diana and Pedro for the friendship and advices in the last five years of my university. To my roommate and now friend, David. A word also to my freshmen who have become my friends in the last 2 years – I must thank them for their support, friendship and help. To every one of you, you are essential in my life and I thank you all for the immense support and friendship.
iv
I hereby declare having conducted this academic work with integrity. I confirm that I have not used plagiarism or any form of undue use of information or falsification of results along the process leading to its elaboration.
I further declare that I have fully acknowledged the Code of Ethical Conduct of the University of Minho.
v
O objetivo desta dissertação é analisar como os choques de moeda influenciam as fusões e aquisições transfronteiriças. A amostra é composta por 21,734 fusões e aquisições, tanto domésticas como transfronteiriças, feitas por empresas dos Estados Unidos, entre 2007 e 2017. O estudo examina se os adquirentes dos EUA tiram proveito de depreciações em moeda estrangeira para se envolver em mais fusões e aquisições em países estrangeiros. Os resultados indicam que, em média, isto não acontece. Com exceção do Brasil, não há evidências de que os adquirentes dos EUA adquiram mais empresas de países que sofreram um choque monetário negativo. No entanto, uma distância cultural maior diminui o volume de fusões e aquisições transfronteiriças quando acontece depreciação monetária. Os resultados também mostram que os compradores norte-americanos não se aproveitam das depreciações em moeda estrangeira para expandir os seus negócios para outras indústrias. Por fim, numa depreciação monetária, as empresas norte-americanas, ricas em dinheiro, aproveitam para comprar mais do que as empresas que não o são em aquisições internacionais.
Palavras-chave: aquisições de empresas em indústrias diferentes, depreciações de moeda, empresas ricas em dinheiro, fusões e aquisições
vi
The purpose of this dissertation is to analyse how currency shocks influence cross-border Mergers and Acquisitions. The sample is composed of 21,734 domestic and cross-border M&A deals made by US acquirers between 2007 and 2017. The study examines whether US acquirers take advantage of foreign currency depreciations to engage in more M&As in foreign countries. The results indicate that, on average, this is not the case. Except for Brazil, there is no evidence that US bidders acquire more targets from countries that have suffered a negative currency shock. Nevertheless, a greater cultural distance decreases the volume of cross-border M&As in a currency depreciation. The results also show that US acquirers do not take advantage of foreign currency depreciations to expand their businesses to other industries. Finally, in a currency depreciation, US cash-rich firms engage more than non-cash rich firms in cross-border acquisitions.
vii
1. Introduction ... 1
2. Literature Review ... 4
3. Hypotheses and Methodology ... 9
3.1. Hypotheses Development ... 9 3.2. Methodology ... 11 4. Data Description ... 14 4.1 Data availability ... 14 4.2 Sample Construction ... 14 4.3 Summary Statistics ... 17
5. Empirical Results and Discussion ... 21
5.1 Are target countries with a currency depreciation more likely to be acquired by a US company? ... 21
5.2 Do Bidders take advantage of currency depreciations to engage in conglomerate cross-border acquisitions? ... 28
5.3 Do cash-rich bidders take advantage of currency depreciation to make cash-based cross-based M&As? ... 32
6. Conclusion ... 36
7. References ... 38
8. Appendix ... 41
viii
Table 1 - Description of the Mergers and Acquisitions Sample ... 18
Table 2 - Distribution of the M&As by Acquirer's Industry ... 19
Table 3 - Summary Statistics ... 20
Table 4 - Impact of a currency depreciation in cross-border M&As ... 22
Table 5 - Impact of a currency depreciation in cross-border M&As for each specific group ... 24
Table 6 - Impact of geography, culture and shareholder protection in cross-border M&As during a currency depreciation ... 26
Table 7 - Impact of currency depreciation in conglomerate cross-border acquisitions ... 29
Table 8 - Impact of conglomerate cross-border M&As in a currency depreciation ... 31
Table 9 - Impact of a currency depreciation in cash-rich acquirers ... 33
Table 10 - Impact of cash-based M&As by cash-rich acquirers in a currency depreciation ... 35
LIST OF FIGURES Figure 1 - Description of M&A by year ... 20
1
1.
I
NTRODUCTIONMergers and acquisitions (M&As) from acquiring and target firms located in different countries are considered cross-border M&As. In the last decades the volume has grown considerably – from 23% of total merger volume to an impressive 45%. As Erel, Liao & Weisbach (2012) refer in their work, cross-border mergers occur for the same reasons as domestic ones – two firms, a target and an acquirer, will merge when in the perspective of the latter, their merger increases value.
The purpose of this dissertation is to analyse whether US firms engage in more cross-border acquisitions to take advantage of currency depreciations in other countries. Moreover, it aims at understanding the patterns of these acquisitions and how companies handle it – what changes when currency movements are considered. For instance, do firms engage in conglomerate M&As when a currency depreciation happens? Do cash-rich firms engage more in cross-border M&As than non-cash firms following a foreign depreciation? Do geographical and cultural proximity enhance the likelihood of cross-border M&As in the aftermath of a currency depreciation?
The determinants of Cross-Border Mergers and Acquisitions have been studied by some authors (Erel, Liao, & Weisbach, 2012). Some fundamental conclusions are found which are important for my starting point. Besides conclusions about mergers in countries with currency movements and differences in relative stock market, they also conclude that countries that are geographically closer have more chances to be involved in cross-border M&As. This finding is also supported by the results of another paper by Kedia & Panchapagesan (2004). For cultural proximity the findings from Ahren et al. (2015) shows that countries culturally distant experience smaller volume of cross-border M&As. I will examine the influence of geographic and cultural proximity in cross-border M&As across this dissertation.
Erel et al. (2012) also concludes that when the currency of a country depreciates the probability of a company from a foreign country acquire a company from this country is higher – this is because the assets in that country are relatively cheaper. Other studies were also essential to substantiate my research. Udomkerdmongkol, Morrisey, & Görg (2009) and Xing (2006) conclude that a devaluation in the currency of a country increases foreign direct investment as it lowers the cost of the investment.
2
Understanding the patterns and motivations of mergers and acquisitions between companies from different countries is an important study topic that only recently has attracted more attention from scholars and practitioners. I will focus in one important factor: the currency movements of the countries. Additionally, I will examine whether currency depreciations stimulate cross-border acquisitions within the same industry or in different industries. In other words, I will analyse if foreign bidders take advantage of a currency depreciation to consolidate a certain industry across countries or if they see it as an opportunity to diversify their businesses. Datta el al. (1992) suggest that non-conglomerate M&As are preferable for both acquirer and target; however Herger & McCorriston (2016) refer that conglomerate cross-border M&As are driven by financial arbitrage opportunities.
Harford (1999) find that cash-rich firms engage in more acquisitions than others. Pinkowitz, Sturgess, & Williamson (2013) find that cash-rich firms are 23% less likely to make cash bids. Following these findings tests about the method of payment of cash-rich firms in a currency depreciation are going to be undertaken. Additionally, I will compare if cash-rich firms engage more in cross-border M&As than non-cash rich firms in a period of a foreign depreciation.
In this study all M&A bidders are located in the United States. In other words when I am studying currency movements, I will test the foreign currency depreciation against the dollar.
Overall the results indicate that US acquirers do not take advantage of foreign currency depreciations to participate in in more cross-border M&As. Furthermore, there is no corroboration that, following a currency shock, bidders from the United States acquire more foreign targets, except for Brazil.
However, I find evidence that a greater cultural distance decreases the volume of M&As in a currency depreciation. Results for geographic distance were undertaken, with no statistically significative results. I also conclude that US bidders do not try to make conglomerate M&As in a currency shock, in an attempt of expanding their business.
US cash-rich firms do engage more than others in cross-border acquisitions following a depreciation although results for the method of payment of cash-rich firms in a currency depreciation are not statistically significative.
The remainder of this dissertation is organized as follows: In Section 2, Literature Review, I present and review relevant literature related to my main study topic; Section 3, Hypotheses and
3
Methodology, describes the hypotheses that I pretend to test, the models and methods that are going to be used during my investigation; Section 4, Data Description, I will explain the steps that I did in order to collect my data and the descriptive statistics about the study sample; In Section 5 the results obtained are discussed and Section 6 provides the most important conclusion for my dissertation; It is followed by Section 7, References, and Section 8, Appendix, where the variables used are explained.
4
2.
L
ITERATURER
EVIEWThe theme Cross-Border Mergers and Acquisitions is a very important one in the financial world. Cross-border M&As is a type of foreign direct investment (FDI). In recent years this topic was heavily studied by various authors. Erel, Liao & Weisbach (2012) analyse the determinants of cross-border mergers and acquisitions. The authors use a sample of 56,978 M&As between 1990 and 2007. The study reveals that 80% of the deals made had targets that did not belong to United States and 75% of the acquirers were not from the United States. However, in a general context, 47% of all deals involved an American company as a target or acquirer; 97% of the deals contain a private company and in most of the cases it was the target. This is an important factor for my research – in a broad view I am going to examine 25% of all M&As.
A major factor determining the frequency of cross-border deals are currency movements – when the currency of a country depreciates, there are more foreign companies with the intention to buy companies from that country – this is because the assets of that country become relatively cheaper.
The effect of the currency movements will affect the propension of mergers and are indicative of a general effect of valuation where companies with higher value tend to buy companies with a lower value – a higher-valued acquirer will purchase a relatively cheaper target after these changes. There are two arguments behind this effect.
The first one is the misvaluation effect. Rhodes-Kropf, Robinson, & Viswanathan (2005) find evidence that misvaluation drives mergers: acquirers and targets share a common misvaluation component although the first ones are priced significantly higher, suggesting that overvalued bidders can create gains by using expensive stock to acquire less overvalued targets; they also find that misvaluation explained about 15% of M&As activity level. Shleifer & Vishny (2003) also show evidence in support of this argument – either overpricing of the acquiring firm or underpricing of the target firm could lead to a potentially profitable investment for the acquiring firm. In the same line Lin, Officer, & Shen (2014) find strong evidence that acquirers in large currency appreciation deals make cross-border acquisitions that create wealth for acquirers.
The second argument is the wealth effect of Froot & Stein (1991). Their research shows that firms from wealthier countries will tend to purchase companies from poorer countries due to a lower cost of capital when there is a depreciation of the domestic currency – this can lead to
5
foreign acquisitions of certain domestic assets. Erel, Liao, & Weisbach (2012) evaluate both explanations and find more support to the wealth explanation rather than the mispricing explanation.
Exchange rates play a significant role in the inflows of FDI in a country. Udomkerdmongkol, Morrisey, & Görg (2009) investigate the impact of exchange rates on US FDI for the period 1990-2002. One of the conclusions of the research paper is that a cheaper currency (devaluation) stimulates inward FDI – devaluation lowers the cost of investment to foreign countries, increasing foreign investment. Xing (2006) and Xing & Wan (2006) study the Chinese market, finding evidence that fluctuations of foreign direct investment in China over a certain period can be attributed to the fluctuation of the exchange rate, reaching the same conclusion as the previous paper. Georgopoulos (2008) also concludes that a real currency depreciation leads to an increase in the probability of a cross-border M&As, using evidence of Canadian firms, but only in high R&D intensive industries.
Erel et al. also concludes that (2012) the effect of currency movements on cross-border M&As is more pronounced when the firms are from countries that are geographically closer and/or when the acquiring firm’s country is more developed (or exhibits better stock market performance) than that of the target firm. Overall, it is expected that, after a recent change in the relative valuation of two countries, cross-border M&A activity increases regardless of whether they occur through currency or stock price movements and regardless of whether they are temporary or permanent.
Erel et al. (2012) also analyse geography as an independent factor: the results show that the distance between countries is an important factor to have into count in cross-border M&As – the closer the countries, the higher is the probability for a company being part of a cross-border deal. In same line, Kedia & Panchapagesan (2004) also present a similar conclusion: local-firms (geographically closer) tend to be acquired leading to higher returns. They also find that information is key to superior performance of local acquirers.
Besides the geographic proximity between countries, the cultural proximity is another significant aspect to consider. Ahren, Daminelli, & Fracassi (2015) measure distance in cultural space, along three dimensions: trust vs distrust, hierarchy vs egalitarianism and individualism vs collectivism. The main conclusion of this paper is that the greater the cultural distance, the smaller the volume of M&As. In another study Aybar & Ficici (2009) find support of the negative impact of cultural proximity on cumulative abnormal returns.
6
Another important result of the work by Erel, Liao & Weisbach (2012) is that higher economic development and better accountant quality are both associated with a higher propensity of the company to be a bidder instead of a target. Rossi & Volpin (2004) also report that volume of M&A activity is significantly larger in countries with better accounting standards and stronger shareholder protection. Both papers reach the same conclusion: acquirers have higher investor protection than targets.
Alongside these conclusions, Ellis et al. (2017) find that acquirers can transport the benefits from good country governance using data from 56 countries from 1990 to 2007. In other words, targets who are acquired by companies from countries with better country governance benefit from it, creating more wealth for their shareholders.
Following the previous idea Harford et al. (2008) show that worse governed firms tend to dissipate their cash reserves in comparison with firms with better-governance. It is also concluded that the cash is spent primarily in acquisitions.
Harford (1999) find that cash-rich firms are more likely than others firms to attempt acquisitions; also these firms are more likely to make diverse acquisitions and their targets are less likely to attract other bidders. Related to the previous results Datta et al. (1992) conclude that cash-acquisitions speed up the transaction, reducing the cost of making a M&A.
Against the conventional wisdom that says that cash-rich bidders are more likely to use their cash to engage in acquisitions, Pinkowitz, Sturgess, & Williamson (2013) conclude that firms who are rich are 23% less likely to make cash bids than stock bids, comparing with not cash-rich firms.
Other topic of important relevance in cross-border M&As is conglomerate acquisitions. It can be defined as a merger between firms that are involved in unrelated business activities. Datta, Pinches, & Narayanan (1992) show that non-conglomerate M&As are preferible as acquirer and target benefit from economies available through resource sharing, transferable competencies and less risk overall, creating more wealth overall. Herger & McCorriston (2016) refer that conglomerate cross-border M&As are strongly driven by financial arbitrage opportunities when an investment occurs in countries where firms are undervalued.
In M&As is common for one company to make several acquisitions in a certain period. Fuller, Netter, & Stegemoller (2002) define a serial acquirer as one company that made more than
7
five acquisitions over the sample period. However, serial acquirers do not have a consistent definition. Macias, Rau, & Stouraitis (2016) defined three dimensions for characterizing serial acquirers: The first one was already mentioned above, while the other two are the number of acquisitions windows (acquisition blocks) and the intensity of transactions in each block. Using these three dimensions they document the existence of four different groups of bidders: loners, occasional acquirers, sprinters and marathoners.
Karolyi, Liao, and Loureiro (2015) refer that serial acquirers engage in cross-border and conglomerate acquisitions; they also conclude that if a serial acquirer is from a country with poor shareholder protection or has lower level of institutional ownership it tends to aggravate lower announcement returns, especially in later acquisitions. Macias, Rau, & Stouraitis (2013) conclude that the vast majority of acquisitions in the United States between 1980 and 2010 were conducted by serial acquirers (in frequency and transaction value) strategically shifting between methods of payment in an attempt to take advantage of their own overvalued stock.
Makaew (2009) studies the dynamic patterns of cross-border mergers in 1989-2008 period using data from 50 countries and presents some key facts about cross-border mergers. The first fact is that international mergers come in waves that are correlated with business cycles, even more than domestic mergers. Adding to this, mergers are more likely to occur when both the acquirer and the target economies are booming – it eliminates the common belief that acquirers will take advantage of a target financial crisis or liquidity problems, despite happening under some specific circumstances. Thirdly the study concludes that mergers booms have both an industry-level (productivity shock) and a country-industry-level (financial shock) component. Lastly, he observes that acquirers tend to be more productive than their industry peers and targets tend to be less productive than their industry peers. This finding supports the neoclassical theory of mergers that high productivity firms acquire low productivity firms to redeploy their assets toward more profitable uses.
Nevertheless, the value of the target companies increases on average. A small study by Baran & Saikevicius (2015) concludes that cross-border mergers in EU-10 boost the value of the target companies during the 2004-2013 period.
Aguiar & Gopinath (2005) find that liquidity plays a significant and sizable role in explaining the dramatic increase in foreign acquisition activity in cross-border M&As in East Asian during the
8
crisis between 1997 and 1998 – it shows a link between the liquidity crises and the consequent continued inflow of FDI.
In sum financial literature mentions diverse factors which influence domestic and cross-border M&As: currency shocks, geography, culture, shareholder protection, cash-rich firms, serial acquirers, conglomerate acquisitions among others. Acknowledging these components and determinants my dissertation concentrates in the effect of currency depreciation and how other factors influence it.
9
3.
H
YPOTHESES ANDM
ETHODOLOGYIn this part I develop the hypotheses of my investigation and explain them following the literature presented in the previous section.
3.1. Hypotheses Development
According to Froot & Stein (1991) the wealth effect influence the propension of M&As – the argument assume that firms from richer countries will engage in M&As when there is a depreciation of the domestic currency. Posteriorly Erel et al. (2012) find support for this theory rather than the misvaluation effect. Also it concludes that M&As are more probable to happen if the countries are closer to each other, as Kedia & Panchapagesan (2004) support. Ahren, Daminelli, & Fracassi (2015) find that the greater the cultural distance, the smaller the volume of M&As. Rossi & Volpin (2004) and Erel et al. (2012) find that M&A were at a greater number when countries had better accounting standards and stronger shareholder protection. Finally, Ellis et al. (2017) find that targets who are acquired by companies from countries with better country governance benefit from it. Based on this literature I formulate the following hypothesis, testing how geography, culture and shareholder protection influence it.
H1: Firms from countries with a currency depreciation are more likely to be acquired by a US company, ceteris paribus.
H1a: Geographic proximity increases the probability of a cross-border acquisition, following a currency depreciation in the target country.
H1b: Cultural proximity increases the probability of a cross-border acquisition, following a currency depreciation in the target country.
H1c: Weaker shareholder protection in the target country increases the probability of a cross-border acquisition, following a currency depreciation in the target country.
When a depreciation occurs, the currency of a given country is relatively cheaper to foreign countries and therefore foreign companies. Companies who have the intention to pursue a M&A in
10
a country with a currency depreciation can abdicate their own industry (the industry that they know better how to handle and how to do things) and go after another industry, in an attempt to expand their business (or just to buyout a firm that is at a sale price). Herger & McCorriston (2016) find that conglomerate cross-border M&As are driven by financial arbitrage opportunities when an investment occurs in countries where firms are undervalued. However, Datta, Pinches, & Narayanan (1992) find that non-conglomerate M&As create more weatlh for acquirers than conglomerate acquisitions and thus are preferible for both the acquirer and target. Based on the previous literature the second hypothesis is formulated as:
H2: Bidders take advantage of currency depreciation to engage in conglomerate cross-border acquisitions, ceteris paribus
Firms with excess cash holding would benefit if a foreign country had a currency depreciation and could exploit this fact, making a M&A in that region, acknowledging that the currency is worth more for that period. Harford (1999) find that cash-rich firms are more likely to engage in diverse acquisitions. Datta et al. (1992) show that cash-acquisitions also speed up the transaction. Udomkerdmongkol et al. (2009) Xing (2006), Xing & Wan (2006) and Georgopoulos (2008) find that a depreciation in currency stimulates inward FDI. Therefore, I formulate the following hypothesis:
H3.A: Firms from countries with a currency depreciation are more likely to be acquired by a cash-rich firm, ceteris paribus.
Pinkowitz, Sturgess, & Williamson (2013) find that firms who are cash-rich are 23% less likely to make cash bids. However conventional wisdom says that cash-rich bidders are more likely to use their cash to make acquisitions. This led me to the formulation of the following hypothesis:
H3.B: Cash-rich bidders take advantage of currency depreciation to make cash-based cross-borders M&As.
11
3.2. Methodology
In this subsection, I explain the models and the specific variables used. Model 1
To test the first hypothesis, I use a model motivated by the works of Froot & Stein (1991) and Erel, Liao, & Weisbach (2012). Both papers argue that in a currency depreciation a firm from a richer country will engage in M&As when there is a depreciation of the domestic currency. So, it is expected, in this case, that firms that suffer from a currency depreciation in their country are likely to be acquired by U.S. firms. For my first hypothesis the following model was estimated:
𝐶𝑟𝑜𝑠𝑠𝑏𝑜𝑟𝑑𝑒𝑟 𝑀&𝐴𝑠𝑖,𝑡 = ∝ + 𝛽1𝐷𝑒𝑝𝑟𝑒𝑐𝑖𝑎𝑡𝑖𝑜𝑛𝑖,𝑡 + 𝛽2𝑆𝑒𝑟𝑖𝑎𝑙 𝐴𝑐𝑞𝑢𝑖𝑟𝑒𝑟𝑖,𝑡+
𝛽3𝐶𝑜𝑛𝑡𝑟𝑜𝑙𝑖,𝑡+ 𝛽4𝐹𝑖𝑥𝑒𝑑 𝐸𝑓𝑓𝑒𝑐𝑡𝑠𝑖,𝑡+ 𝜀𝑖,𝑡
The dependent variable, 𝐶𝑟𝑜𝑠𝑠𝑏𝑜𝑟𝑑𝑒𝑟 𝑀&𝐴𝑠𝑖,𝑡 , is a dummy variable that equals 1 for cross-border acquisitions and 0 otherwise made by acquirer i in year t. 𝐷𝑒𝑝𝑟𝑒𝑐𝑖𝑎𝑡𝑖𝑜𝑛𝑖,𝑡 is a
dummy variable, 1 when it occurs and 0 when there is period without a depreciation, in any given region for that time. 𝑆𝑒𝑟𝑖𝑎𝑙 𝐴𝑐𝑞𝑢𝑖𝑟𝑒𝑟𝑖,𝑡 is also a dummy variable that equals 1 if an acquirer made over 5 acquisitions in the sample period and 0 otherwise, using the definition of Fuller, Netter, & Stegemoller (2002). The model also includes variables of control, based in the work of Erel et al. (2012). Depending on the specific regression I consider from 2 to 4 variables at once. 𝑆𝑖𝑧𝑒𝑖,𝑡 is calculated as the natural logarithm of total assets; 𝑀𝐵𝑉𝑖,𝑡 is calculated as the ratio between market value of equity and shareholder’s equity. 𝑅𝑂𝐸𝑖,𝑡 is the return on equity, being the ratio between net income and shareholders’ equity; 𝐵𝑜𝑜𝑘𝐿𝑒𝑣𝑒𝑟𝑎𝑔𝑒𝑖,𝑡 is measure by long debt
divided by total assets. The model includes year and industry fixed effects: 𝐼𝑛𝑑𝑢𝑠𝑡𝑟𝑦 𝐹𝐸 𝑖,𝑡 is a dummy by industry for the acquirer firm, using the two digit SIC-CODE and 𝑌𝑒𝑎𝑟 𝐹𝐸𝑖,𝑡 is a dummy by year of the acquisition. Finally, 𝜀𝑖,𝑡 is the independent and identically distributed error term with a mean of zero.
In addition, I test an alternative methodology. I split the sample in regions and then in specific groups - geographically closer (distant) countries and culturally closer (distant) countries. In each group I use the corresponding 𝐷𝑒𝑝𝑟𝑒𝑐𝑖𝑎𝑡𝑖𝑜𝑛𝑖,𝑡 variable – it is calculated only considering periods of a currency crisis for that region/group and not for all countries combined, as in the
12
previous model. For that reason, China is not going to have this specific model because there are not depreciations in the domestic currency for the study period.
Geography, culture and shareholder protection are tested using another slightly different mode. The sample is restricted to only cross-border acquisitions. Geography, culture or shareholder protection are, in this case, the dependent variable, replacing 𝐶𝑟𝑜𝑠𝑠𝑏𝑜𝑟𝑑𝑒𝑟 𝑀&𝐴𝑠𝑖,𝑡. The remain of this model is the same.
Model 2
For my second hypothesis I use a model that analyses if firms from the United States are more likely to engage in a cross-border M&A over a domestic M&A in a period where a foreign country is suffering a currency depreciation. Herger & McCorriston (2016) find support for conglomerate acquisitions in countries where firms are undervalued. It is my aim to test if acquirers take advantage of a currency depreciation to engage in conglomerate acquisitions. The model is used to test hypothesis 2 that predicts that companies could take advantage of a depreciation to expand their business:
𝐶𝑟𝑜𝑠𝑠𝑏𝑜𝑟𝑑𝑒𝑟 𝑀&𝐴𝑠𝑖,𝑡 = ∝ + 𝛽1𝐷𝑒𝑝𝑟𝑒𝑐𝑖𝑎𝑡𝑖𝑜𝑛𝑖,𝑡 + 𝛽2𝐶𝑜𝑛𝑔𝑙𝑜𝑚𝑒𝑟𝑎𝑡𝑒𝑖,𝑡+
𝛽3𝐷𝑒𝑝𝑟𝑒𝑐𝑖𝑎𝑡𝑖𝑜𝑛𝐶𝑜𝑛𝑔𝑙𝑜𝑚𝑒𝑟𝑎𝑡𝑒𝑖,𝑡 + 𝛽4𝑆𝑒𝑟𝑖𝑎𝑙 𝐴𝑐𝑞𝑢𝑖𝑟𝑒𝑟𝑖,𝑡+ 𝛽5𝐶𝑜𝑛𝑡𝑟𝑜𝑙𝑖,𝑡+
𝛽6𝐹𝑖𝑥𝑒𝑑 𝐸𝑓𝑓𝑒𝑐𝑡𝑠𝑖,𝑡+ 𝜀𝑖,𝑡
Where the dependent variable is the same as in the previous model. 𝐷𝑒𝑝𝑟𝑒𝑐𝑖𝑎𝑡𝑖𝑜𝑛𝑖,𝑡
and 𝑆𝑒𝑟𝑖𝑎𝑙 𝐴𝑐𝑞𝑢𝑖𝑟𝑒𝑟𝑖,𝑡 have the same meaning as well. 𝐶𝑜𝑛𝑔𝑙𝑜𝑚𝑒𝑟𝑎𝑡𝑒𝑖,𝑡 is a dummy variable created by using the two digit SIC-CODE: 0 when the acquirer and the target have the same industry
and 1 when there are from distinct industries. 𝐷𝑒𝑝𝑟𝑒𝑐𝑖𝑎𝑡𝑖𝑜𝑛𝐶𝑜𝑛𝑔𝑙𝑜𝑚𝑒𝑟𝑎𝑡𝑒𝑖,𝑡 is the product
of the coefficients from the two previous variables – it represents the sensitivity on the dependent variable. 𝑆𝑖𝑧𝑒𝑖,𝑡 and 𝑀𝐵𝑉𝑖,𝑡 are used as control variables and the fixed effects remain the same
13 Model 3.A
To test this hypothesis I use a model motivated by the findings of Harford (1999) that supports that cash-rich firms are more likely to undertake in diverse acquisitions. To complement I use the findings by Udomkerdmongkol et al. (2009) Xing (2006), Xing & Wan (2006) and Georgopoulos (2008) that show that depreciation in currency increases investment in that country. The model I use for this hypothesis states as follows:
𝐶𝑟𝑜𝑠𝑠𝑏𝑜𝑟𝑑𝑒𝑟 𝑀&𝐴𝑠𝑖,𝑡 = ∝ + 𝛽1𝐷𝑒𝑝𝑟𝑒𝑐𝑖𝑎𝑡𝑖𝑜𝑛𝑖,𝑡 + 𝛽2𝐶𝑎𝑠ℎ𝑟𝑖𝑐ℎ𝑖,𝑡 +
𝛽3𝐷𝑒𝑝𝑟𝑒𝑐𝑖𝑎𝑡𝑖𝑜𝑛𝐶𝑎𝑠ℎ𝑟𝑖𝑐ℎ𝑖,𝑡+ 𝛽4𝑆𝑒𝑟𝑖𝑎𝑙 𝐴𝑐𝑞𝑢𝑖𝑟𝑒𝑟𝑖,𝑡+ 𝛽5𝐶𝑜𝑛𝑡𝑟𝑜𝑙𝑖,𝑡+
𝛽6𝐹𝑖𝑥𝑒𝑑 𝐸𝑓𝑓𝑒𝑐𝑡𝑠𝑖,𝑡+ 𝜀𝑖,𝑡
Where the dependent variable continues to be 𝐶𝑟𝑜𝑠𝑠𝑏𝑜𝑟𝑑𝑒𝑟 𝑀&𝐴𝑠𝑖,𝑡.
𝐷𝑒𝑝𝑟𝑒𝑐𝑖𝑎𝑡𝑖𝑜𝑛𝑖,𝑡 and 𝑆𝑒𝑟𝑖𝑎𝑙 𝐴𝑐𝑞𝑢𝑖𝑟𝑒𝑟𝑖,𝑡 remain the same as the previous model. 𝐶𝑎𝑠ℎ𝑟𝑖𝑐ℎ𝑖,𝑡 is also a dummy variable. It is calculated by dividing Cash Holdings by Total Assets; if the value for a given firm in a given year is above the median of all observations it equals 1, otherwise 0. 𝐷𝑒𝑝𝑟𝑒𝑐𝑖𝑎𝑡𝑖𝑜𝑛𝐶𝑎𝑠ℎ𝑟𝑖𝑐ℎ𝑖,𝑡 is the product of the coefficients from the previous explained variables. Again, 𝑆𝑖𝑧𝑒𝑖,𝑡 and 𝑀𝐵𝑉𝑖,𝑡 are used as control variables. The fixed effects remain the same.
Model 3.B
My last model is based that firms with excess holdings in cash will try to use that cash to acquire foreign firms in currency crisis. To test the third hypothesis, I estimated the following model:
𝐶𝑎𝑠ℎ/𝑆𝑡𝑜𝑐𝑘 𝑀&𝐴𝑠𝑖,𝑡 = 𝛽1𝐷𝑒𝑝𝑟𝑒𝑐𝑖𝑎𝑡𝑖𝑜𝑛𝑖,𝑡+ 𝛽2𝐶𝑎𝑠ℎ𝑟𝑖𝑐ℎ𝑖,𝑡+ 𝛽3𝐷𝑒𝑝𝑟𝑒𝑐𝑖𝑎𝑡𝑖𝑜𝑛𝐶𝑎𝑠ℎ𝑟𝑖𝑐ℎ𝑖,𝑡+ 𝛽4𝑆𝑒𝑟𝑖𝑎𝑙 𝐴𝑐𝑞𝑢𝑖𝑟𝑒𝑟𝑖,𝑡+ 𝛽5𝐶𝑜𝑛𝑡𝑟𝑜𝑙𝑖,𝑡+ 𝛽6𝐹𝑖𝑥𝑒𝑑 𝐸𝑓𝑓𝑒𝑐𝑡𝑠𝑖,𝑡+ 𝜀𝑖,𝑡
The dependent variable 𝐶𝑎𝑠ℎ/𝑆𝑡𝑜𝑐𝑘 𝑀&𝐴𝑠𝑖,𝑡 is a dummy variable that equals 1 for acquisitions with 100% cash and 0 otherwise. 𝐷𝑒𝑝𝑟𝑒𝑐𝑖𝑎𝑡𝑖𝑜𝑛𝑖,𝑡, 𝑆𝑒𝑟𝑖𝑎𝑙 𝐴𝑐𝑞𝑢𝑖𝑟𝑒𝑟𝑖,𝑡,
𝐶𝑎𝑠ℎ𝑟𝑖𝑐ℎ𝑖,𝑡, 𝐷𝑒𝑝𝑟𝑒𝑐𝑖𝑎𝑡𝑖𝑜𝑛𝐶𝑎𝑠ℎ𝑟𝑖𝑐ℎ𝑖,𝑡 do not change as well as 𝑆𝑖𝑧𝑒𝑖,𝑡 and 𝑀𝐵𝑉𝑖,𝑡 that are
14
4.
D
ATAD
ESCRIPTION4.1 Data availability
These data used in this study are from 3 different databases: data from mergers and acquisitions are from Securities Data Company (SDC) database. All the information about the number of mergers, status, industry and others are found there. For accounting information Thomson Reuters DataStream is the database that was chosen; there I find not only information about accounting variables as well specific country information – for example exchange rates. A third database is used, in order to retrieve information that evaluates the quality of the country – specific variables.
4.2 Sample Construction
I focused only M&As when the acquirer is from the United States. The main reason for this restriction is that it helps to study the implication of currency movements – in this way only the American Dollar ($) is used instead of working with several currencies from different countries.
. The initial sample of this dissertation consists of 21,437 completed cross-border M&As and 102,098 domestic M&As undertaken by U.S. firms between January 1st, 2007 and 31st
December 2017.This data is provided by SDC database, combining for a grand total of 123,535 M&A. where the bidder is always from the United States and there is no restriction for the target. For each deal I collect from Securities Data Company Database the announcement date, Target Nation, Acquirer Industry Sector, Acquirer and Target public status, deal number, status of M&A, acquirer and target SEDOL and SIC CODE. As SDC does not provide many firm specific information I use the SEDOL number to retrieve this information from Thomson DataStream database.
I applied the following screenings to my initial sample: (1) only deals that were “Completed” between 2007 and 2017 and that showed that status publicly are considered; (2) All deals where firms are not Private, State-owned or Subsidiaries were dropped off. (3) If the SEDOLs are equal between the acquirer and the target the observations were not considered; (4) From the 174 target countries only a few are utilized. To minimize the number of different currencies used in the study, I only consider the biggest eight regions/currencies: Euro for the countries from the
15
Eurozone, Australian Dollar for Australia, Canadian Dollar for Canada, Yen for China, Pound for Great Britain, Rupee for India, Yuan for Japan and Real for Brazil; (5) If the acquirer firm did not have a validated SEDOL the observations were deleted; (6) All countries from the Eurozone with 10 observations or less were dropped off; (7) Utility and financial sectors are excluded - when the Standard Industry Classification code (SIC code) are between 4900-4949 and 6000-6999.
After applying these specifications, I obtain 21,764 M&As: 4,331 are cross-border and 17,433 are domestic. The target firms are from Australia, Brazil, Canada, China, India, Japan, United Kingdom and from Europe. In this subgroup the countries are: Austria, Belgium, Germany, France, Portugal, Spain, Italy, Netherlands, Ireland, Finland and Luxembourg. In total 19 countries are considered, including the United States that I use for domestic M&As.
To capture all information regarding accounting standards by firm I used all the validated SEDOLs from the first database and went to Thomson Reuters/DataStream to download the accounting information: Return on Equity (ROE), total assets, market value , debt in long run , total liabilities )and equity in shares for each company in each year.
After that, the ratios necessary for my regressions were created. For my models I am going to use some accounting variables: the logarithm of total assets, the book leverage, cash ratio, market-to-book ratio and return on equity. In order to avoid estimation biases created by potential outliers, I winsorize all variables at 1% of its distribution. Further, since some firms have missing values for some of the accounting variables there are variations in the size of the sample depending on the model used.
Ellis et al. (2017) use in their work the country level indicators of Kaufman, Kraay, and Mastruzzi (2009). Based on that I download them from the WorldBank website database as a measure of country governance. The variables considered are Voice and Accountability, Political Stability and No Violence, Government effectiveness, Regulatory quality, rule of law and control of corruption. In order to measure shareholder protection, I generate a new variable using the mean of the rank of the previous six variables. After I calculate the median of this new variable. Observations above the median are given the value 1 (implying countries with greater shareholder protection) and 0 otherwise. It is my purpose to measure shareholder protection using country governance. Finally, I need to analyse currency depreciations in relation to the dollar. In this case data was downloaded monthly - my objective is to see which currency suffers a depreciation in relation to the dollar in a quarter of a given year. I calculated the monthly return for all currencies
16
and then computed the quarters that had depreciation (for my work I consider that a currency crisis exists in a given quarter if the real exchange rate of the country increases by 15%). For the bidder (and consequently for my domestic M&As) whenever a depreciation for some currency had happened it is considered a currency crisis for that period. For example, if a currency crisis had happened in a given period in relation to euro and not for the others it is considered a currency crisis for domestic M&A for that period.
In order to analyse each currency separately I also create a dummy variable for each region – differently from above, this variable is created with only taking in consideration that region. For domestic M&As it is considered a currency crisis when that region had one in relation to the American dollar ($).
To test my hypotheses, I need culture variables. For that I based on a paper by Stulz & Williamson, (2002). They separate culture in religion and language spoken. I created a dummy variable culture – if a country has the same language spoken and religion the value 1 was given, 0 otherwise For geography I only consider Canada as a close country – I expect to see, comparing to the other 17 countries, if the effect is stronger when a currency crisis happen.
To create the dummy variable Serial acquirers I used the definition by Fuller, Netter, and Stegemoller (2002) - if a bidder made over 5 acquisitions in the sample period it is defined as a serial acquirer yielding 1, 0 otherwise.
All the variables are merged in a single file, that composes my database.
The rest of the dummy variables were created before my regressions. One for industry (1 for conglomerate acquisitions, 0 if the acquirer industry is the same than the target industry), one for cash (1 for a payment 100% in cash, 0 otherwise) and one for cash-rich bidders (observations above the median of the ratio between cash holdings and total assets were given the value 1, 0 otherwise).
17
4.3 Summary Statistics
This section presents the descriptive statistics of the variables that are used during the study.
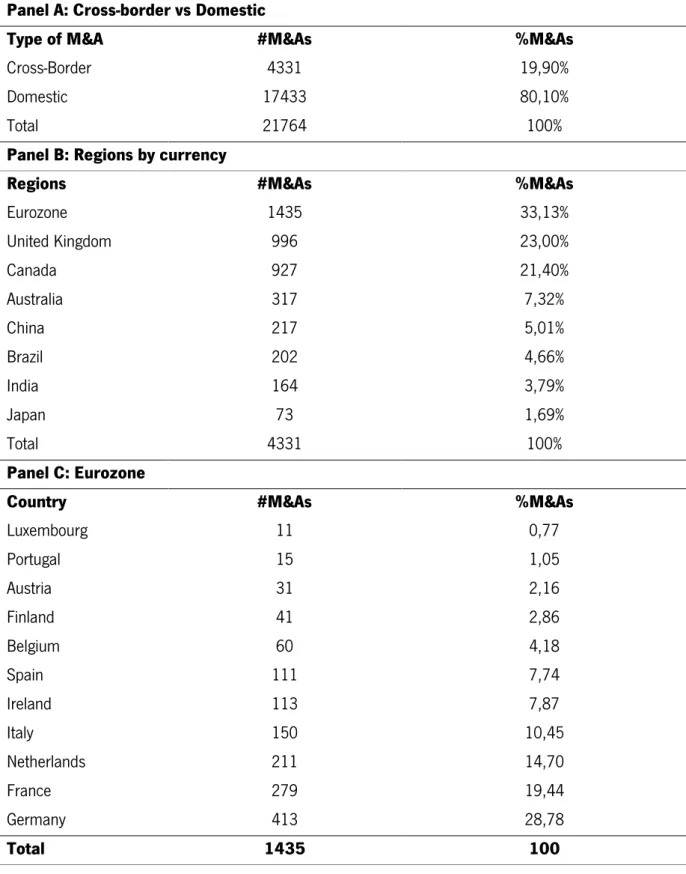
Table 1 displays how Mergers and Acquisitions are distributed by Target country (since the bidder is always from the United States). Panel A show head to head the percentage of cross-border M&As versus domestic M&As in the United States. As we are expecting the quantity of M&As between 2007 and 2017 is much higher internally than externally. In Panel B, we can see which regions are represented in cross-border M&As. Eurozone leads the way with one third of M&As (1435 observations), followed by United Kingdom with 996 and Canada with 927 observations. Panel C shows the countries in the Eurozone – the country with fewer cross-border M&As is Luxembourg – only 11 deals; Germany has almost 29% of all observations for the eurozone region, followed by France and Netherlands with 279 and 211 observations respectively.
18
Table 1 - Description of the Mergers and Acquisitions Sample
The sample includes cross-border and domestic deals made by the United States between 2007 and 2017. Firms labeled as utilities and financial (SIC codes between 4900 and 4949 and between 6000 and 6999) are excluded from the final data. This data was obtained via Securities Data Company (SDC) Platinum database. Panel A presents the number of cross-border and domestic M&As; Panel B presents the observations for each currency region; Panel C shows the countries from Eurozone. 19 countries are considered, each one having at least 10 observations.
Panel A: Cross-border vs Domestic
Type of M&A #M&As %M&As
Cross-Border 4331 19,90%
Domestic 17433 80,10%
Total 21764 100%
Panel B: Regions by currency
Regions #M&As %M&As
Eurozone 1435 33,13% United Kingdom 996 23,00% Canada 927 21,40% Australia 317 7,32% China 217 5,01% Brazil 202 4,66% India 164 3,79% Japan 73 1,69% Total 4331 100% Panel C: Eurozone
Country #M&As %M&As
Luxembourg 11 0,77 Portugal 15 1,05 Austria 31 2,16 Finland 41 2,86 Belgium 60 4,18 Spain 111 7,74 Ireland 113 7,87 Italy 150 10,45 Netherlands 211 14,70 France 279 19,44 Germany 413 28,78 Total 1435 100
19
Table 2 presents the type of industries for the acquirer firms. There are two industries that are highlighted: Manufacturing and Services, each one with roughly 39% of the total number of observations; together they account to almost 80% of the sample.
Table 2 - Distribution of the M&As by Acquirer's Industry
The sample includes cross-border and domestic deals made by the United States between 2007 and 2017. Firms labeled as utilities and financial (SIC codes between 4900 and 4949 and between 6000 and 6999) are excluded from the final data. This data was obtained via Securities Data Company (SDC) Platinum database. In this table M&As are divided by industry, using the two digit SIC code.
Industry #M&As %M&As
Agriculture, Forestry and Fishing 48 0,22%
Mining 1449 6,66%
Construction 321 1,47%
Manufacturing 8428 38,72%
Transportation and Public Utilities 1466 6,74%
Wholesale Trade 1009 4,64%
Retail Trade 1016 4,67%
Services 8015 36,83%
Public Administration 12 0,06%
Total 21764 100%
In figure 1 it is displayed the distribution of M&As by year, separated by Domestic, Cross-Border and the total number. As we can see by the graphic the number of observations tends to decrease – in 2007 the number of domestic/cross-border and total are the highest from the observed years. This decline can be explained by the crisis of 2007, reveling some post-crisis uncertainty environment; 2009 is the year with the smallest number of cross-border M&As, with only 300 observations; in terms of domestic ones this statistic belongs to 2016.
20
Figure 1 - Description of M&A by year
This table reports the domestic, cross-border and total number of deals per year during the 2007 to 2017 period. The sample is composed by 21,764 observations made by the United States.
The next table presents summary statistics for the accounting and financial variables from each firm. These variables are used in the models created.
Table 3 - Summary Statistics
This table provides descriptive statistics of the main variables used. All variables are defined in Appendix A. The accounting and financial data are obtained from WorldScope and Thomson’s DataStream Database. Each observation corresponds to the year before from 2007 to 2017. Utilities and Financial firms are excluded. All observations are winsorized at 1% and 99% of the distribution.
Variable Number of
Observations Mean Median
Standard Deviation Size 19622 13.27409 13.76947 3.132779 Book Leverage 17804 .2527202 .1790433 .3276184 MBV 16619 .0018541 .0021131 .0898181 ROE 17563 -2,647305 10.58 80.72929 0 500 1000 1500 2000 2500 3000 2007 2008 2009 2010 2011 2012 2013 2014 2015 2016 2017
Evolution between Crossborder and Domestic M&As
21
5.
E
MPIRICALR
ESULTS ANDD
ISCUSSIONIn the next sections I examine the models created in order to test my hypotheses. For each sub-section I use a different model as detailed in Section 3. The models can include fixed effects as detailed in the tables and all include test for robustness.
5.1 Are target countries with a currency depreciation more likely to be
acquired by a US company?
For my first hypothesis I analyse the effect of a currency depreciation and how it affects US companies who want to invest in a country with a depreciation.
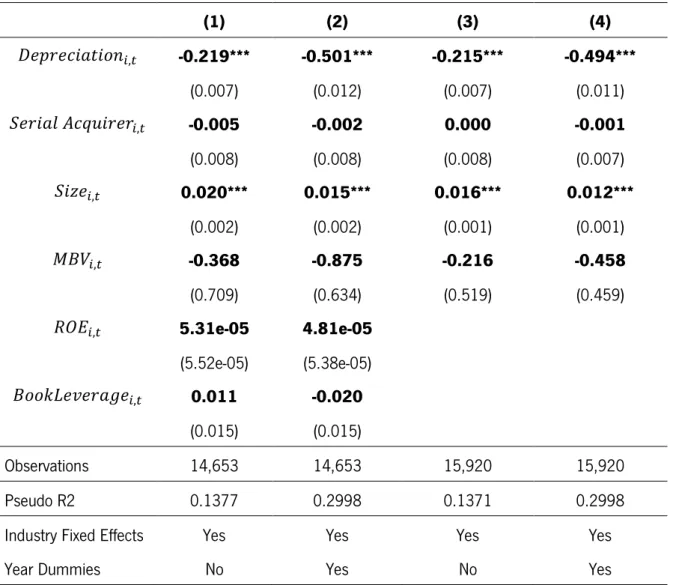
Table 4 presents the results of the first model, using a probit regression. The dependent variable is the dummy 𝐶𝑟𝑜𝑠𝑠𝑏𝑜𝑟𝑑𝑒𝑟 𝑀&𝐴𝑠𝑖,𝑡. In columns (1) to (4) the variables that are used change: in columns (3) and (4) 𝑅𝑂𝐸𝑖,𝑡 and 𝐵𝑜𝑜𝑘𝐿𝑒𝑣𝑒𝑟𝑎𝑔𝑒𝑖,𝑡.are not considered. Fixed effects also change, explained in the table below.
22
Table 4 - Impact of a currency depreciation in cross-border M&As
The table presents the outcomes of the regressions using Model 1, discussed in Section 3, in order to test the first hypothesis of my investigation: “Firms from countries with a currency depreciation are more likely to be acquired by a US company, ceteris paribus.” The sample for this regression only includes firms with available accounting information, reducing the sample number to 15,920 M&A’s (both cross-border and domestic), ranging from 2007 to 2017. 𝐶𝑟𝑜𝑠𝑠𝑏𝑜𝑟𝑑𝑒𝑟 𝑀&𝐴𝑠𝑖,𝑡 is the dependent variable and is a dummy variable that equals 1 for cross-border acquisitions and 0 otherwise. 𝐷𝑒𝑝𝑟𝑒𝑐𝑖𝑎𝑡𝑖𝑜𝑛𝑖,𝑡 is also a dummy variable, yielding 1 if there is a depreciation in that period for every currency in relation to the dollar ($). 𝑆𝑒𝑟𝑖𝑎𝑙 𝐴𝑐𝑞𝑢𝑖𝑟𝑒𝑟𝑖,𝑡 is a dummy variable that equals 1 if an acquirer made over 5 acquisitions in the sample period and 0 otherwise. The model also includes variables of control: 𝑆𝑖𝑧𝑒𝑖,𝑡 is calculated as the natural logarithm of total assets; 𝑀𝐵𝑉𝑖,𝑡 is calculated as the ratio between market value of equity and shareholders’ equity. 𝑅𝑂𝐸𝑖,𝑡 is the return on equity, being the ratio between net income and shareholders’ equity; 𝐵𝑜𝑜𝑘𝐿𝑒𝑣𝑒𝑟𝑎𝑔𝑒𝑖,𝑡 is measure by long debt divided by total assets. The model includes year and industry fixed effects: 𝐼𝑛𝑑𝑢𝑠𝑡𝑟𝑦 𝐹𝐸 𝑖,𝑡 is a dummy by industry for the acquirer firm, using the two digit SIC-CODE and 𝑌𝑒𝑎𝑟 𝐹𝐸𝑖,𝑡 is a dummy by year of the acquisition; all these variables are winsorized at 1% and 99%. In each column there is an indication of the fixed effects used, as noted below. Robust standard errors are in parentheses. The symbols ***, **, and * denote statistical significance at the 1%, 5%, and 10% level, respectively.
(1) (2) (3) (4) 𝐷𝑒𝑝𝑟𝑒𝑐𝑖𝑎𝑡𝑖𝑜𝑛𝑖,𝑡 -0.219*** -0.501*** -0.215*** -0.494*** (0.007) (0.012) (0.007) (0.011) 𝑆𝑒𝑟𝑖𝑎𝑙 𝐴𝑐𝑞𝑢𝑖𝑟𝑒𝑟𝑖,𝑡 -0.005 -0.002 0.000 -0.001 (0.008) (0.008) (0.008) (0.007) 𝑆𝑖𝑧𝑒𝑖,𝑡 0.020*** 0.015*** 0.016*** 0.012*** (0.002) (0.002) (0.001) (0.001) 𝑀𝐵𝑉𝑖,𝑡 -0.368 -0.875 -0.216 -0.458 (0.709) (0.634) (0.519) (0.459) 𝑅𝑂𝐸𝑖,𝑡 5.31e-05 4.81e-05 (5.52e-05) (5.38e-05) 𝐵𝑜𝑜𝑘𝐿𝑒𝑣𝑒𝑟𝑎𝑔𝑒𝑖,𝑡 0.011 -0.020 (0.015) (0.015) Observations 14,653 14,653 15,920 15,920 Pseudo R2 0.1377 0.2998 0.1371 0.2998
Industry Fixed Effects Yes Yes Yes Yes
23
In all columns the coefficients on the variable of interest are negative and statically significant at 1%. Correspondingly the probability of a cross-border M&A decreases by 21.9 percentage points when industry fixed effect are considered. When we include both fixed effects, in column (2), the probability decreases even more, reaching 50.1 percentage points. For the other two columns the results are similar: the effect is always negative and significant: for column (3) without 𝑅𝑂𝐸𝑖,𝑡 and 𝐵𝑜𝑜𝑘𝐿𝑒𝑣𝑒𝑟𝑎𝑔𝑒𝑖,𝑡 the probability of a cross-border acquisition decreases 21.5 percentage points and this value goes to 49.4 when year dummies are used.
The results are surprising because previous literature for other periods does not support these discoveries. However, I hypothesize some explanation that can describe this outcome. My period of analysis coincides with the financial worldwide crisis which affected heavily the currencies from countries in North America and Europe; some of my target countries are from these regions. The overall results suggest a behavioural pattern difference for American bidders when a foreign currency depreciates. Furthermore, these depreciations have a different context than in previous studies: the financial crisis had a several impact in the United States, where all the acquirers of my study are from. The previous reasons can be an explanation for the results presented.
After finding this relation between currency depreciation and cross-border M&As, I analyse alternative methodology, splitting the sample in specific groups. In panel A of Table 5 I present the results for the model adapted for each region, except China, which does not have currency depreciations for the period of this study; panel B displays the results for the model when geographically closer/distant and culturally closer/distant countries are considered. Both models are compared to domestic M&As in United States. A currency crisis is only considered when there has been a depreciation in that group.
24
The table presents the outcomes of the regressions using an alternative of Model 1, splitting the sample in specific groups by country and by geographically/culturally closer/distant countries, in order to test the first hypothesis of my investigation: “Firms from countries with a currency depreciation are more likely to be acquired by a US company, ceteris paribus.” This is discussed in Section 3. The sample for this regression only includes firms with available accounting information (both cross-border and domestic), ranging from 2007 to 2017. 𝐶𝑟𝑜𝑠𝑠𝑏𝑜𝑟𝑑𝑒𝑟 𝑀&𝐴𝑠𝑖,𝑡 is the dependent variable and is a dummy variable that equals 1 for cross-border acquisitions and 0 otherwise. 𝐷𝑒𝑝𝑟𝑒𝑐𝑖𝑎𝑡𝑖𝑜𝑛𝑖,𝑡 is also a dummy variable, yielding 1 if there is a depreciation in that period for that specific group in relation to the dollar ($). 𝑆𝑒𝑟𝑖𝑎𝑙 𝐴𝑐𝑞𝑢𝑖𝑟𝑒𝑟𝑖,𝑡 is a dummy variable that equals 1 if an acquirer made over 5 acquisitions in the sample period and 0 otherwise. The model also includes variables of control: 𝑆𝑖𝑧𝑒𝑖,𝑡 is calculated as the natural logarithm of total assets; 𝑀𝐵𝑉𝑖,𝑡 is calculated as the ratio between market value of equity and shareholders’ equity. The model includes year and industry fixed effects: 𝐼𝑛𝑑𝑢𝑠𝑡𝑟𝑦 𝐹𝐸 𝑖,𝑡 is a dummy by industry for the acquirer firm, using the two digit SIC-CODE and 𝑌𝑒𝑎𝑟 𝐹𝐸𝑖,𝑡 is a dummy by year of the acquisition; all these variables are winsorized at 1% and 99%. Robust standard errors are in parentheses. The symbols ***, **, and * denote statistical significance at the 1%, 5%, and 10% level, respectively.
Panel A: Impact of a currency depreciation in a cross-border M&A for each region
(1) (2) (3) (4) (5) (6) (7)
Australia Brazil Canada Eurozone India Japan United Kingdom
𝐷𝑒𝑝𝑟𝑒𝑐𝑖𝑎𝑡𝑖𝑜𝑛𝑖,𝑡 0.005 0.004** -0.003 -0.011 0.002 -0.002 0.007 (0.005) (0.002) (0.007) (0.010) (0.003) (0.003) (0.009) 𝑆𝑒𝑟𝑖𝑎𝑙 𝐴𝑐𝑞𝑢𝑖𝑟𝑒𝑟𝑖,𝑡 0.007** 0.002 -0.009* -0.005 -0.001 0.004 (0.003) (0.002) (0.005) (0.007) (0.002) (0.006) 𝑆𝑖𝑧𝑒𝑖,𝑡 0.001** 0.002*** 0.002** 0.009*** 0.003*** 0.001*** 0.004*** (0.001) (0.000) (0.000) (0.001) (0.000) (0.000) (0.000) 𝑀𝐵𝑉𝑖,𝑡 -0.007 -0.194* -0.071 -0.422 -0.043 0.005 0.168 (0.182) (0.104) (0.282) (0.397) (0.082) (0.061) (0.344) Observations 10,257 9,977 11,543 11,451 9,411 7,032 11,31 Pseudo R2 0.0394 0.1045 0.0699 0.0696 0.0905 0.0622 0.0373
Panel B: Impact of a currency depreciation in a cross-border M&A for geography/culture closer/distant groups
(1) (2) (3) (4)
Geographically Closer Geographically Distant Culturally Closer Culturally Distant
𝐷𝑒𝑝𝑟𝑒𝑐𝑖𝑎𝑡𝑖𝑜𝑛𝑖,𝑡 -0.003 -0.501*** -0.085*** -0.420*** (0.006) (0.012) (0.008) (0.012) 𝑆𝑒𝑟𝑖𝑎𝑙 𝐴𝑐𝑞𝑢𝑖𝑟𝑒𝑟𝑖,𝑡 -0.009* 0.005 0.013** -0.009 (0.004) (0.006) (0.005) (0.006) 𝑆𝑖𝑧𝑒𝑖,𝑡 0.002** 0.012*** 0.005*** 0.009*** (0.001) (0.001) (0.001) (0.001) 𝑀𝐵𝑉𝑖,𝑡 -0.226 -0.156 0.233 -0.726* (0.261) (0.422) (0.349) (0.384) Observations 13,358 15,375 13,393 14,999 Pseudo R2 0.0664 0.2792 0.0590 0.2436
25
Panel A of table 5 has lack of results. The only value significative, at 5%, for the variable of interest 𝐷𝑒𝑝𝑟𝑒𝑐𝑖𝑎𝑡𝑖𝑜𝑛𝑖,𝑡, is the result for column (2), where Brazil is analysed. It shows that when a depreciation occurs in Brazil, the likelihood of a cross-border M&A by a United States firm increases, on average, by 0,4%. This value, although is small, goes along the literature explored and it is a result we should expect. Additionally, the financial global crisis did not affect this country in the way it affected richer countries, which may imply why this outcome differs from the other conclusions of my work.
Panel B displays the results for the alternative version of Model 1, using specific groups. The results for column (1) and (2) cannot be compared as the result for geographically closer countries is not statically significant. For column (2) when a 𝐷𝑒𝑝𝑟𝑒𝑐𝑖𝑎𝑡𝑖𝑜𝑛𝑖,𝑡 occurs leads, on average, to a decrease of 50.1 percentage points on 𝐶𝑟𝑜𝑠𝑠𝑏𝑜𝑟𝑑𝑒𝑟 𝑀&𝐴𝑠𝑖,𝑡. The outcomes for
culturally closer/distant countries can be compared. Although the general effect is negative, cross-border M&As decrease even more when there is a 𝐷𝑒𝑝𝑟𝑒𝑐𝑖𝑎𝑡𝑖𝑜𝑛𝑖,𝑡 when the country is distant culturally. This goes along with previous literature – a greater cultural distance decreases the volume of M&As (Ahren, Daminelli, & Fracassi, 2015).
Shareholder Protection, Culture and Geography are used in an alternate methodology, testing only cross-border M&As. The mentioned variables are now the dependent variable instead of 𝐶𝑟𝑜𝑠𝑠𝑏𝑜𝑟𝑑𝑒𝑟 𝑀&𝐴𝑠𝑖,𝑡. The next table reports the results for this model.
26
Table 6 - Impact of geography, culture and shareholder protection in cross-border M&As during a currency depreciation
The table presents the outcomes of the regressions using an alternative of Model 1, in order to test the first hypothesis of my investigation: “Firms from countries with a currency depreciation are more likely to be acquired by a US company, ceteris paribus.” This is discussed in Section 3. The sample for this regression only includes cross-border M&A available accounting information, ranging from 2007 to 2017. 𝐺𝑒𝑜𝑔𝑟𝑎𝑝ℎ𝑦𝑖,𝑡 𝐶𝑢𝑙𝑡𝑢𝑟𝑒𝑖,𝑡and 𝑆ℎ𝑎𝑟𝑒ℎ𝑜𝑙𝑑𝑒𝑟 𝑃𝑟𝑜𝑡𝑒𝑐𝑡𝑖𝑜𝑛𝑖,𝑡are the dependent variable. 𝐺𝑒𝑜𝑔𝑟𝑎𝑝ℎ𝑦𝑖,𝑡 is a dummy variable that equals 1 for geographically closer countries, 0 otherwise. 𝐶𝑢𝑙𝑡𝑢𝑟𝑒𝑖,𝑡 is also a dummy variable that equals 1 for culturally closer countries and 0 otherwise 𝑆ℎ𝑎𝑟𝑒ℎ𝑜𝑙𝑑𝑒𝑟 𝑃𝑟𝑜𝑡𝑒𝑐𝑡𝑖𝑜𝑛𝑖,𝑡 is also a dummy variable that is 1 if the value given is above median of the sum of the country level indicator of Kaufman et al. (2009) and 0 otherwise. 𝐷𝑒𝑝𝑟𝑒𝑐𝑖𝑎𝑡𝑖𝑜𝑛𝑖,𝑡 is also a dummy variable, yielding 1 if there is a depreciation in that period for every currency in relation to the dollar ($). 𝑆𝑒𝑟𝑖𝑎𝑙 𝐴𝑐𝑞𝑢𝑖𝑟𝑒𝑟𝑖,𝑡 is a dummy variable that equals 1 if an acquirer made over 5 acquisitions in the sample period and 0 otherwise. The model also includes variables of control: 𝑆𝑖𝑧𝑒𝑖,𝑡 is calculated as the natural logarithm of total assets; 𝑀𝐵𝑉𝑖,𝑡 is calculated as the ratio between market value of equity and shareholders’ equity. The model includes year and industry fixed effects: 𝐼𝑛𝑑𝑢𝑠𝑡𝑟𝑦 𝐹𝐸 𝑖,𝑡 is a dummy by industry for the acquirer firm, using the two digit SIC-CODE and 𝑌𝑒𝑎𝑟 𝐹𝐸𝑖,𝑡 is a dummy by year of the acquisition; all these variables are winsorized at 1% and 99%. Robust standard errors are in parentheses. The symbols ***, **, and * denote statistical significance at the 1%, 5%, and 10% level, respectively.
(1) (2) (3)
Geography Culture Shareholder Protect.
𝐷𝑒𝑝𝑟𝑒𝑐𝑖𝑎𝑡𝑖𝑜𝑛𝑖,𝑡 -0.035** 0.033 -0.064*** (0.016) (0.023) (0.025) 𝑆𝑒𝑟𝑖𝑎𝑙 𝐴𝑐𝑞𝑢𝑖𝑟𝑒𝑟𝑖,𝑡 -0.031* 0.047** -0.018 (0.018) (0.021) (0.021) 𝑆𝑖𝑧𝑒𝑖,𝑡 -0.011*** -0.008** -0.009** (0.003) (0.004) (0.004) 𝑀𝐵𝑉𝑖,𝑡 0.153 2.085 1.986 (1.223) (1.469) (1.563) Observations 3,075 3,050 2,951 Pseudo R2 0.0979 0.0363 0.0776
27
Focusing on the analysis, the regression gives statistically significant results for column (1) and (3). The results of the model reveal that there is a significant negative relation between a currency crisis and cross-border acquisitions when the country of the target is geographically closer – when there is a 𝐷𝑒𝑝𝑟𝑒𝑐𝑖𝑎𝑡𝑖𝑜𝑛𝑖,𝑡 it decreases a cross-border acquisition in a geographically closer country by 3.5 percentage points. This is also the case for countries with higher shareholder protection – when a 𝐷𝑒𝑝𝑟𝑒𝑐𝑖𝑎𝑡𝑖𝑜𝑛𝑖,𝑡 happens it decreases the probability of a cross-border acquisition in a country with higher shareholder protection by 6.4 percentage points. These findings are not consistent with previous literature but, as I explain above, the period of crisis coinciding with my period of analysis can be an important factor in order to clear these results.
28
5.2 Do Bidders take advantage of currency depreciations to engage in
conglomerate cross-border acquisitions?
In my second hypothesis, I test if acquirers from the United States take advantage of a currency crisis in a foreign country to engage in conglomerate cross-border acquisition instead of trying to acquire firms that work in the same industry.
The next table displays the results of probit estimate in order to test the hypothesis formulated in Section 3. The dependent variable continues to be 𝐶𝑟𝑜𝑠𝑠𝑏𝑜𝑟𝑑𝑒𝑟 𝑀&𝐴𝑠𝑖,𝑡, a
dummy variable that is 1 for cross-border M&As and 0 when it is a domestic M&A in the United States. The independent variable is also the same as the previous model, 𝐷𝑒𝑝𝑟𝑒𝑐𝑖𝑎𝑡𝑖𝑜𝑛𝑖,𝑡. 𝐶𝑜𝑛𝑔𝑙𝑜𝑚𝑒𝑟𝑎𝑡𝑒𝑖,𝑡 is a dummy variable that takes the value 1 when there is an acquisition in a different industry of the acquirer – I am using the 2 digit SIC-CODE to identify the industry of a
firm. 𝐷𝑒𝑝𝑟𝑒𝑐𝑖𝑎𝑡𝑖𝑜𝑛𝐶𝑜𝑛𝑔𝑙𝑜𝑚𝑒𝑟𝑎𝑡𝑒𝑖,𝑡 is the interaction between 𝐶𝑜𝑛𝑔𝑙𝑜𝑚𝑒𝑟𝑎𝑡𝑒𝑖,𝑡 and
𝐷𝑒𝑝𝑟𝑒𝑐𝑖𝑎𝑡𝑖𝑜𝑛𝑖,𝑡.Fixed effects are used in all regressions for this model. The sample is divided and analysed in three different groups – in column (1) I compute the regression for all the sample available; in columns (2) and (3) I split the sample in two – restricting only for conglomerate M&As and then only for M&As that happened when the firms where from the same industry.
29
Table 7 - Impact of currency depreciation in conglomerate cross-border acquisitions
The table shows the marginal effects of the regressions using Model 2, discussed in Section 3, in order to test the second hypothesis of my investigation: “Bidders take advantage of currency depreciation to engage in conglomerate cross-border acquisitions.” The sample for this regression only includes firms with available accounting information, reducing the sample number to 15,920 M&As (both cross-border and domestic), ranging from 2007 to 2017. 𝐶𝑟𝑜𝑠𝑠𝑏𝑜𝑟𝑑𝑒𝑟 𝑀&𝐴𝑠𝑖,𝑡 is the dependent variable and is a dummy variable (1 when it is a cross-border M&A). 𝐷𝑒𝑝𝑟𝑒𝑐𝑖𝑎𝑡𝑖𝑜𝑛𝑖,𝑡 is also a dummy variable, yielding 1 if there is a depreciation in that period for every currency in relation to the dollar ($). 𝐶𝑜𝑛𝑔𝑙𝑜𝑚𝑒𝑟𝑎𝑡𝑒𝑖,𝑡 is a dummy variable that equals 1 when the acquirer and the target are from different industries, using the two digit SIC-CODE. 𝐷𝑒𝑝𝑟𝑒𝑐𝑖𝑎𝑡𝑖𝑜𝑛𝐶𝑜𝑛𝑔𝑙𝑜𝑚𝑒𝑟𝑎𝑡𝑒𝑖,𝑡 is the product of the coefficients of 𝐷𝑒𝑝𝑟𝑒𝑐𝑖𝑎𝑡𝑖𝑜𝑛𝑖,𝑡 and 𝐶𝑜𝑛𝑔𝑙𝑜𝑚𝑒𝑟𝑎𝑡𝑒𝑖,𝑡. ($). 𝑆𝑒𝑟𝑖𝑎𝑙 𝐴𝑐𝑞𝑢𝑖𝑟𝑒𝑟𝑖,𝑡 is a dummy variable that equals 1 if an acquirer made over 5 acquisitions in the sample period and 0 otherwise. The model also includes variables of control: 𝑆𝑖𝑧𝑒𝑖,𝑡 is calculated as the natural logarithm of total assets; 𝑀𝐵𝑉𝑖,𝑡 is calculated as the ratio between market value of equity and shareholders’ equity. The model includes year and industry fixed effects: 𝐼𝑛𝑑𝑢𝑠𝑡𝑟𝑦 𝐹𝐸 𝑖,𝑡 is a dummy by industry for the acquirer firm, using the two digit SIC-CODE and 𝑌𝑒𝑎𝑟 𝐹𝐸𝑖,𝑡 is a dummy by year of the acquisition; all these variables are winsorized at 1% and 99%. Robust standard errors are in parentheses. The symbols ***, **, and * denote statistical significance at the 1%, 5%, and 10% level, respectively.
(1) (2) (3)
Conglomerate M&As Same Industry M&As
𝐷𝑒𝑝𝑟𝑒𝑐𝑖𝑎𝑡𝑖𝑜𝑛𝑖,𝑡 -0.489*** -0.535*** -0.461*** (0.013) (0.016) (0.015) 𝐶𝑜𝑛𝑔𝑙𝑜𝑚𝑒𝑟𝑎𝑡𝑒𝑖,𝑡 0.010 (0.008) 𝐷𝑒𝑝𝑟𝑒𝑐𝑖𝑎𝑡𝑖𝑜𝑛𝐶𝑜𝑛𝑔𝑙𝑜𝑚𝑒𝑟𝑎𝑡𝑒𝑖,𝑡 -0.008 (0.011) 𝑆𝑒𝑟𝑖𝑎𝑙 𝐴𝑐𝑞𝑢𝑖𝑟𝑒𝑟𝑖,𝑡 -0.002 0.007 -0.007 (0.007) (0.012) (0.009) 𝑆𝑖𝑧𝑒𝑖,𝑡 0.012*** 0.013*** 0.011*** (0.001) (0.002) (0.002) 𝑀𝐵𝑉𝑖,𝑡 -0.456 -0.553 -0.449 (0.459) (0.767) (0.570) Observations 15,920 6,965 8,786 Pseudo R2 0.2999 0.2962 0.3088
30
The overall results are negative. In column (1) the coefficient of 𝐷𝑒𝑝𝑟𝑒𝑐𝑖𝑎𝑡𝑖𝑜𝑛𝑖,𝑡 is
negative and significative at 1% level - the probability of a cross-border M&A decreases by 48.9 percentage on average, when a depreciation occurs. In column (2), only considering conglomerate M&As the outcome of the regression are negative and significative. When a depreciation occurs the probability of a conglomerate cross-border M&A decreases 53.5 percentage points. Comparing this result to column (3) it is expected that firms look more for targets in the same industry when a depreciation occurs, although a depreciation always decrease the probability of cross-border M&A. The results are statistically significative at 1% and are expected as Datta el al. (1992) show that non-conglomerate are preferable than conglomerate acquisitions.
An alternative model is also used here. Instead of 𝐶𝑟𝑜𝑠𝑠𝑏𝑜𝑟𝑑𝑒𝑟 𝑀&𝐴𝑠𝑖,𝑡
𝐶𝑜𝑛𝑔𝑙𝑜𝑚𝑒𝑟𝑎𝑡𝑒𝑖,𝑡 is the dependent variable. The sample is restricted to only cross-border M&As.
The remaining model keeps equal. Table 8 presents the results for this alternative methodology despite them not being statistically significative.