Ricardo Bruno Barbeiro dos Santos
Bachelor Degree in Biomedical Engineering SciencesHuman Crowdsourcing Data for Indoor Location
Applied to Ambient Assisted Living Scenarios
Dissertation submitted in partial fulfillment of the requirements for the degree of
Master of Science in Biomedical Engineering
Adviser: Hugo Filipe Silveira Gamboa, Professor Auxiliar, Faculdade de Ciências e Tecnologia, Universidade NOVA de Lisboa
Examination Committee
Chairperson: Prof. Dr. Carla Maria Quintão Pereira
Human Crowdsourcing Data for Indoor Location Applied to Ambient Assisted Living Scenarios
Copyright © Ricardo Bruno Barbeiro dos Santos, Faculty of Sciences and Technology, NOVA University Lisbon.
Ac k n o w l e d g e m e n t s
The success of my academic journey, especially in the past months with the development of this thesis, would not be possible without the immense support of several people, who always had my back and surely never let me down.
First of all, I would like to express my gratitude to my academic supervisor, Professor Hugo Gamboa, for his advice and guidance through the all project, and especially, for welcoming me at Fraunhofer AICOS. Thank you for introducing me to the amazing world of data science.
I would also like to thankAssociação Fraunhofer Portugal Research, for giving me the opportunity to work and grow as a professional in an amazing environment, with all the necessary conditions to produce “remarkable technology, easy to use”. Among the exce-lent people I have met, I want to manifest my sincere appreciation to Marília Barandas, one of the persons that most contributed to my success, for her guidance and constant support. I am sure it was not easy to putting up with me in all the endless questions. Thank you! I cannot not leave Ricardo Leonardo out of this list. His help and suggestions during the entire process were also fundamental to the accomplishment of this project. For that, I want to express my gratitude!
I want to give a very special word to the colleagues that accompanied me during this months, in this “thesis life”. Mariana, Patrícia, Rui and Helena, thank you for all the moments of fun and focus we have passed, you certainly made this process easier.
The last five years were, with no doubt, the most enjoyable time of my life. It was surely due to all the incredible people that have crossed my path, whom I am lucky enough to call friends. To the people I have met at FCT, and especially to the members of the “sueca” team, thank you for all the great moments, all the laughs and cries, all the parties and study sessions. To the friends that I have made during my journey at Primark, thank you for all the lessons you taught me, I have grown so much while I had so much fun! To the friends that are standing by my side for a number of years that I cannot count anymore, thank you for everything, you mean so much to me. The stories and adventures we have been through are countless, and so much more are yet to come!
meu lado, por me terem apoiado, dado força e acreditado de que eu era capaz de aqui chegar. Nem sempre foi fácil, mas tudo é possível quando se acredita. Obrigado às minhas avós pela sabedoria que me transmitiram, pela inspiração que são, e pelo carinho que me deram. Ao meu avô, que não teve oportunidade de me ver chegar ao fim deste capítulo, obrigado por tudo, as saudades já apertam. Um muito obrigado final a todos, por nunca terem duvidado de mim e das minhas capacidades, tendo sempre mostrado um enorme orgulho em mim. Sem vocês tudo o que alcancei não seria possível. Espero poder sempre retribuir o vosso amor. Muito obrigado por tudo!
A b s t r a c t
In the last decades, the rise of life expectancy has accelerated the demand for new tech-nological solutions to provide a longer life with improved quality. One of the major areas of the Ambient Assisted Living aims to monitor the elderly location indoors. For this pur-pose, indoor positioning systems are valuable tools and can be classified depending on the need of a supporting infrastructure. Infrastructure-based systems require the investment on expensive equipment and existing infrastructure-free systems, although rely on the pervasively available characteristics of the buildings, present some limitations regarding the extensive process of acquiring and maintaining fingerprints, the maps that store the environmental characteristics to be used in the localisation phase. These problems hinder indoor positioning systems to be deployed in most scenarios.
To overcome these limitations, an algorithm for the automatic construction of indoor floor plans and environmental fingerprints is proposed. With the use of crowdsourcing techniques, where the extensiveness of a task is reduced with the help of a large undefined group of users, the algorithm relies on the combination of multiple sources of information, collected in a non-annotated way by common smartphones. The crowdsourced data is composed by inertial sensors, responsible for estimating the users’ trajectories, Wi-Fi radio and magnetic field signals. Wi-Fi radio data is used to cluster the trajectories into smaller groups, each corresponding to specific areas of the building. Distance metrics applied to magnetic field signals are used to identify geomagnetic similarities between different users’ trajectories. The building’s floor plan is then automatically created, which
results in fingerprints labelled with physical locations.
Experimental results show that the proposed algorithm achieved comparable floor plan and fingerprints to those acquired manually, allowing the conclusion that is possible to automate the setup process of infrastructure-free systems. With these results, this solution can be applied in any fingerprinting-based indoor positioning system.
R e s u m o
Nas últimas décadas, o aumento da esperança média de vida tem acelerado a procura por novas soluções tecnológicas capazes de fornecer, durante mais tempo, uma vida com qualidade. Uma das maiores áreas da Assistência à Autonomia no Domicílio procura monitorizar a localização dos idosos dentro de edifícios. Para tal, os sistemas de posiciona-mentoindoorsão ferramentas valiosas, podendo ser classificados conforme a necessidade de uma infraestrutura de suporte. Os sistemas dependentes de infraestrutura requerem um investimento em equipamento dispendioso. Já os sistemas que não necessitam de uma infraestrutura de suporte, ainda que utilizem as características omnipresentes dos edifícios, apresentam algumas limitações relacionadas com o processo de aquisição e ma-nutenção defingerprints, os mapas que guardam as características ambientais a ser usadas no processo de localização. Estes problemas impedem que os sistemas de posicionamento indoorsejam aplicados na maioria dos cenários.
De modo a ultrapassar estas limitações, um algoritmo para a construção automática de plantas de edifícios e fingerprints ambientais é proposto. Com o uso de técnicas de crowdsourcing, onde a extensividade de uma tarefa é reduzida com o apoio de um amplo grupo indefinido de utilizadores, o algoritmo combina múltiplas fontes de informação, adquiridas de forma não anotada porsmartphonescomuns. Os dados recolhidos por crowd-sourcingsão compostos por sensores inerciais, responsáveis por estimar as trajetórias dos utilizadores, leituras de Wi-Fi e sinais de campo magnético. Os dados de Wi-Fi são uti-lizados para agrupar as trajetórias em pequenos grupos, em que cada um corresponde a uma zona especifica do edifício. Métricas de distância aplicadas aos sinais de campo magnético permitem identificar similaridades geomagnéticas entre as trajetórias de dife-rentes utilizadores. Posteriormente, a planta do edifício é automaticamente construída, resultando emfingerprintsrotuladas com localizações físicas.
Palavras-chave: Assistência à Autonomia no Domicílio,Crowdsourcing, Localização In-door,Fingerprinting, Similaridade de Séries Temporais,Machine Learning
C o n t e n t s
List of Figures xv
List of Tables xix
Acronyms xxi
1 Introduction 1
1.1 Motivation . . . 1
1.2 Objectives . . . 2
1.3 Applications . . . 3
1.4 Literature Review . . . 3
1.4.1 Crowdsourced Fingerprints . . . 5
1.4.2 Crowdsourced Floor Plans . . . 6
1.4.3 Crowdsourced Fingerprints and Floor Plans . . . 6
1.4.4 Discussion . . . 7
1.5 Work Summary . . . 8
1.6 Thesis Overview . . . 9
2 Theoretical Background 11 2.1 Ambient Assisted Living . . . 11
2.2 Human Activity Recognition . . . 12
2.2.1 Sensors . . . 12
2.2.2 Pedestrian Dead Reckoning . . . 14
2.3 Indoor Location . . . 16
2.3.1 Fingerprinting-Based Solutions . . . 16
2.3.2 Fingerprinting Sources . . . 18
2.4 Crowdsourcing. . . 20
2.5 Signal Processing . . . 21
2.5.1 Time Series Analysis . . . 21
2.5.2 Digital Image Processing . . . 24
2.6 Machine Learning . . . 25
2.6.1 Supervised Machine Learning or Classification . . . 26
CO N T E N T S
3 Proof of Concept with Simulated Data 33
3.1 Simulation of Environmental Data . . . 34
3.1.1 Magnetic Field Fingerprints Simulation . . . 34
3.1.2 Wi-Fi Radio Fingerprints Simulation . . . 35
3.2 Generation of Random Routes . . . 36
3.3 Similarity Measures . . . 38
3.4 Map Matching . . . 41
3.5 Classification. . . 43
3.6 Discussion . . . 45
4 Data Acquisition 47 4.1 Routes Design . . . 48
4.2 Data Acquisition . . . 49
4.2.1 Sensors Acquired . . . 50
4.2.2 Acquisition Protocol . . . 50
4.3 Dead Reckoning Parameters Retrieval . . . 51
5 Proposed Algorithm and Results 53 5.1 Wi-Fi Radio Clustering . . . 54
5.1.1 Wi-Fi Data Pre-Processing . . . 54
5.1.2 Features Extraction . . . 55
5.1.3 Clustering Algorithms . . . 56
5.1.4 Clustering Results. . . 57
5.2 Data Processing . . . 61
5.2.1 Trajectories Reconstruction . . . 62
5.2.2 Time to Distance Domain Conversion . . . 64
5.3 Geomagnetic Similarities . . . 66
5.3.1 Data Segmentation . . . 67
5.3.2 Time Series Similarities. . . 68
5.4 Map Matching . . . 69
5.5 Floor Plan Filtering . . . 71
5.6 Fingerprints Retrieval . . . 73
5.7 Real Scenario Test . . . 76
5.8 Discussion . . . 78
6 Conclusions and Future Work 79 6.1 Conclusions . . . 79
6.2 Future Work . . . 80
Bibliography 83
A Dataset’s Routes Design 91
CO N T E N T S
L i s t o f F i g u r e s
1.1 Life expectancy in Portugal. . . 2
1.2 Age structure of the Portuguese population. . . 2
1.3 PIL solution running on a smartphone. . . 4
1.4 Thesis overview scheme. . . 9
2.1 Representation of the smartphone IMU axes and rotation angles. . . 14
2.2 Illustration of the gyroscope’s drift problem. . . 16
2.3 Fingerprint of the vertical component of magnetic field for an office building. 17 2.4 Representation of the Euclidean distance between two distorted signals. . . . 23
2.5 Representation of the DTW distance between two distorted signals. . . 23
2.6 Representation of the WPA distance between a defined window and a signal. 24 2.7 Illustration of a decision tree for a specific dataset. . . 27
2.8 Illustration of a dendogram for a specific dataset. . . 29
2.9 Illustration of the results of K-Means algorithm for a specific dataset. . . 30
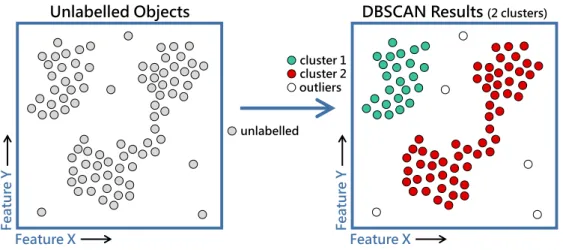
2.10 Illustration of the results of DBSCAN algorithm for a specific dataset. . . 32
3.1 Scheme of the PoC workflow. . . 33
3.2 Representation of the physical space used in the PoC. . . 34
3.3 Magnetic fingerprints used in the PoC. . . 35
3.4 Wi-Fi fingerprints used in the PoC. . . 36
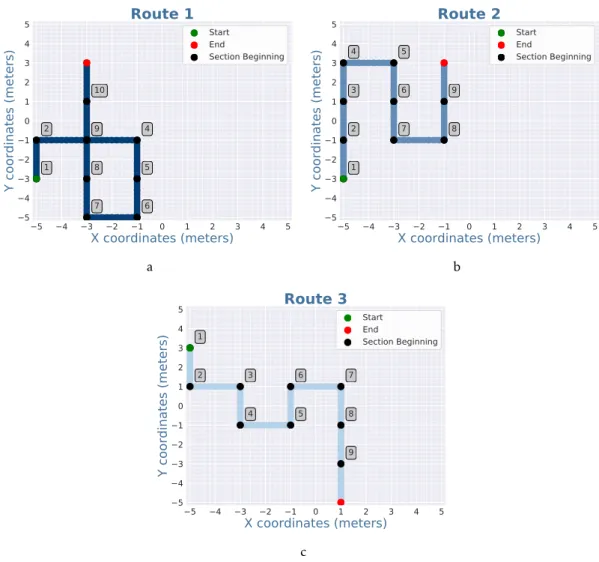
3.5 Trajectories of the three simulated routes in the PoC. . . 37
3.6 Simulated magnetic field with and without noise. . . 38
3.7 Resulting heatmaps from the magnetic field comparisons with DTW. . . 40
3.8 Resulting heatmaps with the computedfinal resultsfor every comparison. . . 41
3.9 Reconstructed maps from the map matching process. . . 43
3.10 Confusion matrix obtained with the Random Forest classifier. . . 44
3.11 Returned map after the classification process. . . 45
4.1 Floor plan of the test building. . . 47
4.2 Simplified floor plan of the test building. . . 48
4.3 Design of four routes of the dataset. . . 49
L i s t o f F i g u r e s
5.1 Scheme of the proposed algorithm workflow. . . 53
5.2 Four routes of the dataset with collected Wi-Fi batches, before the clustering process. . . 57
5.3 Results of DBSCAN algorithm.. . . 58
5.4 Results of HDBSCAN algorithm.. . . 59
5.5 Results of agglomerative clustering algorithm. . . 59
5.6 Results from the elbow and the curvature methods. . . 60
5.7 Results of K-Means algorithm. . . 60
5.8 Final results of the clustering process after the noisy batches removal. . . 61
5.9 Illustration of the timestamps annotation rules with the results of clustering process. . . 62
5.10 Representation of the direction variation circle. . . 62
5.11 Result of the reconstruction process for one route. . . 63
5.12 Illustration of the straight sections identification rules. . . 64
5.13 Illustration of the interpolation of one point to the distance domain. . . 65
5.14 Results of the magnetic signal conversion from time to distance domain. . . 66
5.15 Illustration of the data segmentation process. . . 67
5.16 Illustration of the map matching process. . . 70
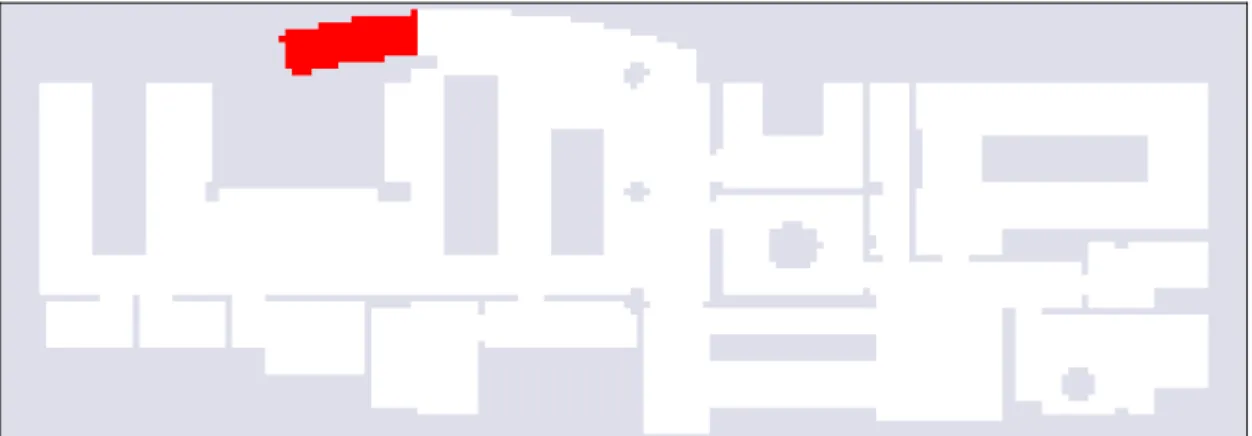
5.17 Resulting floor plan from the map matching process. . . 71
5.18 Final floor plan obtained after the filtering process. . . 72
5.19 Retrieved geomagnetic fingerprint for the magnitude of all axes. . . 74
5.20 Geomagnetic fingerprint for the magnitude of all axes, collected by the tradi-tional methods. . . 74
5.21 Retrieved Wi-Fi radio fingerprint for the AP 84:b8:02:fc:12:9 (2.4 GHz). . . . 75
5.22 Wi-Fi radio fingerprint for the AP 84:b8:02:fc:12:9 (2.4 GHz), collected by the traditional methods.. . . 76
5.23 Interpolated geomagnetic fingerprint for the magnitude of all axes. . . 77
A.1 Design of routes HCrowd00 to HCrowd03 of the dataset. . . 91
A.2 Design of routes HCrowd04 to HCrowd07 of the dataset. . . 92
A.3 Design of routes HCrowd08 to HCrowd11 of the dataset. . . 92
A.4 Design of routes HCrowd12 to HCrowd15 of the dataset. . . 93
A.5 Design of routes HCrowd16 to HCrowd19 of the dataset. . . 93
A.6 Design of routes HCrowd20 and HCrowd21 of the dataset. . . 94
B.1 Retrieved geomagnetic fingerprint for the X axis. . . 96
B.2 Interpolated geomagnetic fingerprint for the X axis. . . 96
B.3 Geomagnetic fingerprint for the X axis, collected by the traditional methods. 96 B.4 Retrieved geomagnetic fingerprint for the Y axis. . . 97
B.5 Interpolated geomagnetic fingerprint for the Y axis. . . 97
B.6 Geomagnetic fingerprint for the Y axis, collected by the traditional methods. 97
L i s t o f F i g u r e s
B.7 Retrieved geomagnetic fingerprint for the Z axis. . . 98
B.8 Interpolated geomagnetic fingerprint for the Z axis. . . 98
B.9 Geomagnetic fingerprint for the Z axis, collected by the traditional methods. 98
B.10 Retrieved geomagnetic fingerprint for the magnitude of all axes. . . 99
B.11 Interpolated geomagnetic fingerprint for the magnitude of all axes. . . 99
B.12 Geomagnetic fingerprint for the magnitude of all axes, collected by the
tradi-tional methods. . . 99
B.13 Retrieved Wi-Fi radio fingerprint for the AP 84:b8:02:fc:12:9 (2.4 GHz). . . . 100
B.14 Interpolated Wi-Fi radio fingerprint for the AP 84:b8:02:fc:12:9 (2.4 GHz). . 100
B.15 Wi-Fi radio fingerprint for the AP 84:b8:02:fc:12:9 (2.4 GHz), collected by the
traditional methods.. . . 100
B.16 Retrieved Wi-Fi radio fingerprint for the AP 84:b8:02:fc:12:9 (5 GHz). . . 101
B.17 Interpolated Wi-Fi radio fingerprint for the AP 84:b8:02:fc:12:9 (5 GHz). . . 101
B.18 Wi-Fi radio fingerprint for the AP 84:b8:02:fc:12:9 (5 GHz), collected by the
traditional methods.. . . 101
B.19 Retrieved Wi-Fi radio fingerprint for the AP 28:6f:7f:0c:66:1 (2.4 GHz). . . . 102
B.20 Interpolated Wi-Fi radio fingerprint for the AP 28:6f:7f:0c:66:1 (2.4 GHz). . 102
B.21 Wi-Fi radio fingerprint for the AP 28:6f:7f:0c:66:1 (2.4 GHz), collected by the
traditional methods.. . . 102
B.22 Retrieved Wi-Fi radio fingerprint for the AP 28:6f:7f:0c:66:1 (5 GHz). . . 103
B.23 Interpolated Wi-Fi radio fingerprint for the AP 28:6f:7f:0c:66:1 (5 GHz).. . . 103
B.24 Wi-Fi radio fingerprint for the AP 28:6f:7f:0c:66:1 (5 GHz), collected by the
traditional methods.. . . 103
B.25 Retrieved Wi-Fi radio fingerprint for the AP 44:e4:d9:3e:f8:4 (2.4 GHz). . . . 104
B.26 Interpolated Wi-Fi radio fingerprint for the AP 44:e4:d9:3e:f8:4 (2.4 GHz). . 104
B.27 Wi-Fi radio fingerprint for the AP 44:e4:d9:3e:f8:4 (2.4 GHz), collected by the
traditional methods.. . . 104
B.28 Retrieved Wi-Fi radio fingerprint for the AP a8:9d:21:98:13:8 (2.4 GHz).. . . 105
B.29 Interpolated Wi-Fi radio fingerprint for the AP a8:9d:21:98:13:8 (2.4 GHz). . 105
B.30 Wi-Fi radio fingerprint for the AP a8:9d:21:98:13:8 (2.4 GHz), collected by the
traditional methods.. . . 105
B.31 Retrieved Wi-Fi radio fingerprint for the AP f4:cf:e2:4f:9d:0 (2.4 GHz). . . . 106
B.32 Interpolated Wi-Fi radio fingerprint for the AP f4:cf:e2:4f:9d:0 (2.4 GHz). . . 106
B.33 Wi-Fi radio fingerprint for the AP f4:cf:e2:4f:9d:0 (2.4 GHz), collected by the
L i s t o f Ta b l e s
4.1 Sampling frequencies of different sensors for each used smartphone. . . 50
5.1 Results obtained in the real scenario test with the retrieved and original
Ac r o n y m s
AAL Ambient Assisted Living.
AP Access Point.
BLE Bluetooth Low Energy.
BSSID Basic Service Set Identifier.
DBSCAN Density-Based Spatial Clustering of Applications with Noise.
DR Dead Reckoning.
DTW Dynamic Time Warping.
GPS Global Positioning System.
HAR Human Activity Recognition.
HDBSCAN Hierarchical Density-Based Spatial Clustering of Applications with Noise.
IMU Inertial Measurement Unit.
IPS Indoor Positioning Systems.
K-NN K-Nearest Neighbours.
MAC address Media Access Control address.
MDS Multidimensional Scaling.
PDR Pedestrian Dead Reckoning.
PIL Precise Indoor Location.
PoC Proof of Concept.
RSS Received Signal Strength.
RSSI Received Signal Strength Indicator.
AC R O N Y M S
WAP Wireless Access Point.
WLAN Wireless Local Area Network.
WPA Windowed P-norm Alignment.
C
h
a
p
t
e
r
1
I n t r o d u c t i o n
1.1 Motivation
The scientific development that has taken place in the last decades has caused enormous changes in human being’s quality of life. Improvements, especially in healthcare, have led to a rise of life expectancy. According to Eurostat1, over the period from 1980 to 2016, the average life expectancy of a Portuguese citizen increased almost 10 years, and is expected to increase further (see Figure1.1).
Given this, the age structure of the population is changing. While the proportion of the working age population is decreasing, the proportion relative to the elderly is taking the opposite course (see Figure 1.2). Considering this, it is imperative to build a sustainable society, where health and social care costs are supportable, while elderly people quality of life is enhanced.
Ambient Assisted Living (AAL)is a concept created in this line of thought. It
com-prises all the research done to create innovative technological solutions to provide better life conditions to the older adults, allowing them to live longer in their preferred environ-ment, independently and safely [1,2].
One of the key tasks ofAALis to monitor the elderly at their homes, either by keeping track on their daily activities, or by knowing their location. An intelligent system installed in every elderly’s home would, for example, identify if the medicines were taken or forgotten, giving an alert if necessary. The monitoring of the number of hours that an elderly slept or the number of times that went to the bathroom, by knowing their positions in their house through the day, could help on understanding if everything is fine.
Positioning systems are thus valuable tools, not only for the elderly, but also for their families and healthcare professionals. These systems can help on ensuring the safety of
C H A P T E R 1 . I N T R O D U C T I O N
the elderly in their homes, providing a fast response in an emergency situation, or even to help them reach some destination, as in a hospital or a supermarket, large buildings where an elderly could easily get lost and disoriented.
WhileGlobal Positioning System (GPS)is the standard solution for outdoor position-ing and navigation, its precision is compromised indoors by the presence of walls and ceilings, which attenuate the received signal. For this reason,Indoor Positioning Systems
(IPS)rely on alternative sources of information to provide location-dependent services
indoors, such as the buildings’ Wi-Fi radio signal distribution or its magnetic field be-haviour.
The ubiquity of the smartphones enhances the dissemination ofIPS. However, the need for some of these systems to have the updated building data hinders IPS to be deployed in most buildings, since the data collection process brings intensive costs on manpower and time. Therefore, it is imperative to improve this process. In the last years, crowdsourcing is being used by organisations to transfer the execution of a task or a process to an undefined group of anonymous users, lowering its costs and increasing the quickness of its conclusion.
With the application of this model, it is expected that the use of crowdsourced data will help on diminishing the time-consuming process of implementation, improving the scalability of currentIPSsystems.
1980 2000 2016 2080
Year 50 55 60 65 70 75 80 85 90 95
Life Expectancy at Birth (years)
Life Expectancy in Portugal
Figure 1.1: Life expectancy in Portugal, with data from 1980 to 2016, and projec-tions for 2080. Data source: [3,4].
1985 2017 2080
Year 0 10 20 30 40 50 60 70 80 90 100 Percentage (%)
Age Structure of the Portuguese Population
0 to 19 yrs 20 to 64 yrs 65+ yrs
Figure 1.2: Age structure of the Por-tuguese population, with data of 1985, 2017, and projections for 2080. Data source: [5,6].
1.2 Objectives
The main purpose of this thesis is to potentiate existing indoor location solutions with the use of crowdsourcing, by diminishing the expensive process of the setup phase, a prerequisite of typical infrastructure-free solutions. Currently, the first step of the setup
1 . 3 . A P P L I CAT I O N S
phase consists on the upload of the buildings’ floor plan, which might need to be con-structed, if not available. The second phase includes the process of collecting fingerprints, the maps of the characteristics of the buildings, which are used as reference to provide the localisation. The setup phase is commonly pointed as a great disadvantage of typical infrastructure-free solutions, for being very extensive and expensive, since it requires an expert to walk through the whole building to collect the necessary data [7].
To overcome these limitations, the main goal of this work is to develop an algorithm that automatically constructs indoor floor plans and collects environmental fingerprints with crowdsourced data. This process will be done without any explicit effort from the
users, since data will be collected during their natural moving inside buildings.
1.3 Applications
The developed algorithm will extend the range of applications forIPS. Besides the afore-mentioned applications for AAL, there are several services that can be improved with indoor location. If applied in a hospital, these systems will be useful not only to locate medical equipment when lost, but also to call the nearest doctors in emergency situations [8]. Another area that will thrive withIPSis the retail. In a mall or a supermarket, for example, indoor location services can help consumers optimise their time, if the ideal route for their shopping list is automatically prepared. For retailers, the possibility to know the behaviour of the consumers inside their stores allows the development of new sales techniques, improving their results [9]. Indoor location will also be helpful in smart homes, where energy savings can be achieved if the location of their inhabitants is known [10]. In large buildings, as conference centres, IPScan help a visitor to navigate to a desired area, or simply to meet a friend in an unknown location. Beyond these examples, there are several other areas that will benefit with indoor location, thus inspiring the development of easily deployable solutions.
1.4 Literature Review
In the last two decades, the effort from the scientific community to develop a robust and
precise indoor location system resulted in an large number of solutions. However, the limitations that these solutions present leave open the search for a system reliable enough to be widely marketed.
AlthoughGPSsignal is not available indoors, several other sources can be used, by taking advantage of the wide range of sensors commonly present in modern smartphones [11] or smartwatches [12], to help in the indoor localisation processes.
C H A P T E R 1 . I N T R O D U C T I O N
can be used, namely ultrasounds [16] or light, either in infrared spectrum [17,18] or in visible light [19], among others. In contrast, infrastructure-free systems use opportunistic readings from signals that are pervasively available in the majority of environments, like magnetic field [20], atmospheric pressure [7,21], ambient light [22] or sound [23,24]. Wi-Fi radio signal readings are also used in this type of system [7,25–27], even though they are emitted by anAccess Point (AP), which can be considered a type of beacon. However, APs are widely present in most of nowadays’ buildings. Both systems can also rely on inertial data collected from the user’s device’s sensors [28, 29], as the accelerometer, the magnetometer and the gyroscope, to characterise the human movement by dead reckoning techniques.
While infrastructure-based systems usually do the localisation process through meth-ods such as trilateralation [13] or triangulation [25], infrastructure-free systems are com-monly based on fingerprinting [7, 30], which consist on maps with the characteristics measured on the buildings.
Figure 1.3: PIL solution running on a smartphone. © Fraunhofer Portugal Research
Precise Indoor Location (PIL)is anIPSdeveloped
by researchers at Fraunhofer AICOS [7], that runs on a common smartphone, as it can be seen in Figure 1.3. This infrastructure-free system relies on smart-phone’s inertial sensors to track users’ movement in a building. Since these sensors accumulate error,PIL system uses fingerprints of Wi-Fi radio and magnetic field to provide more accurate results. With a particle filter that expands while a user walks, the most proba-ble positions are chosen with great certainty. The fin-gerprints used inPILare previously acquired, where a user walks through defined routes with a smart-phone that collects the required data. Besides this, the floor plan of the building needs to be uploaded to the server, so the particle filter can be constrained and the fingerprints can be matched to absolute posi-tions. Even though this system can use Google Maps’ indoor floor plans automatically, the number of avail-able buildings is very limited, making the construc-tion of the floor plans an indispensable process.
Thus, both types ofIPS have limitations. On the one hand, infrastructure-based systems require the installation and maintenance of beacons, which make these solu-tions more expensive and less appealing to be applied in large scale. On the other hand, infrastructure-free systems based on fingerprinting require an extensive process to col-lect and update the fingerprints, mainly in large buildings, which increases the cost of these systems too. To overcome currentIPSlimitations, crowdsourcing is suggested as a way to create self-sustaining systems, which do not require almost any specific human
1 . 4 . L I T E R AT U R E R E V I E W
intervention. There are already some solutions that use crowdsourced data to collect fingerprints, but also to build the floor plans of the buildings, increasing the spectrum of buildings where indoor location can be applied, to any unknown building.
1.4.1 Crowdsourced Fingerprints
The process of building fingerprints is known as the training or offline phase of any
infrastructure-free indoor location system. It consists on the collection of the desired data to be used in the operating or online phase, to provide the location of the user. The larger the building, the more labour-intensive and time-consuming this process becomes, greatly increasing the costs of these systems. Thus, the use of crowdsourcing to automatically build fingerprints stands as a viable solution to solve this extensive and expensive process, where some solutions have been already developed.
One of the most well known solution belongs to Rai et al. [31], who developedZee, an algorithm that collects data from smartphones’ inertial sensors to track users’ paths in indoor environments, while simultaneously performs Wi-Fi scans. The algorithm then combines the inferred trajectories with the constrains of the floor plan given as input, such as walls and other barriers, to obtain the most probable last position of each trajectory. Finally, the remaining positions of each trajectory are obtained with a backward propagation algorithm and the Wi-Fi fingerprints are obtained.
Wu et al. [32] designedLiFS, a complete indoor location system that relies only on the crowdsourced collection of Wi-Fi radio data and step detection to build fingerprints. Instead of using the traditional floor plan in two dimensions, the authors apply
Multidi-mensional Scaling (MDS)to obtain a multidimensional floor plan that stores the distances
between every pair of interest locations. Then, with the application of the same principle to obtain multidimensional fingerprints, each reading is then attributed to a real physical location by corresponding both the new floor plan and the multidimensional fingerprint.
In the work of Niu et al. [33], WicLoc was created, an indoor location system that uses Wi-Fi radio data and inertial tracking to detect steps and turns. They identify similarities between collected signals by computing a distance matrix of fingerprints. It consists on the differences of the Received Signal Strength Indicator (RSSI) between every pair of APs. Then, the distance matrix is converted to the multidimensional space by a modified MDSalgorithm. Finally, the absolute positions of the fingerprints on the floor plans are obtained by comparing the new distance matrix to a set of previously defined anchor points.
C H A P T E R 1 . I N T R O D U C T I O N
deployed.
1.4.2 Crowdsourced Floor Plans
The floor plan of a building is required to most of infrastructure-free indoor location systems, not only to obtain the fingerprints over an absolute reference, in the case of infrastructure-free systems. A floor plan is also needed to allow the navigation process, so the system can drive the user to a destination, considering the constrains of the building. However, floor plans might not be always accessible, or may not even exist. Thus, the process of constructing floor plans is often necessary. However, it is also an extensive and time-consuming process, especially for large buildings, which may be unaffordable.
As a result, new techniques for automatic floor plans construction have been developed exploiting the use of crowdsourcing.
CrowdInsidewas designed by Alzantot and Youssef [35]. It is an automatic floor plan construction system that leverages smartphones’ inertial sensors to reconstruct users’ trajectories. To avoid the error accumulation of noisy sensors, this system identifies anchor points, which correspond to unique sensor signatures, as when a user passes by an elevator or by stairs. With the information of the initial position, which corresponds to the last known GPS coordinate, all trajectories are matched and corrected with the anchors, and at last the floor plan is obtained.
Shen et al. [36] developedWalkie-Markie, an algorithm that uses dead-reckoning to recognise users’ movement and relies on buildings’ Wi-Fi infrastructure. The algorithm identifiesWiFi-Marks, locations at which the trend of theReceived Signal Strength (RSS) of anAPreverses. Given the initial position of each reconstructed trajectory, the system assigns absolute positions to everyWiFi-Mark. Finally, by identifying similarities between them, trajectory errors are corrected and the final floor plan is obtained by merging all trajectories.
1.4.3 Crowdsourced Fingerprints and Floor Plans
To be deployed in large scale, such as in every elderly’s residence or healthcare facility, an IPSneeds to be cheap to install and to maintain, without compromising its results. In order to achieve this, the scientific community has developed, in the last years, new autonomous systems that do not require any specific human intervention, allowing its application in any unknown building. New solutions have been published regarding the automatic construction of floor plans and the simultaneous mapping of fingerprints, relying only on crowdsourced data.
In the work developed by Shin et al. [37],SmartSLAMis a new solution to construct automatic indoor floor plans and Wi-Fi radio fingerprints. They use a variant of
Simulta-neous Localisation and Mapping (SLAM), a technique commonly used in robotics, where
the location is provided by dead reckoning techniques and the mapping of unknown areas is done at the same time. Since smartphones’ noisy sensors accumulate too much
1 . 4 . L I T E R AT U R E R E V I E W
error, the authors implemented a particle filter to weight the possible positions. With the Wi-Fi readings obtained through the users’ trajectories, the floor plans are built, along with the radio fingerprints.
Leveraging the use of the magnetic field interferences, instead of the buildings’ radio data, H. Luo et al. [38] designed a solution that uses crowdsourcing to build automatic floor plans and magnetic field fingerprints. They apply hierarchical clustering to the process, where the first step consists on separating the routes by straight segments. Then, these segments are clustered by their length, the average of the absolute heading and finally their similarity on the magnetic field behaviour. Finally, the floor plan is con-structed by merging routes with identified similarities and then the magnetic fingerprint is obtained.
PiLocis anIPSdeveloped by C. Lou et al. [39]. It also uses inertial data to track the users and Wi-Fi radio data to construct the floor plans and fingerprints. Their system consists on clustering all trajectories by theirAPcoherence, that is, joining in the same cluster all the trajectories that haveAPs in common. With this, the authors separate the crowdsourced data by floor, since normally anAP can’t be read in different floors, due
to construction materials attenuation. Then, the algorithm segments the trajectories by curves and straight lines with a minimum length and compares their inertial behaviour and Wi-Fi data trends to identify similarities. To obtain the final floor plans and finger-prints, all trajectories are merged. This systems also allows the automatic update of the obtained floor plans and fingerprints.
Lastly, Wang et al. [40] createdUnLoc, a completeIPSthat has the same principle as CrowdInside, since it relies on the landmarks of a building, locations with specific signa-tures. These landmarks can be previously defined (seeded) if the floor plan is available, or can be organic if identified by the algorithm. Inertial Wi-Fi radio and magnetic field data is compared to identify patterns. At the same time, users’ trajectories are reconstructed using dead reckoning techniques, with the definition of the last known location, which corresponds to the last knownGPScoordinate. If the patterns are coherent in terms of location, even with some accepted error, they become a landmark. In the localisation phase, those landmarks are used to correct dead reckoning errors to provide an accurate absolute position.
1.4.4 Discussion
Even with this large number of solutions that apply crowdsourcing to indoor location, the market is still waiting for the announcement of a solution that is robust enough to satisfy all the needs.
While some solutions require the input of the floor plan to automatically build finger-prints, others only are able to construct floor plans, leaving the problem of the extensive process of mapping fingerprints unsolved.
C H A P T E R 1 . I N T R O D U C T I O N
some limitations still discourage the investment on their application worldwide. In Smart-SLAM[37], the way that the particle filter is developed to reconstruct the movement, only allows the system to build maps with the layout of the buildings’ main corridors, requir-ing a further process to explore unmapped areas. The solution presented by H. Luo et al. [38] will have problems if applied in large buildings, since every segmented signal is compared to each other, rising the processing costs. Contrarily,PiLoc[39] only works for large buildings due to the fact that the system only segments curves with more than 10 steps and straight line paths with more than 30 steps, a number too high for an elderly’s home, for example. Finally, UnLoc[40] needs at least one seeded landmark to trigger the system, which can be for example the entrance of a building, with aGPScoordinate. The system will start working only when a user passes by this landmark, a requisite that might not be feasible in buildings with multiple entrances, as a hospital.
Thus, the system proposed in this thesis aims to solve these problems, creating an autonomous crowdsourcing solution that relies on inertial, magnetic field and Wi-Fi radio data, without any specific effort from the users. Using information pervasively available
in every building, it will be possible to offer a solution with conditions to be widely
deployed. Without any restrains concerning the buildings’ dimensions, the applicability of this system will go from small environments, such as homes, to big environments, such as hospitals, malls or airports.
1.5 Work Summary
The goal proposed on this thesis will be achieved with the use of diverse techniques. The data acquisition is done by leveraging the ubiquity of smartphones in our daily life. Common smartphones are now equipped with a wide range of sensors that can be used to understand the human motion and behaviour. Crowdsourcing will be applied by collecting huge amounts of non-annotated data, by different users on different
smart-phones. The automatic construction of floor plans and environmental fingerprints will be accomplished by identifying similarities between the reconstructed routes.
The algorithm will apply different techniques to process different types of information.
Inertial sensors provide information about the linear and angular velocity of the users, that is processed to obtain the characterisation of the movement, as the detection of steps and their length and direction computation. Wi-Fi radio data will be processed with unsupervised machine learning techniques, to restrain the area to search for similarities, that will be further discovered by applying time series analysis methods to the magnetic field data. Finally, the algorithm will match all the identified similarities to obtain the final map and the necessary fingerprints.
All the algorithms created in this work will be tested in Fraunhofer AICOS’s PIL solution, a fully developed indoor localisation system that has some features to allow the verification of this algorithm’s quality.
1 . 6 . T H E S I S OV E RV I E W
1.6 Thesis Overview
This thesis is organised in 4 main elements, divided into six chapters and two appendices, as it is outlined in Figure1.4.
3
Basisi Developments Conclusions
Introduction
Theoretical Background
Proof of Concept with Simulated Data
Data Acquisition
Proposed Algorithm and
Results
Conclusions and Future
Work 4
5 1
2
6
Appendices
Dataset's Routes Design
A Retrieved, Interpolated
and Original Fingerprints B
Figure 1.4: Thesis overview scheme.
The basis element is composed by the first two chapters. The current chapter intro-duces the problem that motivated this research, as well as the literature review about the automatic construction of floor plans and environmental fingerprints topic and the brief explanation of the developed work. Chapter2aims to contextualise the reader to the concepts and methods used in this thesis.
The second element of the current work includes three chapters that comprise all the achieved developments. A first approach to test the feasibility of the proposed objectives is explained in the Proof of Concept (PoC) of Chapter3. After the evaluation of the preliminary results, Chapter4describes the process of data collection, that was used in the development of the proposed algorithm of Chapter5. This chapter not only explains the functioning of the final solution, but also presents the intermediary results, obtained through all the steps of the development, as well as the final results.
Chapter6constitutes the third element and makes the final balance of this thesis, where the taken conclusions are discussed and some future guidelines are suggested.
C
h
a
p
t
e
r
2
T h e o r e t i c a l Ba c k g r o u n d
To properly understand this work, the applied concepts are presented in this chapter. Firstly, theAmbient Assisted Living (AAL) concept is introduced, followed by the con-cepts involving the Human Activity Recognition (HAR). Next, an explanation about fingerprinting-based indoor location is given, including all the types and information sources commonly used. Finally, the signal processing techniques used in this project are described and concepts about machine learning are presented.
2.1 Ambient Assisted Living
AALencompasses all the technological products and services developed to improve the quality of life of older adults and people with special needs, in all aspects [41]. The main objective ofAALis to increase the safety and autonomy of these people, allowing them to stay at their preferred environment longer, usually their homes [8].
The demand for these technologies emerged due to the changes in world’s demogra-phy. The rise of the life expectancy in developed countries is changing the age structure of the population. While the number of the elderly population is increasing, the working age population, responsible for sustaining the costs of the healthcare systems, is compar-atively declining [1]. This unbalance, along with the fact that an ageing population is more prone to age-related diseases, such as Alzheimer’s disease or Parkinson’s disease, rises even more the healthcare costs [42].
To overcome these problems, several research support programmes have been created. The Active and Assisted Living programme1 funds projects in the field of information
and communication technologies. This programme is co-founded by the European Com-mission and 19 other countries of the European Union, with the main goal of encouraging
C H A P T E R 2 . T H E O R E T I CA L BAC KG R O U N D
researchers to develop new technologies and services for ageing well [2].
AALtechnologies are supported by several techniques, that have been developed in the last years. Activity recognition is one of the main tasks inAAL, where several sensors and cameras are combined with intelligent programming, such as machine learning, to monitor elderly people through their day. With this, it is possible to create anomaly detection algorithms, useful to identify problems, as a fall or even a heart attack. Context modelling is another task, which consists on structuring the available information of the users, such as their profile, medical history and data collected from sensors, for example, to be used in several applications. Automatic planning is another important mission, where applications and devices can help older adults to not forget to take their medicines, among other uses. Finally, location services are very useful to track and monitor elderly people outside, whereGPSis used, and inside, with the rising ofIPS[41,43].
2.2 Human Activity Recognition
HARis one of the most important tasks inAAL. It is defined as the capacity of a system to automatically interpret a body gesture or a movement, thus classifying it as an action or activity [44]. This process aims to monitor people in their daily life, while they move naturally. HARis very challenging since human activities are very diverse and complex, where most of the times different activities have similar movements [45].
There are numerous applications whereHARis useful, especially inAAL. Monitoring the activities performed by an elderly through the day makes it possible to know if everything is fine, without the permanent presence of a healthcare professional or a relative. A system that identifies if the monitored elderly has forgotten to take their medication can be very effective on avoiding further health problems, for example.
In the scope of indoor location, some types ofIPSare based on the reconstruction of the trajectory described by the users, so it is important to recognise not only their movement, but also its characteristics. To achieve this, HAR techniques are employed and some specific sensors are used to collect the necessary data.
2.2.1 Sensors
The development that happened in the last decades in microelectronics and computer systems allowed the creation of a wide range of sensors. They are now small, low-cost and come with a high computational power. With all these characteristics, sensors are being used to collect pervasive data that is used to recognise human activities [46].
To address this issue, sensors are mainly deployed in two ways. External sensors are fixed in interest locations, where the user is supposed to interact with. Smart homes are based in this type of sensors, where actions are triggered when the user passes by, in the case of a motion detector, or touches it, in the case of a faucet. Cameras, normally used in
2 . 2 . H U M A N AC T I V I T Y R E CO G N I T I O N
surveillance systems, are also considered a type of external sensor, since the recognition of gestures and actions can also be identified by the image processing [46].
Contrarily, wearable sensors are attached to the user, measuring continuously the interest data [46]. These sensors are usually available in devices that we use everyday, as in smartphones, smartwatches or smart clothes. This last type is commonly used to monitor physiological conditions in elderly people and athletes [47]. Wearable sensors can measure various types of data, normally related to the user’s movement, as the accel-eration, physiological signals, as the heart rate, or user’s environmental conditions, as the temperature or air pressure [46].
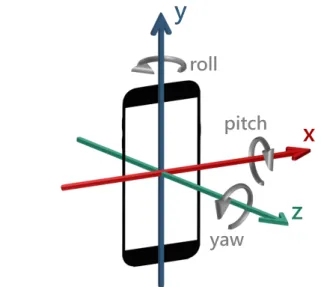
Inertial sensors are the ones that allow the reconstruction of users’ trajectories, be-ing for this reason very important for this work. These sensors are available in almost every smartphone in anInertial Measurement Unit (IMU). IMUs are electronic devices composed by an accelerometer, a gyroscope and usually a magnetometer, the necessary sensors to reconstruct the users’ movement.
• Accelerometer: This sensor aims to measure the device’s linear acceleration relative to a fixed referential, the Earth’s. IMUs accelerometers usually sense data along three axes: x (lateral), y (vertical) and z (longitudinal), as it can be seen in Figure 2.1. The measured acceleration is frequently represented using SI units, meters per second squared (m/s²), but some devices measure in g-force units (g). The measured signal has two components, one is static, and is caused by the Earth’s gravitational acceleration, and the other is dynamic, caused by the device’s movement. This last component allows the identification if a user is standing or moving, as well as his/her linear velocity.
• Gyroscope: This sensor is used to measure the angular velocity of a device, and can be used to compute its relative orientation to a previous instant. The SI units for the angular velocity are radians per second (rad/s).IMUs gyroscopes are normally three dimensional too, with the same axes as the accelerometer. After the integration of gyroscope data, (pitch, roll, yaw) are obtained, which represent the rotation angles around the (x, y, z) axes, respectively (Figure2.1). Thus, it is possible to identify if a user is moving forward or changing direction.
C H A P T E R 2 . T H E O R E T I CA L BAC KG R O U N D
y
x
z
roll
pitch
yaw
Figure 2.1: Representation of the smartphoneIMUaxes and rotation angles.
Leveraging the ubiquity of smartphones in our daily life,IPSare normally deployed in these devices. The smartphone is thus responsible for collecting the necessary data to reconstruct the movement, through the built-inIMU. Then, the information is processed locally or remotely, and the user’s position is displayed on an interface, where he/she can interact. Considering the role of smartphones for indoor location, they will be used in this work to collect data from theIMU, to reconstruct the trajectories developed by the users.
2.2.2 Pedestrian Dead Reckoning
Dead Reckoning (DR)is a technique used mainly in navigation to infer a trajectory or a
path described by a person or a vehicle, but also to predict their next positions. DRhas many applications, as in marine or air navigation. The goal is to determine the positions by which some ship or aircraft will pass over time, considering their current speed and direction [48].
Pedestrian Dead Reckoning (PDR)is one of the most recent applications ofDR, where
this technique estimates the successive positions of a person, from a known initial point, by estimating his/her travelled distance and the direction of the movement [49]. To reconstruct the movement, data collected from theIMUsensors is processed.
The first phase consists on detecting the moments where the user took a step, as well as their corresponding length. To do this, the linear acceleration retrieved from the accelerometer is used. Theoretically, the integration of the linear acceleration should be enough to obtain the user’s velocity and travelled distance. However, the error of the low-cost accelerometers inIMUs prevents an accurate estimation [50]. Thus, the analysis of the human gait movement allowed the understanding that this cyclic pattern is well reproduced in the magnitude of the accelerometer signal [7]. A step happens in the moment when a person touches the floor, which causes a vertical peak on the acceleration.
2 . 2 . H U M A N AC T I V I T Y R E CO G N I T I O N
Thus, the identification of this peak allows the step moments detection.
After the step detection, the step length can determined by several techniques. The constant model [39] considers that the step length is approximately always the same, considering or not an error for the calculations. The linear model [51] determines the step length by the following equation:
Step Length=A+B·Freq+C·V ar+w (2.1)
whereFreqis the step frequency and V ar the step acceleration variance. A, Band C are linearly regressive parameters, previously determined in the training phase, and wthe added Gaussian noise. The non-linear model [7] consists on an empirical relation between the peaks of the vertical acceleration and is described by the following equation:
Step Length=K·p4Amax−Amin (2.2)
whereAmaxandAminare the maximum and minimum vertical accelerations of a step, respectively. Kis a calibration constant, recursively adjusted by the least-squares method. The non-linear model is the most used since it only requires one estimated parameter, facilitating its use.
The second phase ofPDRconsists on determining the direction of every step. Two approaches can be considered. The first uses the magnetometer signal to identify the absolute orientation of the device to the North Pole [50]. However, this method might fail indoors, since the interferences that affect the magnetic field deviate the North estimation,
as it is explained in Section2.3.2.2.
The second approach computes the changes of direction between steps, using the vertical axis of the gyroscope in the Earth frame. The conversion of the device to the Earth frame is known as sensor fusion [7]. It consists on identifying the long-term directions of the gravitational acceleration and the North Pole, provided by the accelerometer and the magnetometer, respectively. With this information, the coordinates of the device are transposed, to align the device to the Earth, which is independent from the device orientation on the body. This allows the identification of the variations on the trajectory’s direction, although with some error. The short-term accuracy of the gyroscope causes the inferred trajectory to drift, producing a cumulative error as it can be seen in Figure2.2. To solve this problem, Guimarães et al. [7] eliminate small direction variations, based on the principle that a user tends to walk straight in the corridors of a building.
C H A P T E R 2 . T H E O R E T I CA L BAC KG R O U N D
Figure 2.2: Illustration of the gyroscope’s drift problem, where the inferred direction is traced in blue. The algorithm of Guimarães et al. [7] corrects the drift, obtaining a more accurate heading, traced in green. The pointed curve represents the original route. Image retrieved from [7].
2.3 Indoor Location
Indoor location is an active research area that comprises all the systems created to provide localisation-based services indoors, either to locate people or objects, whereGPSsignal is unavailable. To face the complexity of this area, numerous solutions that use different
ap-proaches have been unveiled. Indoor location systems can be classified in two categories, according to the type and the source of the information required to be processed.
Infrastructure-based indoor location systems depend on previously installed beacons through the buildings, that function as a source of signal that will be interpreted by the devices to be located or vice-versa. Contrarily, infrastructure-free systems rely on information pervasively available in the buildings that is collected and processed by the same devices. This thesis aims to make improvements in fingerprinting-based solutions, a type of systems of infrastructure-free Indoor Positioning Systems (IPS), as it will be further explained.
2.3.1 Fingerprinting-Based Solutions
Fingerprinting is one of the most applied methods to provide infrastructure-free indoor localisation. These solutions rely on fingerprints, which are floor plans that store the characteristics of the buildings. These characteristics depend on the formulation of the solution and consist on the pervasive signals available in each building. Figure2.3shows a fingerprint of the vertical component of the magnetic field for an office building. A
fingerprint is relative to a specific location, where each coordinate of the two dimensional
2 . 3 . I N D O O R LO CAT I O N
Cartesian plane refers to the same coordinates of the respective building, being meaning-less if applied in another. For this reason, fingerprinting-based solutions must identify the buildinga priori, so the correspondent fingerprints can be loaded [30].
Figure 2.3: Fingerprint of the vertical component of magnetic field for an office building.
© Fraunhofer Portugal Research
The fingerprints of each building must be collected before the launch of the system. The process of collecting fingerprints consists on acquiring data from the necessary sources of information with a smartphone, for example. Passing by every location of the building, the fingerprints are progressively mapped. In large buildings, this process becomes very extensive, rising the costs ofIPS. In an attempt to overcome this problem, Guimarães et al. [7] developed a system that is capable of compute the fingerprints of unmapped positions, according to the distance of the nearby mapped positions. This way, the necessary coverage of the map is diminished, easing the collection process.
The location is usually obtained by the following process. At an unknown location, when the application running on the device to be located sends a localisation request, the system will record the fingerprint at that location, by registering the data coming from the desired sensors. If the system runs online, the data will then be sent to the server to be compared to every position of the complete fingerprints in the database. The difference
of an offline system is that it has the building’s fingerprints stored in the device’s memory.
Then, the most similar position in the fingerprint is the most likely location of the device. However, the variability of the data, even in different times of the day, often affects the
localisation process, returning a wrong location. Thus, improvements have been made to the existing solutions to overcome these problems.
C H A P T E R 2 . T H E O R E T I CA L BAC KG R O U N D
accumulation, making solely dead reckoning solutions very inaccurate. WhenPDRand fingerprint-based systems are employed together, it is possible to improve the reliability of infrastructure-freeIPS. This fused mechanism often works resorting to a particle filter.
A particle filter is a technique that implements a Bayesian filter using a Sequential Monte Carlo method [53], on which a set of random particles are distributed through the building. A particle is defined by a probability of a certain position to be the real position of the device. The probability of every particle is initially the same, but each one is updated and propagated to its neighbouring positions over time, depending on the readings of the environment and the movement of the user. Weighting every available information, the probabilities of some particles increase, meaning that they are possibly close to the real location, while the probabilities of others decrease to the point that they do not make sense anymore. Some solutions, like the one developed by Guimarães et al. [7], are able to estimate the area where the user initially is, on which the particles are distributed. Then, their propagation considers the progression of the user’s movement and their susceptibility to error, as well as the readings from the environmental data. So-lutions that use particle filtering allow the navigation in a building, instead of providing a singular response to a localisation request.
2.3.2 Fingerprinting Sources
Several information sources can be employed toIPS. Although the use of many informa-tion sources heightens the complexity of these systems, it also improves their accuracy. Thus, a trade-off between the complexity and the accuracy must be carefully planed.
The information of the environmental magnetic field and Wi-Fi radio data, available on almost every building, are believed to be very useful [7, 26, 28]. Therefore, these two sources will be used in this work.
2.3.2.1 Wi-Fi Radio
The use of Wi-Fi radio as a pervasive signal is done due to the great availability of Wi-Fi networks in most of nowadays buildings, along with the fact that almost every mobile device has a built-in Wi-Fi receiving module, especially in smartphones.
The basis of every Wi-Fi network is a Wireless Access Point (WAP), or commonly named just asAccess Point (AP). APs are the devices that allow the connection of a Wi-Fi device to a wired network, typically the Ethernet, by projecting its signal wirelessly. Fin-gerprinting often uses two main features of Wi-Fi networks: the name that characterises everyAPand its perceived signal strength.
EveryAPis characterised by a unique name, theBasic Service Set Identifier (BSSID). This unequivocal designation is given by theMedia Access Control address (MAC address) of the equipment, a 48-bit sequence with 12 hexadecimal numbers. The first six numbers identify the manufacturer and are established by the Institute of Electrical and Electronics Engineers (IEEE). The last six are attributed by the manufacturer to every equipment,
2 . 3 . I N D O O R LO CAT I O N
under the constrains of uniqueness. Besides this, an APoften is capable to transmit in two radio bands, the 2.4 GHz and the 5 GHz. For each radio band, depending on the AP, severalWireless Local Area Network (WLAN)can be configured. This happens very frequently when a network provider, as an university, wants to offer different network
services to different users, as for students and teachers. EveryWLANis identified by a
also unique name, commonly given by a variation of the last character of theAP’s original
BSSID. Thus, for localisation purposes, since an APcan be characterised without any
ambiguity, it is possible to identify the specific area where a device is by identifying the
MAC addressof theAPthat is transmitting the collected Wi-Fi radio signal.
The characteristics and the behaviour of the Wi-Fi radio signal are also useful for indoor localisation. This signal is transmitted by theAPs’ antennas and is expressed in milliwatt (mW) units. However, since the Wi-Fi signal has a low transmit power, the
Received Signal Strength (RSS)values in mW would be too difficult to interpret, due to
the high number of decimal places. Thus, the signal values are converted, by the Wi-Fi devices, to more intuitive forms, expressed by the Received Signal Strength Indicator
(RSSI)values. TheRSSIcan be represented as a dimensionless measure that translates
the relation between the strength power and a value, commonly from 0 to 60, 100 or 255, depending on the manufacturer [54]. However, most systems express the Wi-FiRSSin decibel milliwatt (dBm) units, as the Android operative system [55]. dBm is the absolute signal power over a logarithmic relation, being expressed in decibels (dB) with reference to 1 mW. This relation is obtained by the following equation:
PdBm= 10log10
P
1mW
(2.3)
The values of dBm tipically vary between 0 and approximately -100. The higher the value, the better the quality of the signal. Since this representation comes in a logarithmic scale, the quality does not vary linearly. Instead, it follows the rule of the 3s and 10s. This means that a gain of 3 dBm doubles the signal strength in mW, while a loss of 3 dBm halves it. Besides this, if the strength gains 10 dBm, the strength in mW is multiplied by 10, as well as the opposite. For example, if a transition from -20 to -10 dBm is registered, then the strength rises from 0.01 to 0.1 mW. Regarding the decay pattern of the Wi-Fi signal strength, it follows a Gaussian distribution, where its signal strength decreases with the increasing of the distance between theAPand the receiving device [56].
The use of Wi-Fi radio signal for fingerprinting requires the collection of many finger-prints, one for each detectedAP, in each radio band. However, this source of information has some problems. The main challenges of using Wi-Fi radio signal for fingerprinting are related to the fact that its decay pattern can be very affected by the involving
environ-ment. This signal often suffers of problems such has diffraction, reflection, scattering or
C H A P T E R 2 . T H E O R E T I CA L BAC KG R O U N D
distance of only one meter from anAP. The variability of the readings when the user was facing front and back theAPreached 5 dBm, which is enough to affect the positioning.
2.3.2.2 Geomagnetic Field
The earth’s magnetic field has great potential for indoor location, due to its omnipresence. Although the intensity of the geomagnetic field changes around the world, varying from about 24 to 66µT, in the same area, this value remains stable. For example, accordingly to IPMA2[57], in continental Portugal the intensity of the magnetic field varies around 44µT.
The stable pattern of the geomagnetic field is affected indoors. The presence of
metal-lic construction materials and electrical equipment causes the local magnetic field pattern to change. However, these anomalies are stable over time, as long as the layout of the building remains the same [28]. Thus, the uniqueness of these disturbance patterns can be used to identify a physical location. Fingerprinting-basedIPScan easily rely on the pervasive magnetic field of every building, through the mapping of its magnetic finger-prints. Commonly, a fingerprint is mapped for every axis of the magnetometer, as well as for its magnitude.
Nevertheless, some problems can be pointed out as impediments to the solely use of this source for infrastructure-free indoor location. The fact that the geomagnetic field is very weak lows the discernibility of this signal, due to the high amount of electromag-netic noise sources, making it difficult to process. Furthermore, the variability that the
readings of magnetic signal suffer between different devices also becomes a problem if
the necessary processing is not properly considered [28]. Thus, the use of several sources of information to support indoor location systems, although it represents an increase to the complexity of the system, also increases the quality of its results.
2.4 Crowdsourcing
Crowdsourcing is a term that defines a contribution model employed by individuals, organisations and companies to solve a problem, develop a task or to reach a goal, relying on the contribution of a group of anonymous people, the crowd [58,59]. With an open call, where the participation of the users is voluntary, the crowdsourcers obtain help from a heterogeneous group of individuals with different knowledge and experience.
Two techniques can be defined, depending on the contribution of the crowd. In participatory crowdsourcing, users contribute actively to reach the final goal, by perform-ing some computations or generatperform-ing data. When the users participate in an passive way, crowdsourcing is said opportunistic. In this type, devices are used to automatically collect data from sensors, or use their processing power to perform some computations, 2IPMA (Instituto Português do Mar e da Atmosfera) is the Portuguese Institute for Sea and Atmosphere.
2 . 5 . S I G N A L P R O C E S S I N G
generally in device’s background [58]. In this work, since the objective is to develop a solu-tion that does not require any explicit effort from the users, opportunistic crowdsourcing
is the ideal technique to be used.
Smartphones are excellent devices for opportunistic crowdsourcing, since they not only are equipped with a wide range of sensors, but also are almost permanently con-nected to the internet. Besides the use of crowdsourcing for indoor location, there are several other uses of opportunistic crowdsourcing. A common use of this type of crowd-sourcing in our daily lives is the traffic information provided in real time by mobile
navigation apps, as in Google Maps app. These apps rely on data collected from the users’ devices, that is automatically sent to the company’s servers to be processed. Finally, the traffic on the desired route is provided to the user [58]. Participatory crowdsourcing can
also be applied in outdoor navigation apps, as in Waze, where users are called to report events, such as accidents or police operations.
Several other applications use crowdsourcing to reach their goals. Collaborative trans-lation is one of the examples, where a group of people can be called to help on translating documents, thus lowering its costs and fastening its completion. Crowdfunding is seen as a variation of crowdsourcing, where projects are funded by people that share the same interests. In this case, with a monetary contribution, instead of working for some task, the crowd supports the development of a product, for example, and often receives a pro-totype before it reaches the market. Among several others, Wikipedia is another example of participatory crowdsourcing, on which a "collaborative encyclopedia" is constructed with the expertise and experience of users worldwide.
2.5 Signal Processing
A signal is defined as a function that carries information about the behaviour of a system or the characteristics of some phenomenon, and can either exist in nature or can be syn-thesised [60]. Thus, useful information can be extracted from signals to help developing new systems, by the means of signal analysis, one of the areas of signal processing. Be-sides this, signal processing also includes the techniques that are use to modify signals so they can be improved.
In this work, two main types of signal will be handled. Time series are the first type of signal to be processed, in order to obtain useful information to be used in the algorithm that will be created. Images are the second type of signal that will be processed, with the purpose of improving the final solution.
2.5.1 Time Series Analysis