Andreia Teixeira Ferreira
Licenciada em Bioquímica
Phage Display as a Tool for Generation of
Bio-therapeutic Agents for Breast Cancer
Dissertação para a obtenção do grau de Mestre em
Genética Molecular e Biomedicina
Orientador: Doutora Ana Barbas
Co-orientador: Doutor Tiago Bandeiras
Júri:
Presidente: Doutora Ilda Sanches
Arguente: Doutor Colin E. McVey
Presidente: Arguente:
Vogal:
II
Andreia Teixeira Ferreira
Licenciada em Bioquímica
Phage Display as a Tool for Generation of
Bio-therapeutic Agents for Breast Cancer
Dissertação para a obtenção do grau de Mestre em
Genética Molecular e Biomedicina
Orientador: Doutora Ana Barbas
Co-orientador: Doutor Tiago Bandeiras
Júri:
Presidente: Doutora Ilda Sanches
Arguente: Doutor Colin E. McVey
Presidente: Arguente:
III
Phage Display as a tool for generation of bio-therapeutic agents for Breast Cancer
Copyright Andreia Teixeira Ferreira, FCT/UNL, UNL
V
Agradecimentos
Em primeiro lugar quero deixar um agradecimento muito especial aos meus orientadores, Doutora Ana Barbas e Doutor Tiago Bandeiras. Agradeço por me terem aceitado e por todo o apoio, amizade e pela confiança que depositaram em mim durante todo o percurso.
Também quero agradecer à Márcia por ter sido a minha parceira nesta caminhada, pela simpatia e por toda a ajuda e disponibilidade na realização deste projeto. Fomos equipa nos bons e nos maus momentos e conseguimos sempre ultrapassar todos os obstáculos.
O meu muito obrigado a todos os meus colegas de ambos os laboratórios. Às super mulheres do laboratório 4.15, Joana, Inês, Fernanda, Liliana, Khrystyna, Gabriela, Sandra e também ao António, por me terem apoiado, por me ensinarem a ser sempre melhor e a desenvolver o meu sentido crítico, e principalmente pelos bons momentos que partilhamos. Aos colegas do SBDD, Cristiana, Paulo, Micael, Joana, Ana Teresa, Elisa, Pedro e Sara pelo companheirismo, aprendizagem e especialmente pela boa disposição e pelas gargalhadas, que tanto me animaram e fizeram com que me sentisse sempre mais feliz.
Agradeço a toda a Unidade de Cristalografia do ITQB, pelo auxílio e por tudo aquilo que me ensinaram. À Unidade de Tecnologia de Células Animais do IBET por me ajudarem sempre que precisei e ao ITQB/IBET que tornou possível a realização desta tese.
Queria também agradecer aos meus amigos por me terem apoiado e por acreditarem em mim. Ao meu namorado, que embora longe, me deu força para continuar e sempre me incentivou a trabalhar mais e melhor.
VII
Resumo
A via Notch é uma via de sinalização conservada, que desempenha um papel fundamental em vários processos celulares tais como renovação de células estaminais, divisão e diferenciação celular e apoptose. Em mamíferos, encontram-se descritos quatro recetores e cinco ligandos da via Notch, cuja interação se dá através dos seus domínios extracelulares, causando uma ativação da transcrição de diferentes genes alvo. A elevada expressão dos ligandos da via Notch tem sido detetada em vários tipos de cancro, incluindo o cancro da mama, o que sugere que estas proteínas representam possíveis alvos terapêuticos.
O principal objetivo deste trabalho foi gerar proteínas alvo de boa qualidade e, recorrendo à
tecnologia de phage display, selecionar anticorpos inibidores de função específicos para os ligandos
da via Notch. O Phage Display é uma poderosa técnica que permite gerar anticorpos altamente
específicos para fins terapêuticos, e já mostrou ser um método muito fiável para a identificação e validação de novos alvos relacionados com o cancro. Adicionalmente, pretendíamos resolver a estrutura tridimensional dos ligandos Notch isolados e em complexo com os anticorpos selecionados.
Neste trabalho, foi primeiramente otimizada a expressão e purificação de um mutante do
ligando Delta-like 1 de humano (hDLL1-DE3) através do refolding de corpos de inclusão de E.coli.
Para confirmar a atividade biológica da proteína produzida foram realizados estudos funcionais que revelaram que o tratamento com a proteína hDLL1-DE3 levou a uma modelação da transcrição de
genes alvo da via Notch. Numa segunda fase deste estudo, por phage display, foram gerados
fragmentos de anticorpo (Fabs) específicos para a hDLL1-DE3 utilizando a proteína produzida como
alvo, dos quais o melhor Fab foi selecionado para determinar as melhores condições de expressão.
Paralelamente, múltiplas condições de cristalização foram testadas para a proteína hDLL1-DE3 purificada, mas até à data nenhuma gerou um resultado positivo.
Palavras-chave: Sinalização Notch, Cancro da mama, Expressão de proteína, Phage Display,
IX
Abstract
Notch is a conserved signalling pathway, which plays a crucial role in a multiple cellular processes such as stem cell self-renewal, cell division, proliferation and apoptosis. In mammalian, four Notch receptors and five ligands are described, where interaction is achieved through their extracellular domains, leading to a transcription activation of different target genes. Increased expression of Notch ligands has been detected in several types of cancer, including breast cancer suggesting that these proteins represent possible therapeutic targets.
The goal of this work was to generate quality protein targets and, by phage display technology, select function-blocking antibodies specific for Notch ligands. Phage display is a powerful technique that allows the generation of highly specific antibodies to be used for therapeutics, and it has also proved to be a reliable approach in identifying and validating new cancer-related targets. Also, we aimed at solving the tri-dimensional structure of the Notch ligands alone and in complex with selected antibodies.
In this work, the initial phase focused on the optimization of the expression and purification of
a human Delta-like 1 ligand mutant construct (hDLL1-DE3), by refolding from E. coli inclusion bodies.
To confirm the biological activity of the produced recombinant protein cellular functional studies were performed, revealing that treatment with hDLL1-DE3 protein led to a modulation of Notch target genes. In a second stage of this study, Antibody fragments (Fabs) specific for hDLL1-DE3 were generated by phage display, using the produced protein as target, in which one good Fab candidate was selected to determine the best expression conditions. In parallel, multiple crystallization conditions were tested with hDLL1-DE3, but so far none led to positive results.
Keywords: Notch signalling, Breast cancer, Protein expression, Phage Display, Antibody fragments,
XI
Contents
1. Introduction ... 1
1.1 Notch signalling ... 1
1.1.1 Notch discovery- a story about a fly’s wing ... 1
1.1.2 Notch signalling pathway ... 1
1.1.3 Structural features of Notch and its canonical ligands ... 3
1.1.3.1 Structural insights ... 5
1.1.4 Post-translational modifications ... 6
1.1.4.1 Ubiquitination ... 6
1.1.4.2 Glycosylation ... 6
1.1.5 Notch signalling and disease ... 6
1.1.5.1 Notch as an oncogene ... 6
1.1.5.2 Angiogenesis ... 7
1.1.5.3 Cancer stem cells ... 7
1.1.5.4 Breast cancer ... 8
1.1.5.5 Notch inhibition as a treatment for cancer ... 8
1.2 Phage display: antibodies development ... 9
1.2.1 The antibody molecule ... 9
1.2.2 Generation of an antibody library ... 11
1.2.3 Filamentous bacteriophages and phagemid vectors ... 12
1.2.4 Pannings ... 13
1.3 Goals ... 14
2- Materials and methods ... 15
2.1 Molecular Biology ... 15
2.1.1 Notch ligands cloning ... 15
2.1.1.1 pET-47b (+) (E.coli) and pHL-sec (mammalian – HEK293T) ... 15
2.1.1.2 pETfh8 ... 15
2.2 Protein expression in E.coli ... 17
2.2.1 Expression tests ... 17
2.2.2 Expression and purification of hDll1-DE3 –E.coli ... 18
2.2.2.1 Solubilisation with Guanidine-HCl and L-arginine refolding ... 18
2.2.2.2 Solubilisation with urea and refolding ... 18
2.3 Protein expression in mammalian cells HEK293T ... 19
2.3.1 Cell culture ... 19
2.3.2 Expression tests in HEK293T ... 19
2.3.3 Expression and purification of hDLL1-DE3 in HEK293T ... 20
2.3.2.1 First strategy ... 20
2.3.2.2 Second strategy ... 20
2.4 Phage display ... 21
2.4.1 Fab Library –IBET λ immune library ... 21
XII
2.4.3 Glycerol stock ... 22
2.4.4 Input and Output titration ... 22
2.4.5 Phage Amplification ... 22
2.4.6 Phage pools analysis by Fab-on phage ELISA ... 23
2.4.7 Individual clones analysis ... 23
2.4.7.1 Clones rescue (5mL amplification) ... 23
2.4.7.2 Fab-on-Phage ELISA ... 23
2.4.8 Pannings on immunotubes ... 24
2.4.9 Individual clones analysis ... 24
2.4.9.1 Fab-on-phage expression plates and glycerol stocks ... 24
2.4.10 Characterization of the positive clones ... 24
2.4.11 Soluble Fab (sFab) expression in pCOMB3XSS ... 25
2.4.12 sFab Cloning and expression tests in pT7 ... 25
2.4.13 Protein titration ... 25
2.5 SDS-PAGE electrophoresis and Western Blot ... 26
2.6 Protein quantification ... 26
2.7 Thermal shift assay (TSA) ... 27
2.8 Protein Crystallization ... 27
2.9 Functional assay for hDLL1-DE3 ... 28
2.9.1 Cell culture and treatments ... 28
2.9.2 RNA purification, cDNA synthesis and gene expression analysis by real-time quantitative polymerase chain reaction (qRT-PCR) ... 28
3 - Results and Discussion ... 31
3.1 Notch ligands Expression in E.coli ... 31
3.1.1 Expression screening in pET47 (b) + ... 31
3.1.2 Cloning and expression tests with a solubility-inducing fusion protein ... 34
3.2 Expression in mammalian cells (HEK293T) ... 36
3.2.1 Expression tests in pHL-sec ... 36
3.2.2 hDLL1-DE3 expression and purification ... 38
3.2.2.1 First strategy ... 38
3.2.2.2 Second strategy ... 40
3.2.4 Selection of specific Fabs for hLL1-DE3 - Panning ... 43
3.2.5 Assessment of Phage Pools Reactivity ... 45
3.2.6. Assessment of selected individual clones reactivity ... 45
3.3 Protein refolding from inclusion bodies in E.coli– hDLL1-DE3 (pET47(b)+) ... 47
3.3.1 Solubilisation with Guanidine-HCl and L-arginine refolding ... 47
3.3.2 Solubilisation of the Inclusion Bodies with urea... 51
3.3.2.1 Protein thermal stability - Thermal shift assay ... 56
3.3.2.2 -Biologic activity or functional characterization of recombinant protein ... 57
3.3.2.2.1 Cell line evaluation ... 57
3.3.2.2.2 Modulation of Notch1-dependent genes by hDLL1-DE3 ... 58
3.3.2.3 Crystallization experiments to obtain hDLL1-DE3 3D structure ... 61
XIII
3.3.4 Panning for hLL1-DE3 obtained from inclusion bodies ... 63
3.3.5 Assessment of Phage Pools Reactivity ... 64
3.3.6 Assessment of selected individual clones reactivity ... 64
3.3.7 sFab characterization ... 66
3.3.8 sFab expression in pCOMB3xss – clone 20 ... 66
3.3.9 sFab expression in pT7 – clone 20 ... 67
3.3.9.1 Expression tests ... 67
3.4 Conclusions and future perspectives ... 68
4 References ... 71
5 Appendix ...i
5.1 Reagent List ...i
5.2 Strains genotype ... iii
5.3 Buffers and Solutions ... iv
5.3.1 hDLL1-DE3 purification from E.coli (inclusion bodies) ... iv
5.3.1.1 Solubilisation with Guanidine-HCl and refolding with L-arginine ... iv
5.3.1.2 Solubilisation with urea and refolding ... iv
5.3.2 hDLL1-DE3 purification from HEK293T ...v
5.3.2.1 First srategy ...v
5.3.2.2 Second strategy ...v
5.4 Mass spectrometry report (provided by Mass Spectometry Unit (UniMS), ITQB/Ibet, Oeiras, Portugal ... vi
XV
List of Figures
Figure 1.1 - Notch signalling pathway. ... 2
Figure 1.2 - Illustration of Notch receptors and ligands domains ... 4
Figure 1.3 - Structures obtained for Notch receptor and Notch ligands. ... 5
Figure 1.4 - Antibody structure. ... 10
Figure 1.5 - The V(D)J recombination. ... 11
Figure 1.6 - Representation of antibody structure and fragments.. ... 11
Figure 1.7 - M13 use in phage display. essential for phage replication. ... 12
Figure 1.8 - Phage display cycle for selection of Ab fragments. ... 13
Figure 3.1 - SDS-PAGE of expression tests in hJag1-ME3. ... 31
Figure 3.2 - SDS-PAGE of expression tests in hDLL1-DE3. ... 34
Figure 3.3 - Anti-His Western blot results for hDLL1-DE3 soluble fractions. ... 34
Figure 3.4 - Illustration of the constructs cloned in pETfh8. ... 35
Figure 3.5 - Anti-His Western Blot of expression tests in pETfh8 with hDLL1_DSL.. ... 35
Figure 3.6 - Anti-His Western Blot of expression tests in pETfh8 with hDLL1_EGF3.. ... 35
Figure 3.7 - Anti-His Western Blot of expression tests for hDLL1-DE6 and hDLL1-DE3 in 6-well plates.. ... 36
Figure 3.8 - pAAVPURO control for expression tests in hDLL1-DE3. ... 38
Figure 3.9 - Chromatogram of elution of hDLL1-DE3 from the HisTtrap column –first strategy.. ... 38
Figure 3.10 - SDS-PAGE of hDLL1-DE3 elution from the Histrap column – first strategy.. ... 39
Figure 3.11 - SEC chromatogram for hDLL1-DE3 – first strategy... 39
Figure 3.12 - SDS-PAGE of elution of hDLL1-DE3 from SEC – first strategy. ... 40
Figure 3.13 - SDS-PAGE hDLL1-DE3 final pool – first strategy. ... 40
Figure 3.14 - Chromatogram of elution of hDLL1-DE3 from the Histrap column – second strategy. ... 41
Figure 3.15 - SDS-PAGE of elution of hDLL1-DE3 from the Histrap column – second strategy. ... 41
Figure 3.16 - SEC chromatogram for hDLL1-DE3 – second strategy. ... 42
Figure 3.17 - SDS-PAGE of hDLL1-DE3 elution from SEC – second strategy.. ... 42
Figure 3.18 - SDS-PAGE hDLL1-DE3 final pools – second strategy. ... 42
Figure 3.19 - Titration of hDLL1-DE3.. ... 43
Figure 3.20 - Titration of phages selected for hDLL1-DE3. ... 45
Figure 3.21 - Fab-on-phage ELISA of individual clones selected against hDLL1-DE3. ... 46
Figure 3.22 - Fab-on-phage ELISA of individual clones - Comparison of Anti-Fab with hDLL1-DE3. .. 46
Figure 3.23 - SDS-PAGE: washing and solubilisation of inclusion bodies. ... 48
Figure 3.24 - Chromatogram of Desalting – purification of hDLL1-DE3.. ... 48
Figure 3.25 - SDS-PAGE after desalting of hDLL1-DE3. ... 49
Figure 3.26 - Analytical SEC of hDLL1-DE3. ... 49
Figure 3.27 - TSA for hDLL1-DE3. 20µg of protein were used. A.U – Arbitrary Units. ... 50
XVI
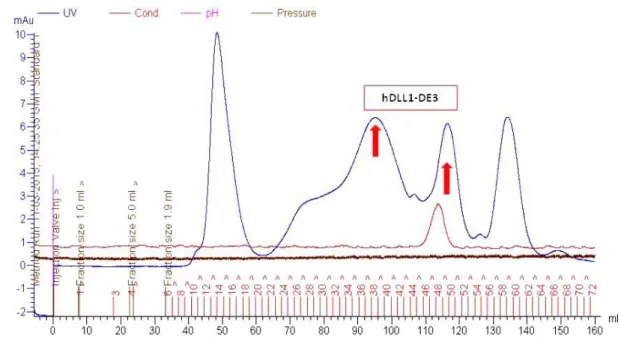
Figure 3.29 - Chromatogram of AIC – elution step. ... 52
Figure 3.30 - SDS-PAGE of AIC.M – Marker; Inj – Inject; FT – Flow-through; F- Fractions. ... 52
Figure 3.31 - Chromatogram of Histrap 1st injection – elution step. ... 53
Figure 3.32 - SDS-PAGE Histrap – 1st injection. A.. ... 54
Figure 3.33 - Chromatogram of Histrap 2nd injection – elution step.. ... 54
Figure 3.34 - SDS-PAGE of Histrap – 2nd Injection. ... 55
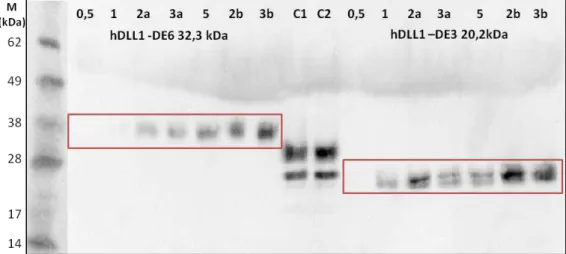
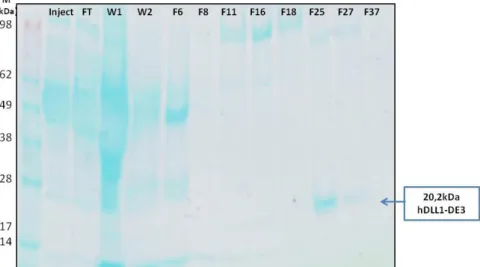
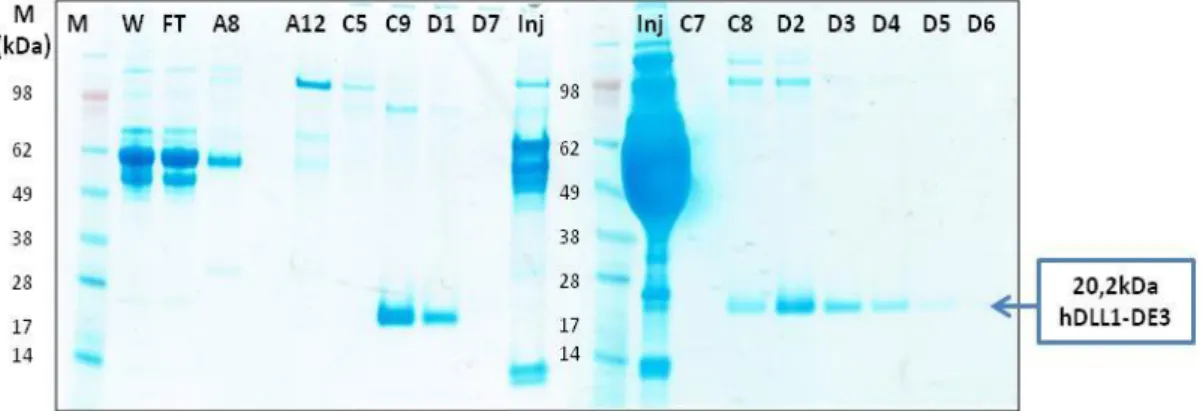
Figure 3.35 - SDS-PAGE of hDLL1-DE3 purified from inclusion bodies. ... 55
Figure 3.36 - Analytical SEC hDLL1-DE3 pool 5. Blue line – UV; Pink line – Inject. ... 56
Figure 3.37 - TSA for hDLL1-DE3 – pool 5... ... 56
Figure 3.38 - mRNA levels of hNotch1 and hDLL1 in different cell lines.. ... 57
Figure 3.39 - mRNA levels of hNotch1 and hDLL1 in iPSCs in response to hDLL1-DE3. The values were normalized against the HPRT1 (control gene) mRNA levels in the same sample. ... 58
Figure 3.40 - mRNA levels of Hes-1 in HCC1954 in response to hDLL1-DE3 treatment. ... 59
Figure 3.41 - mRNA levels of Hey-1 in HCC1954 in response to hDLL1-DE3 treatment. ... 59
Figure 3.42 - mRNA levels of hNotch1 in HCC1954 in response to hDLL1-DE3 treatment.. ... 60
Figure 3.43 - Titration of hDLL1-DE3 – results from 2.5 to 20µg/ml of target. ... 63
Figure 3.44 - Titration of pools from round 2 and 3 - hDLL1-DE3. ... 64
Figure 3 45 - Titration of pools from round 2 and 3 -Anti-Fab. ... 64
Figure 3.46 - Individual clones selected with hDLL1-DE3 – round 2. ... 65
Figure 3.47 - Individual clones selected with hDLL1-DE3 – round 3. ... 65
Figure 3.48 - Anti-Fab Western blot of soluble Fab expression in Shuffle – clone 20.. ... 68
Figure 5.1 - SDS-PAGE of expression tests in hDLL1-ME6. ... vii
Figure 5.2 - Anti-His Western Blot of expression tests for hDLL1-DE6 and hDLL1-DE3 in T25cm2. .... vii
Figure 5.3 - Anti-His Western Blot of hDLL1-DE3 large scale production in HEK293T. ... viii
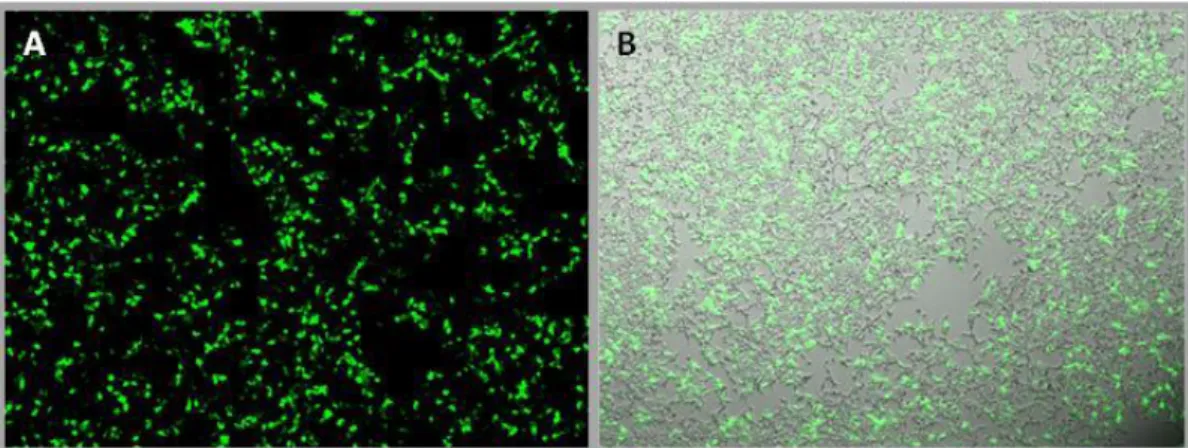
Figure 5.4 - Transfection efficiency evaluation after 48 hours post-transfection in T225cm2. ... viii
XVII
List of Tables
Table 2.1 - Primers used to amplify Notch ligands. R.E. – Restriction enzymes. ... 16
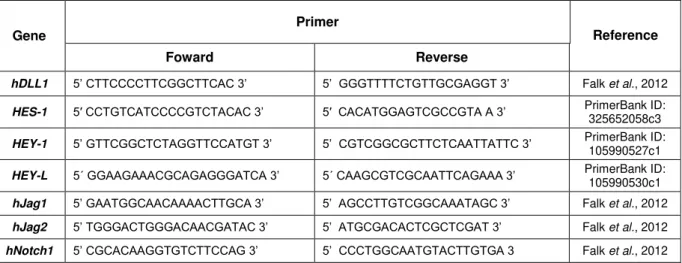
Table 2.2 - Primers used in qRT-PCR reactions ... 29
Table 3.1 - Conditions tested for expression of Notch ligands cloned in pET47 (b) + ... 32
Table 3.2 - Conditions tested for expression of Notch ligands cloned in pHL-sec ... 37
Table 3.3 - Summary of hDLL1-DE3 panning. ... 44
Table 3.4 - Conditions tested for expression of sFab (clone 20)... 67
Table 3 5 - Summary of Notch ligands expression strategies ... 69
Table 3.6 - Summary of hDLL1 – DE3 purification strategies ... 69
XIX
Abbreviations
Ab Antibody
ADAM A Disintegrin and A
Metalloprotease
AIC Anionic Exchange
Chromatography
ANK Ankyrin
Bp Basepair
BSA Bovine Serum Albumin
BME Beta- mercaptoethanol
C Constant
CBF-1 C-promoter binding factor 1
CD Circular Dichroism
cDNA Complementary DNA
CDR Complmentary Determining
Region
CH Constant Heavy chain
CL Constant Llight chain
CSC Cancer stem cell
CV Column Volume
DLL Delta-like
DMEM Dulbecco’smodified Eagles’s
medium
DMSO Dimethyl sulfoxide
DNA Deoxyribonucleic Acid
dNTPs Deoxynucleotides tri-phosphate
DOS Delta and OSM-11 Motif
DPBS Dulbecco’s Phospahte Buffer
Saline
DSL Delta/Serrate/LAG-2
DTT Dithiothreitol
E.coli Escherichia coli
EDTA Ethylenediamine tetraacetic
acid
EGF Epidermal Growth Factor-like
Repeat
ELISA Enzyme-Linked Immunosorbent Assay
EMT Epidermal-to- mesenchymal
transition
ER Endoplasmic reticulum
Fab “ antigen binding Fragment”
FBS Fetal Bovine Serum
Fc “crystallisable Fragment”
Fh8 Fasciola hepatica antigen
8kDa
FR Framework regions
g3p Gene 3 protein
g8p Gene 8 protein
GFP Green fluorescence protein
GSH Reduced Glutathione
GSI Gamma-secretase inhibitors
GSSG Oxidised Glutathione
HD Heterodimerization Domain
HEK Human Embryonic Kidney
HES hairy/enhancer of split
HIF-1α Hypoxia Inducible Factor-1 alpha
HRP Horseradish peroxidase
ICD Intracellular Domains
Ig Immunoglobulin
IPTG Isopropyl β-D-1-thiogalactopyranoside
Jag Jagged
kDa Kilo Daltons
LC Light Chain
LNR Lin12-Notch Repeats
mAb Monoclonal antibody
MAPK Mitogen activated protein kinase
Mib Mind bomb
MNNL Module N-Terminal of Notch
MOI multiplicity of infection
mRNA Messenger RNA
Neur Neuralized
NICD Notch Intracellular Domain
NLS Nuclear Localization Signal
NRR Negative Regulatory Region
NT N-terminal
o/n overnight
OD Optical Density
OD600nm Optical density at 600nm
PAGE Polyacrylamide Gel electrophoresis
PB Power Broth
PBS Phosphate Buffer Saline
PBST PBS-Tween 0.05%
PCR Polymerase Chain Reaction
PDB Protein Data Bank
PEG Polyethylene Glycol
PEI Polyethylenimine
PEST Proline, Glutamate, Serine and
Threonine rich Sequence
pI Isoelectric Point
RAM Rbp-associated Molecule
RNA Ribonucleic acid
rpm Rotation per minute
scFv Single-chain variable fragments
SDS Sodium Dodecyl Sulphate
SEC Size Exclusion Chromatography
ssDNA Single-stranded DNA
Su(H) Supressor of hairless
TAD Transactivation domain
T-ALL T-Cell Acute Lymphoblastic Leukemia
TEA trimethylamine
TGF-β Transforming Growth Factor beta
Tm Melting Temperature
TMAO Trimethylamine N-oxide
TMB 3,3′,5,5′-Tetramethylbenzidine
TMB Transmembrane domain
TSA Thermal Shift Assay
V Variable
VEGF Vascular Ensothelial Growth
WT Wild type
XX
1
1. Introduction
Over the past 30 years Notch signalling knowledge has grown in an exponential way. This pathway, discovered almost a century ago, is known for its crucial influence in metazoan development and effect on many cellular processes like differentiation, proliferation and apoptosis. Given the impact of the Notch in cell-fate it is normal to think that any mutation within this pathway will cause great disturbance. In fact, there are several diseases related with an abnormal function of Notch signalling.
1.1 Notch signalling
1.1.1 Notch discovery-
a story about a fly’s wing
In 1914, investigators of Thomas Morgan´s group described a mutation in Drosophila that
originated several serrations on the fly’s wing and they named the mutant Notch (Dexter et al., 1914).
This study contributed to the development of the genetic field and provided a link between development biology and genetics. Many years later, in the first Notch review Morgan Ted Wright
emphasized its important role: “If one was asked to choose the single most important genetic variation
concerned with the expression of the genome during embryogenesis in Drosophila melanogaster, the
answer would have to be the Notch locus” (Wright, 1970). Studies concerning the Notch pathway have
been growing over the years and nowadays there are many groups working to increase the knowledge in this interesting and vast field.
1.1.2 Notch signalling pathway
Notch pathway is crucial during embryonic development and it is also involved in stem-cell
maintenance and regulation of homeostasis in adult’s tissues (Artavanis-Tsakonas et al.,1999;
Gridley, 1997, 2003). This canonical pathway has two main groups of players: Notch receptors and Notch ligands. The first are cell-surface proteins capable of transducing short-range signals when interacting with ligands present on neighbouring cells. There are four receptors in mammalian, namely
Notch 1-4. On the other hand, five ligands are described for mammalian – Delta-like 1, 3 and 4
(DLL1-4), Jagged 1 and 2 (Jag1 and Jag2), all part of the DSL (Delta, Serrate, LAG-2) family (Kopan and Illagan, 2009).
Canonical signalling requires a direct communication between the Notch receptor and its ligand, and since the two are present in adjacent cells, physical cell contact is required to trigger signal transduction. So, in order to have a productive signalling the presence of two distinct cell-types is
necessary, some expressing the Notch receptors – signal receiving cells, and others expressing DSL
2
interactions between the receptor and the ligand suggest that both may be related (Sprinzak et al.,
2010).
After its synthesis in the endoplasmic reticulum (ER), the Notch receptor is cleaved by protein convertases (Furin-processing) in site 1 (S1), originating a heterodimeric protein that is linked by
non-covalent interactions (Logeat et al., 1998). In the Golgi, the receptor can be glycosylated, by glycosyl–
transferases (e.g. Fringe), and it is the glycosylation pattern acquired that will be responsible for determination of the subsequent response to different ligands (Kopan, 2012). The heterodimeric protein generated by Furin-processing interacts with DSL ligands and induces a conformational change in the Notch extracellular domain. This allows the proteolytic cleavage of the whole domain by
protease ADAM10 (A Disintegrin and A Metalloprotease) at site 2 (S2) (Brou et al., 2000). Then,
gamma-secretase (γ-secretase) cleaves Notch in its transmembrane domain (S3), leading to the
release of the Notch intracellular domain (NCID) and its migration to the nucleus where it will activate
the transcription of several target genes (e.g. genes from hairy/enhancer of split (HES) family)(Iso and
Hamamori, 2003; Lubman et al., 2004; Borggrefe and Oswald., 2009). For that purpose, NCID
promotes the release of the repressor (Co-R) and forms transcriptional complexes with Deoxyribonucleic Acid (DNA)-binding factor CSL (C-promoter binding factor 1 (CBF-1), suppressor of hairless (Su(H)), lin-12 and glp-1 (Lag-1)) and the coactivator Mastermind, therefore allowing gene transcription, which is dependent on the cellular context (Cave, 2011; Petcherski and Kimble, 2000; Wu et al., 2000) (Figure 1.1).
3
NCID contains a Proline, Glutamate, Serine and Threonine rich Sequence (PEST) that marks
the polypeptide to rapid degradation (Fryer et al., 2004). For that reason, canonical Notch pathway
activation does not result in large signal amplification because cleavage, dissociation and destruction of the receptor occurs during transduction. Thus, unlike other systems, in Notch signalling there is a
linear response between the receptor activation and transcript activation (Wang et al., 2011a).Recent
studies emphasize the role of the signal-sending cell (expressing the DSL ligands), suggesting that processing of ligands and endocytosis (into the signal-sending cell) of the receptor/ligand complex are
required for signalling activation (Ahimou et al., 2004; Klueg and Muskavitch, 1999; Nichols et al.,
2007).
1.1.3 Structural features of Notch and its canonical ligands
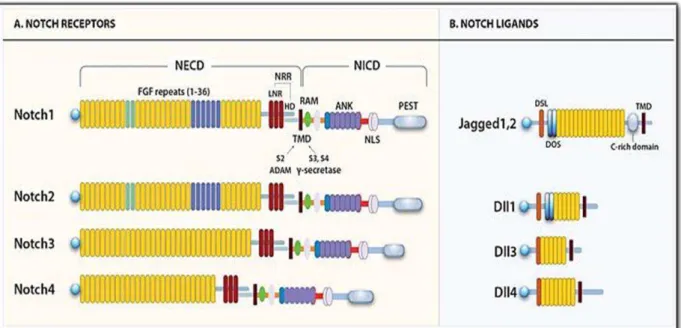
Mammals have four Notch receptors (Notch 1-4) that are large single-pass type I transmembrane proteins (Figure 1.2). All Notch proteins present an extracellular domain with 29-36 tandem epidermal growth factor like repeats (EGFs) that can be calcium binding domains thus
influencing signalling productivity (Raya et al., 2004). Moreover, these repeats have been described
as being very important for structure and affinity determination of Notch in ligand binding (Cordle et al.,
2008b). The EGFs are followed by a negative regulatory region (NRR) composed by three cysteine-rich Lin12-Notch repeats (LNR) and a heterodimerization domain (HD). The NRR region plays a crucial role in inhibiting Notch activation in the absence of ligands. Next to the NRR region is the
transmembrane domain (TMB) followed by the NICD
.
The last contains a Rbp-associated Molecule(RAM) domain that is linked to seven intercellular ankyrin (ANK) repeats by a long and unstructured linker containing a nuclear localization sequence (NLS). Right after the ANK domain is an extra nuclear localization sequence (NLS) and a transactivation domain (TAD). In the C-terminal, a PEST sequence is present and it is responsible for regulation of NCID stability (Figure 1.2) (Kopan and Illagan, 2009).
Notch ligands or DSL ligands are characterized by the presence of a domain called DSL (Delta, Serrate, and Lag2). Like mentioned above, there are five DSL ligands in mammalian classified
based on Delta and Serrate of Drosophila. Therefore, for mammalian the ligands are nominated as
Delta-like (DLL1, DLL3 and DLL4) and Serrate (Jagged) – like (Jag1 and Jag2) (Kopan and Illagan,
2009), and they are all type I transmembrane proteins (Figure 1.2). Although the intracellular domains
(ICD) of the Notch ligands present a very low sequence homology (Pintar et al., 2007), all ligands
share a common organization of their extracellular domains that includes an N-terminal (NT) domain followed by the DSL domain and tandem EGFs. These last domains (EGFs) can, in certain situations,
be considered calcium binding domains (Figure 1.2) (D’Souza et al., 2010). Several studies reported
that mutations in some residues of the DSL domain lead to a loss in Notch signalling, proving that this
domain is essential for ligand-receptor binding (Henderson et al., 1994, 1997; Tax et al., 1994).
However, in 1999 Shimizu and his collaborators proved that the DSL domain is required, but not sufficient, for ligand interactions with the receptor. There is also a special motif that plays a key role in Notch binding, that is present in the first two EGFs and is named DOS (Delta and OSM- 11- like
4
important for function – NT domain. This domain is subdivided into two regions, N1 and N2, being N2
involved in ligand membrane association and endocytosis (Hamel et al., 2010).
Experiments designed for the assessment of Notch-ligand interactions with Notch receptors and Jag1 have assigned the minimal binding regions necessary to activate signalization. Initially it was
proved that EGFs 11 and 12 of the receptor are necessary and sufficient to bind the ligand (Rebay et
al., 1991). However, other studies revealed that EGFs 25-26 probably interact with EGFs 11-13
keeping Notch in its basal state in an inactive form (Sharma et al., 2013). Regarding the DSL ligands
minimal binding region it was shown that DSL to EGF2 regions of Jagged1 are critical for binding to
Notch2, in a saturated and Ca2+ dependent-manner, using two different techniques: a solid-phase
binding assay, and a cell based binding assay, using both receptor and ligand mutated forms (Shimizu
et al., 1999).
Figure 1.2 - A. Human Notch receptor’s domains
Figure 1.2 -- A. Human Notch receptor’s domains
Figure 1.2- Illustration of Notch receptors and ligands domains. A. Notch receptors’ domains. All receptors
share the same domains that are included in NECD (Notch extracellular domain) and NICD (Notch intracellular domain).The EGF-like repeats vary from 29 to 36 and regarding the following domains, the receptors share the same structure NRR (negative regulatory region) that includes three LNRs (cysteine-rich LNR repeats – in red) and an HD (heterodimerization domain); TMD (transmembrane domain) followed by the NCID that is composed by an RAM domain, an ANK : (ankyrin repeat domain - in purple), a NLS (nuclear localizing sequences) and finally a PEST domain (region rich in proline (P), glutamine (E), serine (S) and threonine (T) residues). B. Notchligands‘
5
1.1.3.1 Structural insights
In 2004, the first structure of a Notch1 receptor fragment was solved by NMR (Hambleton et
al., 2004) and four years later a crystal structure of the same region (EGF11-13) was determined
(Cordle et al., 2008a). Regarding the Notch ligands, Jag1 structure was the first one to be solved by
Cordle and his collaborators, and the x-ray structure published comprised only the minimal binding region. The authors showed that this fragment with four domains adopts a rod-shaped conformation,
like the one previously reported for the receptor Notch1 (Cordle et al., 2008a). Recently, a second
structure of the same ligand was solved with the receptor-binding region together with the Module
N-terminal domain (MMNL) (Chillakuri et al., 2013).This year, Kershaw and co-authors solved the DLL1
N-terminal section containing DSL and EGF1-6 domains, which can now be analysed in close
comparison to Jag1 (Kershaw et al., 2015).
In Figure 1.3 it is possible to visualize the similarities between the structures, which are characterized by poor secondary structure content and an extended conformation (except for EGF5-6
of Dll1). These proteins are composed mostly by β-sheets and loops and present a conserved disulphide-bond pattern. In the Notch receptor structure it is possible to observe multiple binding sites
for Ca2+ ionin the minimal binding region (EGF11-13)and, similarly Jag1 structure presents a Ca2+
that binds to the N-terminal region. The N-terminal is a C2 phospholipid recognition domain that binds phospholipid bilayers in a calcium-dependent manor and mutations in this region can lead to a
reduction in Notch activity (Chillakuri et al., 2013). Also, the comparison between DLL1 and Jag1
structures reveals that the C2 domains are different, suggesting probable different lipid binding
properties.
Figure 1.3 - Structures obtained for Notch receptor and Notch ligands. (images obtained using PyMol tool
where the blue domains represent the N-terminus and the red domains represent the C-terminus). A. Notch
EGF11-13 structure published by Cordle et al (PDB 2VJ3); B. Jagged 1 EGF1-3 structure, containing a
N-terminal C2 domain published by Chillakuri et al (PDB 4CC0); C. Delta-like EGF1-6 structure, also containing
6
1.1.4 Post-translational modifications
1.1.4.1 Ubiquitination
Notch ligands levels at cell surface are regulated by ubiquitination which is also crucial for signalling activity. Two E3 ligases - Neuralized (Neur) and Mind bomb (Mib), interact with ICDs of Notch ligands and influence Notch signalling by ubiquitination of these ligands in the lysine residues,
leading to consequent endocytosis and degradation.Studies performed in Drosophila support the idea
that Neur-induced endocytosis functions to stimulate ligand signalling activity (Deblandre et al., 2001;
Lai et al., 2001; Pavlopoulos et al., 2001; Yeh et al., 2001). However, studies in mice did not show
the same results, suggesting that the mammalian homolog of Neur is probably not essential for Notch signalling, and other reports proved that other E3 ligases play this role in mammalian. For example, it was proved that Mib ubiquitinates DLL1 and enhances its endocytosis. Nevertheless, this ligase is not
capable of reversing the cis-inhibitory effects of the DLL1 ligand in receiving-cells (Koo et al., 2005).
Interestingly, Song and his collaborators found that in mammalian cells, Mib is the E3 ligase that triggers the ligand endocytosis and activates the signalling pathway. On the other hand, Neur is a downstream ligase of Mib that promotes directly the lysosomal degradation of ligands and regulates
their levels (Song et al., 2006).
1.1.4.2 Glycosylation
O and N-glycosylation occurs in conserved sequences of Notch receptors and ligands, in specific EGF- like repeats. Until now, only O-fucose and O-glucose modifications were related with effects on Notch signalling, while N-glycan additions do not appear to have an impact in normal
function of this pathway (Panin et al., 2002). Also, glycosylation of the ligands does not appear to be
involved in signalling activity.
1.1.5 Notch signalling and disease
Given that the Notch pathway is involved in the development of tissues and organs, it is not surprising that its malfunction is connected to many diseases. It was first associated with T-cell acute lymphoblastic leukaemia (T-ALL) in 1991 and since then it has been linked to a large variety of
pathologies, like Alagille syndrome, a hereditary human disease caused by mutations in one of the
ligands of Notch receptor - Jag1 (Li et al., 1997).
1.1.5.1 Notch as an oncogene
T-ALL is an aggressive type of cancer that generally affects children and teenagers. In 1991, when the first case of T-ALL concerning Notch1 was studied, the authors proposed that the normal Notch gene is involved in normal lymphoid development, but its rearranged form may be related with transformation and progression of some of these neoplasms (Ellisen, 1991). Nowadays, it is known
7
and the growth of T-ALL cell lines that lack chromosomal translocation depend on Notch transducing signals. Moreover, more than a half of T-ALL cases are related to Notch1 mutations involving the
PEST domains (Weng et al., 2004b). Also, this oncogenic function of Notch receptors has been
extended to solid tumours and it was possible to link both receptors and ligands to neoplasms
development or progression (vanEs et al., 2005; Koch and Radtke, 2007; Demehri et al., 2009, Mittal
et al., 2009). Despite the many evidences that link Notch pathway to an oncogenic behaviour, in some
cases the scenario can be totally different. In murine skin models, it was observed that Notch1 had a tumour suppressor effect (Radtke and Raj, 2003). This observation corroborates with the idea that Notch expression and function is dependent on the cellular context and on the interaction with other pathways.
1.1.5.2 Angiogenesis
The process by which new blood vessels are formed from an existing net of vessels is called
angiogenesis. It is complex and it starts with a stimuli, and the primary driver of angiogenesis are cells
under conditions of hypoxia. These cells secrete many proangiogenic factors and the best studied is
the vascular endothelial growth factor (VEGF) (Sharma et al., 2011). Notch is important to maintain
the vascular homeostasis, by repressing the proliferation of endothelial cells. In response to VEGF levels, tip cells (non-proliferative cells) begin to express high levels of DLL4 that activates Notch signalling in adjacent cells (Claxton and Fruttiger, 2004). Stalk endothelial cells that have a highly proliferative capacity, downregulate the VEGF receptors´ expression in response to Notch activation, and consequently, inhibit excess formation of sprouts that allow new vessels to grow. On the other hand, Jag1 does the opposite and stimulates new vessels growth, antagonizing DLL4 action (Benedito
et al., 2009). Since DLL4, Jag1 and Notch1 are involved in vasculature formation and homeostasis it is
normal that aberrant expression of any of these genes plays an important role in tumour progression and survival, which makes these proteins good therapeutic targets. Blockage of Notch signalling using
a DLL4 antibody led to regression in different types of tumours (Noguera-Troise et al., 2006; Ridgway
et al., 2006). However, other studies proved that long-term inhibition of Notch signalling can have bad
consequences to the organism (Wu et al., 2010). So, probably, Notch inhibition has different effects
depending on the type of tumour. Finally, several findings suggest that the Notch pathway may have a role helping the tumour to adapt to the hypoxic environment present in cancer, through interaction with
hypoxia inducible factor-1 alpha (HIF-1α), whose regulation promotes cells adaptation to low oxygen
levels (Gustafson et al., 2005; Saison and Harris, 2006).
1.1.5.3 Cancer stem cells
Cancer stem cells (CSCs) are a sub-population of cells with highly proliferative potential and self-renewal ability. Their division is asymmetric, giving rise to stem cells and differentiated cancer
cells (Li et al., 2014). CSCs have also a great invasive capacity and apparent resistance to many
cancer treatments, and have been associated to metastatic events and relapse of some patients
8
Notch receptors 1 and 4 have been described as more activated in CSCs of breast cancer
(Weng et al., 2004a). Other studies proved that Jag1 is an inducer of stem cells phenotype and the
main ligand in Notch signalling activation of CSCs, in different types of cancer, including breast cancer (Li et al., 2014).
1.1.5.4 Breast cancer
In our days, breast cancer represents the most common cause of death from cancer in women all over the world. Because it has a lifetime risk of one in nine and its incidence continues to increase, many efforts in the science field have been taken trying to find out what triggers this type of cancer, in order to develop efficient treatments. Recently, several groups have linked abnormal expression of Notch signalling receptor and ligands to breast cancer. Mittal and his team showed that a crosstalk between Notch and Ras/mitogen activated protein kinase (MAPK) signalling pathways apparently
leads to a poor prognostic of the patients (Mittal et al., 2009). Moreover, Notch has been related to the
invasive behaviour of cancer cells. Breast cancer metastases in the bones are the most common
ones, leading to severe fractures and pain, among other complications (Mundy et al., 2002). The
linkage of Jag1 and transforming growth factor beta (TGF-β) pathways is able to create a positive
feedback loop between tumour and bone cells promoting osteolytic bone metastasis (Sethi et al.,
2011). Another important feature of metastatic behaviour is the Epidermal - to - mesenchymal transition (EMT), phenomena that occurs during development, but can be reactivated by cancer cells. EMT is described as being important for tumour metastasis and progression, in which Notch may play
a critical role. It can modulate down regulation of E-cadherin by TGFβ and, consequently interfere with
normal cell-cell adhesion (Timmerman et al., 2004; Zavadil et al., 2004).
1.1.5.5 Notch inhibition as a treatment for cancer
Normally, it is easier to develop inhibitors against enzymes. As mentioned before, in the canonical Notch pathway, there are two proteolytic steps where enzymatic reaction occurs, first with
alpha-secretase complex and second with γ-secretase complex. So, investigators have designed
small molecules in order to inhibit Notch signalling, and gamma-secretase inhibitors (GSIs) were the first to be used in research and clinic. However, these molecules are not very specific since gamma-secretase interacts with other targets like E-cadherin, nectin-1 alpha or even APP (amyloid precursor protein). On the other hand, if we think that these targets are also described as candidates for cancer
therapy, maybe the use of GSIs can, in fact, be very helpful (Purow et al., 2012). However, the lack of
specificity of GSIs and consequent inhibition of other pathways, as well as their ability of blocking both
Notch1 and Notch2, has been associated with intestinal toxicity (vanEs et al., 2005). To better
understand the role of both receptors and create less toxic inhibitors, Wu and his team have developed antibodies against Notch1 and Notch2 receptors using the phage display technology. Co-crystallization of these highly specific antibodies with both receptors, revealed the therapeutic potential
9
1.2 Phage display: antibodies development
In 1985, Smith presented for the first time the phage display technology (Smith et al., 1985).
This technique uses genetic engineering of filamentous bacteriophages to display peptides and proteins (e.g. antibody fragments) at their surface. The DNA of interest is cloned into a specific region
of the bacteriophage’s genome resulting in the “display” of proteins or peptides at the surface, in fusion with one of the phage coat proteins (Azzazy and Highsmith, 2002). By carrying out several
rounds of selection against a target it is possible to develop in vitro a specific antibody fragment that
can after be reformatted into a complete monoclonal antibody (mAb) and further used in diagnosis,
research and/or therapeutics (Barbas et al., 2004; Lee et al., 2007).
1.2.1 The antibody molecule
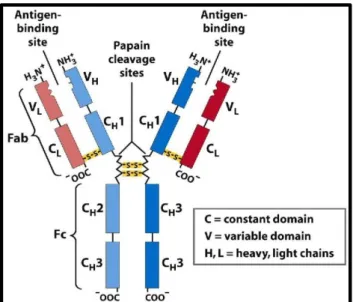
Antibodies (Abs) play a crucial role in immune response by targeting antigens for destruction
by other cells. They are “Y-shaped” glycoproteins part of immunoglobulins (Ig) family and are divided
into five classes: IgG (γ), IgM (µ), IgA (α), IgD(δ) and IgE(ε), being IgG the most abundant antibody in
the serum. These five classes share the same structure with two heavy chains (HC) with at least 50 kilo Daltons (kDa) each and two light chains (LC) with 25 kDa each. The LCs can be subdivided into
two forms, known as kappa (κ) and lambda (λ), and these are linked to each HC by a disulfide bond.
HCs are linked between them by several disulfide bonds. The HC and LC connection generates the
Ab molecule, which is joined by a flexible polypeptide chain – the hinge region (Murphy, 2011; Delves
et al., 2006).
The Ab class or isotype is defined according to the constant region carboxy-(C) terminal of HC, which determines the biological function of the Ab. On the other hand, the variability of the Ab is present in the region composed by the first 100 amino acids, in the amino-(N)-terminal regions of both LC and HC, and this constitutes the variable (V) region of an Ab molecule. Inside, there are hypervariable regions, often referred as complementary determining regions (CDRs), divided into three segments - CDR1, CDR2 and CDR3, and these are the regions responsible for Ab specificity. The remaining portions of the V region are called the framework regions (FR) and are less variable than the CDRs. As for the constant (C) region it is referred as CL for light chain and CH for heavy chain. It presents a similar sequence between Abs of the same class, and the HCs can contain three
or four domains namely CH1, CH2, CH3 and CH4 (Murphy, 2011; Delves et al., 2006; Elgert, 2009).
The Ab molecule is composed by two distinct fragments. The first results from the
non-covalent interaction of VL with VH, and CL with CH1, originating the “antigen binding Fragment” (Fab),
which contains the antigen binding activity. The other is the “crystallisable Fragment” (Fc), and is
composed by the remaining CH regions (CH2 and CH3). This portion is responsible for the interaction
10
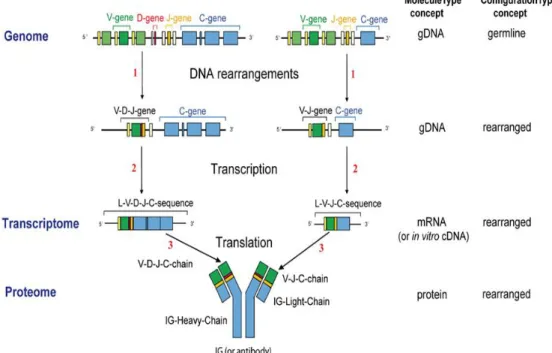
From the genetic point of view, each HC is encoded by four gene segments: VH, DH, JH and
CH, while the LC is encoded by VL, JL and CL segments. The combination of the VH-DH-JH with the VL-JL
regionscreates the paratope which is the antigen-binding region and recognizes a single site of the
antigen – the epitope (Azzazy and Highsmith, 2002). Diversity is achieved through a highly regulated
and ordered process called V(D)J recombination that occurs during B cells development.
Rearrangement of the DH-to-JH segments of the HC is the first step in V the (D)J recombination
process. Next, the VH-to-DHJH rearrangement occurs on precursor B cells giving rise to the VDJH HC
genes that bind to the CH gene. Finally, the VL-to-JL rearrangement takes place, by binding to the CL
gene, and the LC genes are produced. (Figure1.5) (Schatz, 1992).
Figure 1.4 - Antibody structure. The antibody is divided into two chains (heavy and light chain) which have two
11
Figure 1.6 - Representation of antibody structure and fragments. Figure fromJoosten et al., 2003.
1.2.2 Generation of an antibody library
The first step of phage display is the generation of an antibody library. Different libraries
include libraries for Ig isotypes (e.g., IgG, IgA, and IgE) or libraries of mAbs – Fab fragments or
single-chain variable fragments (scFv) (Figure 1.6) (Hammers and Stanley 2013).
Library preparation begins with the collection of messenger Ribonucleic acid (mRNA) from a cell source, like peripheral blood mononuclear cells. After isolation, the mRNA is converted into complementary DNA (cDNA) and the VH and VC genes are amplified by Polymerase Chain Reaction (PCR). The DNA amplification is achieved using sets of primers that are specific for all the conserved
Figure 1.5 - The V(D)J recombination. The process begins with the rearrangement of the VDJ fragments of the
12
V-genes of the IgG repertoire of a given individual (Hammers and Stanley 2013). Libraries can be
divided into “single pot” and immune, depending if the donor was previously immunized with the
antigen or not. “Single-pot”¨ libraries include naïve, semi-synthetic and synthetic libraries, and are
designed to produce Ab against a large number of antigens (Hoogenboom, 2005; Shirrmann et al.,
2011). Immune libraries are constructed using IgG mRNA of B cells from an immunized donor. These libraries are enriched in Abs specific for the chosen antigen, allowing the selection of high-specific
antibodies with small libraries (Bazan et al., 2012; Hoogenboom et al., 1998). However, the use of
immune libraries can be a very laborious process when the goal is to produce specific Abs against distinct targets, since it is necessary to create a new library for every antigen, although more comprehensive sources are often used i.e. donors in specific conditions with high expression of diverse targets (e.g. cancer patients) (Watkins and Ouwehand, 2000).
1.2.3 Filamentous bacteriophages and phagemid vectors
Bacteriophages are viruses that can infect Gram-negative bacteria through interaction of Fl filamentous phage particles with the bacterial F Pili receptor. These phages express around 2700
copies of gene 8 protein (g8p or pVIII), often called “the major capsid protein”, and 3 to 5 copies of the
gene III (g3)-encoded adsorption protein (g3p or pIII). Ab fragments produced by phage display are normally fused to g3p and, consequently displayed at the surface of the phage (Figure 1.7) (Azzazy
and Highsmith, 2002; Dente et al., 1994).
Cloning of the Ab fragments fused with g3p protein is often achieved using phagemids that
contain both M13 phage and Escherichia coli (E.coli) origins of replication, the g3p gene (gene III),
13
VCSM13 contain and supply all the remaining genes necessary to generate the phage particles
(Figure 1.7), and once they are built inside the bacteria (e.g. E.coli TG1) they are secreted (Azzazy
and Highsmith, 2002).
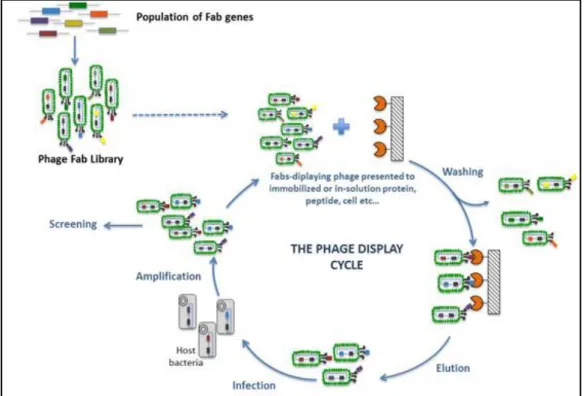
1.2.4 Pannings
Following the library construction, it is necessary to screen against the chosen target. This technique is called panning and is characterized by several rounds of phage binding to the target (antigen), washing to eliminate the non-binders, elution to recover the binders and re-amplification of
the eluted phages in E.coli (the TG1 bacterial strain is normally used in this step) (Figure 1.8). In each
round, the phage pool from the previous round is used for selection. Normally, a depletion step using a non-target is performed before the selection step to retain the non-specific binders. After three or four rounds of selection the phage population is enriched with highly specific clones that can be detected
by phage Enzyme-Linked Immunosorbent Assay (ELISA) (Barbas et al., 2004). This technique allows
the detection of the clones that express Fabs specific for the antigen. It begins with antigen coating, incubation of the phage pool with the coated antigen, and washing of the non-binders. Detection is commonly carried out using an antibody against the major capsid protein (M13) conjugated with an enzyme (e.g. Peroxidase). Eventually, if the antibody used in non-conjugated a second incubation with a different antibody might be required using a secondary conjugated-antibody that binds the first.
Figure 1.8- Phage display cycle for selection of Ab fragments. Figure from FairJourneyBiologics.
14
1.3 Goals
15
2- Materials and methods
2.1 Molecular Biology
All primers were all designed using CloneManager Suite 7 software and synthesized by StabVida. PCR steps were performed in the Thermal cycler - MyCycler (Bio-Rad). For DNA extraction, Miniprep kit from Thermoscientific was used. DNA purifications were made using either ThermoScientific GelPure Kit or NzyTech Gel Pure kit. Quantification of the pure DNAs was performed by spectrophotometry using NanoDrop ND-1000 spectrophotometer (Alfagene). All steps of cloning were monitored by electrophoresis using 1% agarose gels. To transform DNAs in cloning steps,
electrocompetent DH5α (see Section 5.2 for strains genotype) were used and transformed by electroporation (2500 volts shock), using the Eletroporer (Eppendorf).
2.1.1 Notch ligands cloning
2.1.1.1 pET-47b (+) (
E.coli
) and pHL-sec (mammalian
–
HEK293T)
Twelve different constructs of three of the Notch I ligands – DLL1, Jag1 and Jag2, were previously
cloned in pET47b (+) and pHL-sec vectors by Margarida Silva in her MSc (Silva, 2014) as summarized in Table 2.1.
2.1.1.2 pETfh8
In order to increase the expression of the ligands in the soluble fraction in the E.coli strain
used, a different vector was chosen, pETfh8, containing Fasciola hepatica antigen 8kDa (Fh8) tag.
hDLL1_MNNL-DSL and hDLL1_MNNL-EGF3 constructs were cloned in this plasmid.
Amplification of the fragments was achieved using the following PCR mix: hDLL1 cDNA (dilution 1:100), 0.4 mM of deoxynucleotides tri-phosphate (dNTPs), 0.4µM of primers forward and
reverse (see table 2.1), 1x Pfu buffer, 1.25 units of Pfu polymerase and RNase free water to a final
volume of 50µL. The program used began with a denaturing cycle at 95°C during 4 minutes, followed by 35 cycles of a denaturing step (95°C) of 30 seconds, annealing step (54-62°C) for 30 seconds and extension step (72°C) for 2 minutes. Finally 1 additional extension step was carried out for 10 minutes at 72°C. Amplified fragments were purified from the agarose gel and both fragments and plasmid were
digested during 4 hours at 37ºC. hDLL1_MNNL-DSL and pETfh8 were digested with NcoI/XhoI, while
hDLL1_MNNL-EGF3 was digested with PciI/XhoI. NcoIenzyme was not used for the second fragment
because it cuts inside the fragment. So, in alternative, a complementary restriction enzyme, PciI, was
chosen. After heat inactivation of the enzymes at 85ºC and purification of the digested DNA, ligation was carried out using 2.5 units of T4 DNA ligase together with 1x Buffer T4 Ligase and two different proportions vector:insert, namely 1:3 and 3:1. The mixture was incubated overnight (o/n) at 16°C,
transformed in DH5α and plated in LB agar plates with 50µg/mL of kanamycin. On the next day,
16
1mM of dNTPs, 0.4mM of the same primers mentioned before, 1.25 units of Taq DNA Polimerase and
respective buffer (1x), 2 mM of MgCl2, 4% dimethyl sulfoxide (DMSO) and RNase free water to
achieve a final volume of 25µL per reaction. The program was similar to the one used in the amplification step with the following alterations: the first denaturing cycle was at 95°C, and 30 cycles were used with 59ºC for annealing. After analysing the colony PCR results, DNA of the positive hits
was extracted and digested with XhoI/HindIII to recheck if the colonies presented the correct fragment.
DNA of the positive colonies was also sent for sequencing by Stabvida or GATC. Finally, DNA from the chosen colonies was transformed in BL21(DE3)Star/pRARE2 and plated in LB Agar with chloramphenicol at 30µg/mL and kanamycin at 50µg/mL for further protein expression tests.
Table 2.1 - Primers used to amplify Notch ligands. R.E. – Restriction enzymes.The letters in bold represent
the restriction enzymes sites. The underlined letters represent the linker between the ligand and the tag. (F) – forward primer; (R) – reverse primer.
Plasmid Ligand Domain R.E. Primer
pET 4 7 -b (+ ) hJag1
MNNL EcoRI 5'- GAGTATCAGAATTCCGTGACCTGTGATGAC - 3’ (F) DSL EcoRI 5'- GCAGGCAAGCTTAGCCTATTCACAGTTGG - 3’ (F) EGF3 HindIII 5'- GCAGTAAGCTTTCAGTTATGAGCAGTTCTTG - 3’ (R) EGF9 HindIII 5'- GTGCAGAATTCACGTCCGATGGGTTATTTTG - 3’ (R)
hJag2
MNNL EcoRI 5'- CTGCAGAATTCTGTTCGCTGCGATGAAAAC - 3’ (F)
DSL EcoRI 5'- CGTGCAGGCAAGCTTCGCTTATTCACAGTTGC - 3’ (F)
EGF3 HindIII 5'- CACGGTAAGCTTGGCTAGCTACAGTTTTTAC - 3’ (R) EGF9 HindIII 5'- CCTTGAATTCTCAGGTCTGGAGCTC - 3’ (R)
hDLL1
MNNL EcoRI 5'- CTCAAGAATTCCTACCGCTTCGTGTGTG - 3’ (F) DSL EcoRI 5'- CTCGTCAAGCTTCAGCTAGCAGGTGGCACC - 3’ (F) EGF3 HindIII 5'- CGTCAAGCTTGTCCTAACAGTGCCTCCC - 3’ (R)
EGF6 HindIII 5'- CCAAGGTGACCGGTGCCTCGGGTCAGTTCG –3’ (R)
pHL
-sec
hJag1
MNNL AgeI 5'- CCAAGGTGACCGGTGCCTCGGGTCAGTTCG - 3’ (F) DSL AgeI 5'- GCATGATCAACCCCACCGGTCAGTGGC - 3’ (F) EGF3 KpnI 5'- GCAGGCGGTACCAGCAATTTCACAGTTGG - 3’ (R) EGF9 KpnI 5'- GCTGCGGGTACCGTCTTTCAGGTGTGAGC - 3’ (R)
hJag2
MNNL AgeI 5'- GCACTGACCGGTCAGGCACGACGTCCG - 3’ (F)
DSL AgeI 5'- ATGATCACCGGTGAAGACCGCTGGAAATCACTGC - 3’ (F)
EGF3 KpnI 5'- CGGGTTAGAGGTACCGGCATGTTCCGC - 3’ (R)
EGF9 EcoRV 5'- CGACAGGCACCACCCGATATCGGTTCACG - 3’ (R)
hDLL1
17
2.2 Protein expression in
E.coli
2.2.1 Expression tests
In order to achieve an optimal expression in E.coli, several conditions were tested for nine of
the constructs of pET47(b)+. Bacteria strains BL21Star (DE)/pRARE2 or BL21(DE3) were transformed with pET47(b)+ cloned with Notch ligands and also with pGRO7, a plasmid that contains two molecular chaperones GroEL and GroES.
First, a pre-inoculum was prepared with 5mL of Luria-Bertani broth (LB) medium with the appropriated antibiotics, inoculated with a loop of bacteria and incubated overnight at 37ºC and 250 rotations per minute (rpm). On the next day, the cultures were prepared using 20mL medium,
antibiotics and pre-inoculum in a certain volume that the final starting OD600nm was approximately 0.05.
The culture was grown until the chosen OD600 for induction and 0.1 or 0.5mM of Isopropyl β
-D-1-thiogalactopyranoside (IPTG) and L-arabinose (to induce pGro) at 4mg/mL were added. A sample of non-induced culture was taken before induction to be used as a negative control. After induction
(culture with OD600nm = 0.8-1) two samples of the culture corresponding to 1OD (optical density),
together with the non-induced sample, were centrifuged at 13200xg and 4ºC, during 15 minutes.
Pellets from the non-induced sample and of one of the samples taken after induction were resuspended in 1x Loading buffer (see Section 5.3). The remaining pellet was used for cell lysis to separate the soluble fraction from the insoluble one. The pellet was resuspended in BugBuster 10xProtein-Extraction-Reagent (Millipore) supplemented DNase I, incubated during 15 minutes on ice
and centrifuged at 13200xg and 4ºC, during 15 minutes. After centrifugation, the supernatant was
transferred into a new tube and 4x Loading Buffer was added to premake the same final volume of the other samples. Pellet was resuspended in 1x Loading Buffer and all the samples prepared were
stored at – 20ºC. All the results were monitored by Sodium Dodecyl Sulphate Polyacrylamide Gel
electrophoresis (SDS-PAGE) and/or Western Blot analysis using Penta-His as primary antibody (dilution 1:2000) and anti-mouse horseradish peroxidase (HRP)-conjugated as secondary antibody (dilution 1:3000). Expression tests for pETfh8 were performed following the same protocol.
pET
fh8 hDLL1
MNNL NcoI or
PciI
5'- GCTCCATGGCATCCATGGGCTCCCAGGTCTGGAGCTCTGGGTGT- 3’ (F)
5'- GCTACATGTTGTCCATGGGCTC CAGGTCTGGAGCTCTGGGTGT - 3’ (F)
DSL XhoI 5' -TGACTCGAGCAGCAGTAGGGCCCTTTCCAG - 3’ (R)
18
2.2.2 Expression and purification of hDll1-DE3
–
E.coli
The protein was obtained from refolding of inclusion bodies and for that, two different protocols were used. All the steps from expression to purification were monitored by SDS-PAGE and Western blotting, and protein quantification was measured by UV spectrophotometry at A280.
2.2.2.1 Solubilisation with Guanidine-HCl and L-arginine refolding
The first protocol was adapted from previous tests made by Margarida Silva, MSc (Silva, 2014). Buffers composition is described in Appendix 5.3.1.1. First, 2L of culture (BL21 Star(DE)/prare2 transformed with pET47(b)+_hDLL1-DE3) were grown in Power Broth (PB) medium with kanamycin
(50µg/mL) and chloramphenicol (30µg/mL) and when the OD600nm was 0.9 the culture was induced
using 0.5mM IPTG and incubated o/n at 20°C. The bacterial pellet was obtained by centrifuging the
culture at 7500xg, at 4ºC for 30 minutes and stored at -80ºC. Cell lysis was performed resuspending
the pellet in Lysis Buffer A and sonicating the cells for 3-4 minutes (10 seconds on; 10 seconds off)
with an amplitude of 35%. Then the culture was centrifuged at 10 000xg, at 4ºC during 30 minutes.
Inclusion bodies were then washed with two washing solutions – Wash IA and Wash IIA. The pellet
obtained was resuspended in Wash IA on ice and centrifuged 15 minutes at 30 000xg and 4ºC. This
procedure was repeated four times and finally the pellet was resuspended in 15mL of Wash IIA on ice
and centrifuged during 15 minutes at 30 000xg and 4ºC. The supernatant was discarded and the
pellet, containing the pure inclusion bodies, was resuspended in 10mL of Solubilisation Buffer A, that was prepared with guanidine-HCl to denature (solubilise) the inclusion bodies, and incubated o/n at 4ºC and gentle agitation. After incubation, the solution was centrifuged for 30 minutes at 4ºC, and
16 000xg. The supernatant was collected into a new tube and stored at -20ºC before proceeding with
refolding. The total amount of protein was measured in order to calculate the volume of refolding buffer in which the inclusion bodies had to be diluted. The refolding was achieved diluting the protein to a final concentration of 0.1mg/mL. For that, the denatured inclusion bodies were added dropwise to the Refolding Buffer A, at 4ºC, and gentle agitation, and the mixture was incubated for 48h. After, the refolded inclusion bodies were filtered (0.22µm filter) and the protein was concentrated in a Diaflow (Molecular weight cut-off (MWCO) of 10 kDa).
Purification was achieved by performing a desalting step to remove the components present in the Refolding Buffer, where two HiPrep 26/10 Desalting columns were used in series. The columns were first equilibrated with the Desalting Buffer and after, the refolded protein was injected at
1-2mL/min. 2 peaks of each injection step were collected - 1st peak corresponding to the protein in the
new buffer and the 2nd peak corresponding to the old buffer. The selected fractions were pooled and
concentrated using Diaflow and AMICON (MWCO 10KDa). Finally, the protein aliquots were froze in liquid nitrogen and stored at -80ºC.
2.2.2.2 Solubilisation with urea and refolding
In order to improve the yield of purified protein, a new protocol adapted from Zhao et al, 2009
19
10 000xg, at 4ºC during 30 minutes. The pellet was initially resuspended 4 times in solution Wash IB
and centrifuged at 15000xg, for 15 minutes at 4ºC, and secondly resuspended 1 time in solution Wash
IIB and centrifuged in the same conditions. Solubilisation was achieved with urea by resuspending the pure inclusion bodies in Solubilisation Buffer B (9mg pellet - 81 mL buffer) and incubating in agitation
for 1 hour at 37ºC. The mixture was centrifuged at 4ºC, 16 000xg for 15 minutes. The supernatant was
added dropwise to 800mL of Refolding Buffer IB with agitation at 4ºC and after that 800mL of the Refolding Buffer IIB was added dropwise to the mixture in order to adjust the pH to 9.1. The mixture was incubated at 4ºC with gentle agitation during 24h and the solution containing the refolded protein was filtered and stored at 4ºC before purification.
All the purification steps were performed at 4ºC in Akta Prime (GE Healthcare). The first step of purification was an anionic exchange chromatography (AIC) using a HiPrep Q HP 16/10 that was pre-activated with 1 column volume (CV) of Buffer AIC-B and then equilibrated with Buffer AIC-A. The protein was injected o/n and was eluted using a NaCl gradient (0-100% in 200mL) with Buffer AIC-B. After, a 5mL Histrap FF column was used, equilibrated with Buffer Histrap A and injecting o/n. Two injections were made. Before the first injection the column was washed with 10 CVs of Buffer Histrap B and the protein was first eluted with an imidazole gradient using Buffer Histrap C (0-100% in 100mL)
and with Buffer Histrap D using 3 steps – 25%, 50% and 100%. On the second injection, the elution
was made with a gradient of imidazole using Buffer Histrap D (0-100%). All pools obtained were
concentrated and changed to a final Buffer – 20mM Tris-HCl, 300mM NaCl. Finally, the protein was
distributed in aliquots and froze with liquid nitrogen to store at -80ºC.
2.3 Protein expression in mammalian cells HEK293T
2.3.1 Cell culture
To express Notch ligands in mammalian cells Human Embryonic Kidney 293T cell line - HEK293T was used. These adherent cells were maintained using Dulbecco's Modified Eagle Medium
(DMEM) supplemented with 10% Fetal Bovine Serum (FBS) at 37ºC with 95% humidity and 5% CO2
atmosphere. Sub-culturing was performed when the cells reached 85-95% confluency using PBS for to the wash step, and 0.05% Trypsin-EDTA for 5 minutes to detach them. To inactivate the trypsin DMEM supplemented with 10% FBS was used. The cells were diluted 1:10 or 1:20 depending on the interval between sub-cultures. To keep track on the efficiency of sub-culturing, cells were counted using the heamacytometer with Tryptan Blue Dye and the appropriate dilution to allow counting 20-50 cells per square (4 diagonal squares were counted in each site of the heamacytometer).