FACULDADE DE CIÊNCIAS E TECNOLOGIA
UNIVERSIDADE NOVA DE LISBOA
STOCHASTIC MODELLING OF THE RESERVOIR LITHOLOGICAL
AND PETROPHYSICAL ATTRIBUTES. A CASE STUDY OF THE
MIDDLE EAST CARBONATE RESERVOIR
Svetlana Kravets
(Licenciada)
Dissertação para obtenção do Grau de Mestre em Engenharia Geológica (Georrecursos)
Orientador: Doutor José António de Almeida, Prof. Auxiliar – FCT/UNL
Co-orientador: Doutor José Carlos Ribeiro Kullberg, Prof. Auxiliar – FCT/UNL
Júri:
Presidente: Doutor Paulo Alexandre Rodrigues Roque Legoinha, Prof. Auxiliar – FCT/UNL Vogais: Doutor Herlander Mata Lima, Investigador. Auxiliar – Cerena/IST – UTL
Doutor Martim Afonso Ferreira de Sousa Chichorro, Investigador. Auxiliar – FCT/UNL
Doutor José António de Almeida, Prof. Auxiliar – FCT/UNL Doutor José Carlos Ribeiro Kullberg, Prof. Auxiliar – FCT/UNL
ii ATTRIBUTES.A CASE STUDY OF THE MIDDLE EAST CARBONATE RESERVOIR
Copyright em nome de Svetlana Kravets, da FCT/UNL e da UNL
A Faculdade de Ciências e Tecnologia e a Universidade Nova de Lisboa tem o direito, perpétuo e sem limites geográficos, de arquivar e publicar esta dissertação através de exemplars impressos
reproduzidos em papel ou de forma digital, ou por qualquer outro meio conhecido ou que venha
a ser inventado, e de a divulgar através de repositórios científicos e de admitir a sua copia e
iii
I would like to express my greatest gratitude to the professors of FCT UNL Doctor José António de Almeida and Doctor José Carlos Kullberg for the support and guidance throughout my thesis; from initial idea and conceptual advices to supervising and inspiration during the work and great instrumental and technical assistance. It is a great pleasure to work with them and constantly learn something new.
iv
Carbonate reservoirs represent the significant part of oil and gas production. They produce about 50% of hydrocarbons globally. In order to provide the rational exploitation of deposits in carbonate reservoirs it is necessary to ensure accurate prediction and effectively overcome the technical barriers that occur in a complex carbonate formations. The main rules for successful project are to develop and apply reservoir characteristics, to predict performance and productivity, effectively manage diagenesis to optimize production and maximize recovery through reservoir simulation technology. The great development of digital modelling technologies gives the opportunities to solve these problems.
Generation of models of carbonate reservoir rocks by simulating the results of the geological processes involved is very complicated. Mainly because the rock may have undergone several phases of diagenetic processes that might have modified or even completely overprinted texture and fabrics of the original carbonate rock. In spite of this problem, a modelling technique, originally developed for sandstones, has successfully been extended for the 3D modeling of carbonate reservoir rocks. The input data to the modelling is obtained from the geophysical data and logging. In the present work, the virtual pore scale models of carbonates were produced by simulating the results of the geological processes.
The implemented methodology was divided into two main steps. The first stage was a Lithoclasses Modelling. The 3D stochastic geological model of the lithology was produced by the Sequential Indicator Simulation (SIS) algorithm. The second stage was an attribute modelling. The main properties such as porosity and permeability were computed according to the lithoclasses via Direct Sequential Simulation (DSS) algorithm with local histograms. The comparison of the two data sets showed high convergence for the main calculated properties. In the final stage of the work the geobody analysis was conducted. This type of the connectivity analysis performed the geometry of geological facies, trends for property distribution and permeability barriers.
v
Rochas reservatório carbonáticos representam parte significativa da produção de petróleo e gás. Eles produzem cerca de 50% de hidrocarbonetos em todo o mundo. A fim de fornecer a
exploração racional dos depósitos em reservatórios de carbonato, que é necessário para assegurar
a previsão precisa e eficaz superar as barreiras técnicas que podem ocorrer numa formações de
carbonato de complexos. As principais regras para projeto de sucesso são desenvolver e aplicar
características do reservatório, para prever o desempenho e produtividade, gerir eficazmente diagênese para otimizar a produção e maximizar a recuperação através da tecnologia de
simulação de reservatórios. O grande desenvolvimento das tecnologias de modelagem digital dá
as oportunidades para resolver estes problemas.
Geração de modelos de rochas reservatório de carbonato através da simulação dos resultados dos
processos geológicos envolvidos é muito complicado. Principalmente porque a rocha pode ter
sofrido várias fases de processos diagenéticos que poderiam ter modificados ou até mesmo completamente sobreposta textura e tecidos da rocha carbonática original. Apesar deste
problema, uma técnica de modelagem, originalmente desenvolvido para arenitos, com sucesso, foi estendido para a modelagem 3D de rochas reservatórios de carbonato. Os dados de entrada para a modelagem é obtida a partir dos dados geofísicos e madeireiras. No presente trabalho, os
modelos de poros virtuais escala de carbonatos foram produzidos através da simulação dos resultados dos processos geológicos.
A metodologia implementada foi dividida em duas etapas principais. A primeira etapa foi uma Modelagem Lithoclasses. O modelo estocástico 3D geológica da litologia foi produzido pelo
Indicador de Simulação Seqüencial (SIS) algoritmo. A segunda etapa foi uma modelagem
atributo. As principais propriedades como porosidade e permeabilidade foram calculados de acordo com as lithoclasses via Directa Sequencial Simulação algoritmo (DSS), com histogramas
locais. A comparação dos dois conjuntos de dados mostrou convergência elevada para as principais propriedades calculados. Na fase final do trabalho a análise geobody foi conduzido.
Este tipo de análise realizada conectividade a geometria de fácies geológicas, as tendências de distribuição de propriedade e as barreiras de permeabilidade.
Palavras-chave:reservatórios de carbonato, modelagem estocástica, simulação seqüencial,
vi
1 INTRODUCTION 13
1.1 Carbonate reservoir distribution 14 1.2 Current economic situation 15 1.3 Organization of the work 18
2 GEOLOGICAL ENVIRONMENTS 19
2.1 Carbonate rocks: main characteristics 19 2.2 Classification of the carbonate rocks 20 2.3 Depositional environments 26
2.4 Properties 32
2.4.1 Porosity 32
2.4.2 Molds and vugs in carbonate reservoirs 35 2.4.3 Fractured porosity 36
2.4.4 Permeability 38
2.4.5 Pore Size and fluid saturation 39 2.5 Diagenetic process 41 2.6 Reservoir potential. Seals and traps 42 3 PROSPECTING METHODS AND INTEREST VARIABLES 47
3.1 Core description 48
3.2 Seismic surveys 50
3.3 Geophysical well logging 53
4 MODELLING METHODOLOGY 58
4.1 Workflow description 58 4.2 Background of geostatistics 61 4.3 Variograms and spatial continuity 63
4.4 Estimation 67
4.5 Indicator background 68
4.6 Simulation 71
4.6.1 Sequential Indicator Simulation 72 4.6.2 Direct Sequential Simulation 73
4.7 Geobody analysis 75
5 CASE STUDY 77
vii
5.4 3D geological model of lithoclasses 83 5.5 3D Model of porosity 87 5.6 3D model of permeability 95 5.7 Analysis of geobodies 100
6 FINAL REMARKS 102
viii
Figure 1.1.1 – Worldwide distribution of carbonate reservoirs (BP Statistical
Review, 2007; Schlumberger Market Analysis, 2007) 15 Figure 1.2.1 – The main oil producers and consumers (BP statistical Review
of World Energy, 2005) 17
Figure 1.2.2 – Proven oil and gas reserves by region (OPEC Annual Statistic
Bulletin, 2007) 18
Figure 2.2.1 Textural maturity classification of limestone proposed by Folk
(Ham, 1962) 22
Figure 2.2.2 – Folk System classification (Archie, 1952) 23 Figure 2.2.3 – Classification of limestone proposed by Dunham (1962),
(Schlumberger, 2010) 24
Figure 2.2.4 – Carbonate rock examples (Ham, 1962) 25 Figure 2.3.1 – Some typical environments that carbonates can form (Tucker
and Wright, 1990). 26
Figure 2.3.2 – Carbonates depositional environments (reefs and ramps)
(Schlumberger, 2010) 29
Figure 2.3.3 – Idealized shelf cross-section (Schlumberger, 2010) 30 Figure 2.3.4 – Idealized ramp cross-section (Schlumberger, 2010) 30 Figure 2.3.5 – Classification of reefs: fringing reefs (top), barrier reefs
(middle), atolls (bottom) (Schlumberger, 2010) 31 Figure 2.4.1.1 – Changings of the porosity of carbonate sediments from
deposition (Schlumberger, 2010) 33 Figure 2.4.1.2 – Comparison of the primary porosity of carbonate sediments
(Schlumberger, 2010) 34
Figure 2.4.1.3 – Types of microporosity in carbonate rock (Schlumberger,
2010) 34
Figure 2.4.2.1 – Stages in the development of molds and vugs (Schlumberger,
2010) 36
Figure 2.4.3.1 – Examples of fracture porosity in carbonate reservoirs
(adopted from Lucia, 1999) 37
Figure 2.4.3.2 – Diagram illustrating the relationship between fracture porosity, fracture volume, and reservoir drainage area. Intuitively, smaller
ix
illustrating that there is no relationship between porosity and permeability in
carbonate rocks without including pore-size distribution (Lucia, 1999) 40 Figure 2.4.5.2 – Diagram showing smaller pores being filled with a
non-wetting fluid (oil) displacing a non-wetting fluid (water) as capillary pressure
increases linearly with reservoir height (Lucia, 1999) 40 Figure 2.6.1 – Structural traps (Discovery Drilling Funds, 2005) 43 Figure 2.6.2 – Stratigraphic Pinch-Out trap: limestone reservoir loses its
porosity and becomes impermeable limestone (Discovery Drilling Funds,
2005) 43
Figure 2.6.3 – Secondary diagenetic stratigraphic traps. A – Traps were created by post-depositional updip porosity occlusion. B – Traps were created
by post-depositional porosity and permeability enhancement (Archie, 1952). 44 Figure 2.6.4 – Stratigraphic sedimentological trap – reef (Discovery Drilling
Funds, 2005) 45
Figure 3.1.1 – The examples of core sampling of carbonates (Western
Siberia) (TNK, 2005) 49
Figure 3.2.1 – The example of seismic facies analysis of the form seismic
traces (Levyant, 2010) 52
Figure 3.2.2 – Example of FMI images (Schlumberger, 2009) 53 Figure 3.3.1 – EcoScope LWD tool. The EcoScope tool incorporates
resistivity, neutron porosity, sigma and neutron capture spectroscopy sensors into a single compact device. Wireline and LWD tools generally use chemical sources for neutron porosity and neutron capture spectroscopy measurements. The EcoScope tool generates neutrons with a pulsed-neutron generator that operates only when mud is being pumped through the tool (Schlumberger,
2010) 56
Figure 3.3.2 – Pore size and geometry. Measurements from NMR logging tools are more sensitive to pore size and geometry than are resistivity and other porosity measurements. The gamma ray log (Track 1), resistivity logs (Track 2) and porosity measurements (Track 3) are consistent throughout the interval shown. The NMR data (Track 4) indicate a large increase in pore size above X,040 ft that is not seen in the other measurements (adapted from
x – Sequential Indicator Simulation; DSS – Direct Sequential Simulation; POIP –
Potential Oil in place 59
Figure 4.1.2 – Example of transformation into a stratigraphical referential 60 Figure 4.3.1 – Representation of the main variogram parameters 65 Figure 4.3.2 – Representation of theoretical models with the same range
(adapted from Matheron, 1989) 66
Figure 4.5.1 – Representation of a binary map and a binary variable 69 Figure 5.1.1 – Aerial view of the entire field with superposition of the
stochastic simulation grid and well locations. 77 Figure 5.1.2 – Cumulative curves of PHIE for each lithoclass 78 Figure 5.1.3 – Cumulative curves of permeability 78 Figure 5.1.4 – Proportion of each lithoclasses 79 Figure 5.2.1 – Omnidirectional variograms for every surface 80 Figure 5.2.2 – Map of the top of the first layer 81 Figure 5.2.3 – Obtained morphology of the studied layer and location of wells 81 Figure 5.3.1 – The example of coordinate geometric transformation for PHIE
parameter 82
Figure 5.3.2 – Cumulative curves of PHIE parameter for each lithoclass 82 Figure 5.3.3 – Cumulative curves of LDperm parameter for each lithoclass 83 Figure 5.4.1 – Variograms for lithoclasses 2 and 5 for both directions
(horizontal and vertical) 84
Figure 5.4.2 – Multi-phase variograms for lithoclasses with fitted theoretical
model 84
Figure 5.4.3 – Two realization of simulation of the lithoclasses: left –
horizontal; right – cross-section, where colors represent each lithoclass 85 Figure 5.4.4 – Comparison of the well and simulated data 86 Figure 5.4.5 – Multi-phase variogram of one simulated image (horizontal and
xi
models 88-89
Figure 5.5.2 – The obtained maps of PHIE for first and second images of
lithoclasses (horizontal and cross-section) and an average map of phie (30) 91-92 Figure 5.5.3 – Simulated map of Phie with overlaid well data 93 Figure 5.5.4 – Univariate statistics of grid 93 Figure 5.5.5 – Univariate statistics of well data 94 Figure 5.5.6 – Variograms for one simulated images of PHIE conditioning to
the lithoclasses 94
Figure 5.6.1 – Variograms of Ldperm for all lithoclasses with fitted
theoretical model 95
Figure 5.6.2 – Two realizations of LDperm for the first and second images of lithoclasses (horizontal and cross-section) and the average map of LDperm
(logarithmic scale) 96-97
xii
Table 5.1.1 – Lithoclasses identified in the present oil field: typical rock
types and porosity and permeability mean and variance 79 Table 5.2.1 – Parameters of grid used for computing variograms and
kriging process 80
Table 5.4.1 – Theoretical model parameters for the multi-phase
variograms of lithoclasses 83
Table 5.4.2 – Main univariate statistic parameters for well and simulated
data 86
Table 5.5.1 – Parameters of the theoretical models of variograms for PHIE 90 Table 5.6.1 – Parameters of the theoretical model fitted for Ldperm for all
13
1 INTRODUCTION
Hydrocarbon energy sources – oil, gas and coal are the foundation of modern society. There are a lot of hydrocarbon deposits all over the world which are in different geological and tectonic environment.
It is estimated that more than 60% of the world’s oil and 40% of the world’s gas reserves are
held in carbonate reservoirs. The Middle East, for example, is dominated by carbonate fields, with around 70% of oil and 90% of gas reserves held within these reservoirs (BP Statistical Review of World Energy, 2011). Carbonates can exhibit highly varying properties (e.g., porosity, permeability, flow mechanisms) within small sections of the reservoir, making them difficult to characterize. A focused approach is needed to better understand the heterogeneous nature of the rock containing the fluids and the flow properties within the porous and often fractured formations. This involves detailed understanding of the fluids saturation, pore-size distribution, permeability, rock texture, reservoir rock type, and natural fracture systems at different scales.
The key point in a rational development of hydrocarbon deposits in carbonate reservoirs is an accurate forecasting of a structure, lithology and main properties of reservoir. In turn it provides effective and successful production of deposit and maximizing the economic benefit. The most powerful technology to solve these issues is modelling.
14
Modern technology improves our ability to virtually ―see‖ and distinguish the oil and gas before
we drill. The key technology for doing this is modeling of georesources. Modelling is the applied science of creating digital representations of rock features or properties based on geophysical and geological observations. A model is the numerical equivalent of a three-dimensional geological map complemented by a description of physical quantities in the domain of interest. Modeling is commonly used for managing natural resources and natural hazards and quantifying geological processes, in the oil and gas industry, realistic geologic models are designed to simulate reservoirs structure, predict the behavior of the rocks under various hydrocarbon recovery scenarios. An actual reservoir can only be developed and produced once, and mistakes can be wasteful. Using geological models and reservoir simulation allows reservoir engineers to identify based on the data obtained and predicted from model, which recovery options offer the safest and most economic, efficient, and effective development plan for a particular reservoir.
An important part of geologic modelling is related to geostatistics. In order to represent the observed data, often not on regular grids, we have to use certain interpolation techniques. The most widely used technique is kriging which uses the spatial correlation among data and intends to construct the interpolation via variograms. To reproduce more realistic spatial variability and help assessing spatial uncertainty between data, geostatistical simulation is often used, based on variograms, different simulation algorithms or parametric geological objects (Goovaerts 1997).
1.1 Carbonate reservoir distribution
Carbonate rocks in many areas developed widely, making a whole, as in the stratigraphic section sedimentary strata, and in the vast space of complex deposits oil and gas prospects are evaluated on the merits due way recently. Carbonate rocks are characteristic of all geological scale, from the Precambrian to the Neogene system. According to various estimates, carbonate reservoirs are concentrated between 35 and 48% oil and about 23-28% of the gas in the world. In some countries, like Iran, Oman, Syria, Mexico, the share of oil reserves, confined to carbonate collectors, is almost 100% (BP, 2007). In the figure 1.1.1 the global distribution of carbonate reservoirs is presented.
15 structure and specificity of carbonate reservoirs. In consequence with such wide spreading of carbonates and therefore its importance in hydrocarbons production and considering the fact that the leading production regions is also presented with carbonates rocks, currently, their careful investigation is becoming more and more important. It allows to point out the relevance of this work.
Figure 1.1.1 – Worldwide distribution of carbonate reservoirs (BP Statistical Review, 2007; Schlumberger Market Analysis, 2007)
1.2 Current economic situation
16 for alternative sources with low emissions of carbon dioxide, on the other hand, is associated with rising prices for traditional energy resources. The growing of the price was caused by increasing of exploration and exploitation costs, which in turn, rising due to complicated condition of reservoirs involved in production and the depletion stage of the most part of hydrocarbon deposits (Sokolov, 2011).
The structure of energy consumption and production across regions of the world is inhomogeneous.There are the following features for the world oil market. The greater volume of oil produced is consumed in Asia Pacific and North America. At the same time, oil production in these regions is less than the consumption (figure 1.2.1). This difference in volume production and consumption is characteristic for all the world oil market. On 01.01.2011 the amount of recoverable oil reserves in the world amounted to 188 billion tons (in the figure 1.2.2 the proven reserves of oil and gas is shown) (BP., Schlumberger, 2011). At current levels of consumption security reserves is 46 years old. In this case, it is understood that the value of 46 years is largely arbitrary. In indeed, as the depletion of prey is a natural way decline and reduced production even at 30% would have a negative impact on the global economy (Burkhard, 2010). Thus, it is obvious that the world economy faces significant challenges long before they fully exhausted all oil reserves.
18 Figure 1.2.2 – Proven oil and gas reserves by region (OPEC Annual Statistic Bulletin, 2007)
1.3 Organization of the work
2 GEOLOGICAL ENVIRONMENTS
2.1 Carbonate rocks: main characteristics
Carbonate rocks are sedimentary formations, composed of 50% and more carbonate minerals. The basic minerals are calcite (and aragonite) – CaCO3, dolomite – CaMg(CO3)2, as well as
some of the considerably more rarely occurred minerals – magnesium carbonate – MgCO3,
ankerite – Fe,Ca(CO3)2, siderite – FeCO3 and others. In nature only calcite and dolomite are
widely distributed and the rest ones are found in the form of dispersed precipitates or individual lenses. Sometimes they formed more or less significant solid accumulations. Calcite and dolomite as a main rock forming carbonate minerals form limestone, dolomite and others different types of lime-dolomite composition rocks. These rocks are found in sediments of different tectonic structures (platform and geosynclinals) and the very different age from the Precambrian to Neogene (North, 1985; Ahr, 2008).
Limestones and dolomites form some of the largest petroleum reservoirs in the world. Many of the biggest occur in the Middle East (Harris, 1984). Other areas in which carbonate reservoirs deliver large quantities of oil and gas are western Canada, Mexico, Texas (USA), Norway (central North Sea), Poland, Kazakhstan, western and southeastern China, Iran, and Libya. The range of carbonate depositional environments likely to produce significant petroleum reservoirs is more restricted than that for clastics (Russell, et. al., 2009). Almost all of the major petroleum reservoirs in carbonates accumulated as shallow-marine sediment. Also some exceptions such as relatively deep-water pelagic chalks in the North Sea; or the similarly deep-water resedimented reservoir carbonates in Mexico exists.
Carbonate rocks have some unique attributes. One of the key differences between clastic and carbonate rocks is the distance between the site where the sediment was created and where it was deposited. While sand and silt may travel hundreds of miles down river systems before deposition and lithification, the grains that comprise carbonate sediments are usually deposited very close to the place where they were created. Transport related abrasion of carbonate grains is uncommon, and size sorting is generally very poor. Carbonate rock do not owe their mineralogical composition to weathered, parent rocks and their textures do not result from transport down streams and rivers (Lucia, 1999; Harris, et. al., 1984).
20 sedimentary record. They can also modify the geochemical setting enough to cause mineral precipitation. So carbonates are largely made up of skeletal remains and other biological constituents that include fecal pellets, limemud (skeletal), and microbially mediated cements and lime muds (Ahr, 2008).
It is also should be mentioned that carbonates are susceptible to rapid and extensive diagenetic change. Carbonate minerals are susceptible to rapid dissolution, cementation, recrystallization, and replacement at ambient conditions in a variety of diagenetic environments. In short, porosity and permeability in carbonate reservoirs depend on a broad array of rock properties, on diagenetic episodes that may continue from just after deposition through deep burial, and on fracture patterns related more to the geometry of stress fields than to rock type (Lucia, 1999).
2.2 Classification of the carbonate rocks
Numerous methods for carbonate rock classification have been proposed over the past 40 years. The most two widely accepted methods were devised by R.L. Folk (1959, 1962), for laboratory classification mostly, and R.J. Dunham (1962), for industry implement. The classification of carbonates is generally based on the textural and structural peculiarities instead of mineral composition.
The main principles of Folk classification that carbonate rock names consist of a conjunction of two names, one describing the allochems, the large pieces, the other describing the interstitial material. Allochems are equivalent to gravel, sand, lithics or feldspars in the siliciclastics. Interstitial material is equivalent to clay or cements in clastics. There are four kinds of allochems:
Fossils – may be whole fossils, or broken and abraded fossils; all are called "bio" fragments; Oolites – small, pearl-like spheres;
Pellets – fecal pellets produced by invertebrate animals; look superficially like oolites but are dull and not pearl-like;
Intraclasts – chunks of eroded limestone deposited as a conglomerate;
Micrite is "lime mud", the dense, dull-looking sediment made of clay sized crystals of CaCO3.
21 ancient micrites formed in the same way. Many carbonates are composed of nearly 100% micrite. Such rocks are simply called micrites (Folk, 1962).
With carbonates containing allochems the question is whether micrite is present or absent as an interstitial material, and if present by how much. If micrite is present during deposition then it fills the spaces between the allochems and the rock will be given a name which describes the allochems in a micrite matrix. For example, a rock with fossil fragments embedded in micrite is called a "biomicrite". Biomicrite is analogous to a siliciclastic wacke, sand imbedded in a lot of matrix.
If, on the other hand, the depositional environment has strong currents, only allochems may be deposited. This is analogous to a 100% siliciclastic sand on a beach with no silt or clay. Micrite in these cases, being clay sized, has been washed away. The rock formed is then composed only of allochems, held together by clear to translucent calcite crystals with rhombohedral cleavage (called spar or sparite) acting as a cement. The spar is precipitated from fresh or marine water percolating through the sediment after deposition, but before final cementation. This oosparite shows well the spar cement (Folk, 1962).
Thus the classification of carbonates using the allochem/interstitial material system is very systematic and straight forward. The allochem name is combined with the interstitial name (micrite or spar). The figure 2.2.1 below shows the major categories of carbonate rocks based on their allochems and interstitial material.
23 Figure 2.2.2 – Folk System classification (Archie, 1952)
The Dunham system is based on depositional texture that is, the amount of matrix surrounding the grains at the time of deposition. This scheme focuses on the depositional fabric of carbonate rocks. It divides the rocks into four main groups based on relative proportions of coarser clastic particles and deal with the question of whether or not the grains were originally in mutual contact; and therefore self-supporting, or whether the rock is characterized by the presence of frame builders and algal mats. Unlike the Folk classification scheme, Dunham one deals with the original porosity of the rock. The Dunham scheme is more useful industry because of basing on texture not the grains in the sample (Ham, 1962; Tucker, et. al., 1990). The classification is shown in the figure 2.2.3: the figure 2.2.4 represents the images of carbonates based on the Dunham scheme.
According to this classification, grainstones with very little mud blocking pore space, often exibit high porosity and permeability at time of deposition and after diagenesis. They have the
potential to become excellent reservoir rocks. Many of the Middle East’s biggest and best known
25 Coral Boundstone or Framestone Crinoidal Packstone
Crinoidal Wackestone
Oolitic Grainstone Gastropod Packstone
26
2.3 Depositional environments
The facies dependence of fundamental reservoir properties such as porosity and permeability makes it essential to understand the depositional environments for the carbonate reservoir. This allows to predict what type of changes in permeability and porosity may be anticipated above or below the zone of interest (Scholle, et. al., 1983).
Biological and biochemical processes control the development of carbonate sediments. Most carbonate rocks are formed from accumulations of skeletal fragments – the remains of carbonate-secreting animals and plants by precipitation from water; either straight from the water, or induced by organisms, to make their shells or skeletons, and they form in many environments (figure 2.3.1). With a few notable exceptions, inorganic precipitation of calcium carbonate from seawater is rare (Scholle, et. al., 1983). The most important physical factors for carbonate deposition are water temperature, salinity and depth, and the volume and nature of siliciclastic sediments feeding into the depositional setting. Very low input volumes for clastic sediments allow carbonate rocks to accumulate in thick, continuous sequences (Ahr, 2008).
Many carbonate-secreting organisms, such as reef-building corals and calcareous green algae, require warm water to flourish. Today, the majority of carbonate sediments occur in the world's tropical-subtropical belt extending from 30° north to 30° south of the equator. Most of the carbonates formed during geological time have been deposited in low latitudes (Read, 1985).
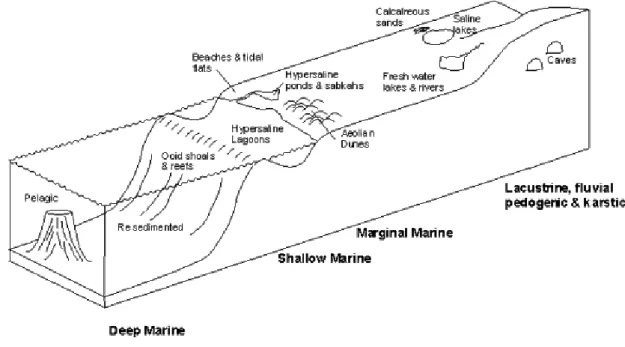
27 According to different authors there various subdivisions of depositional environments of carbonate sediments, but the main scheme is remaining quite constant. For example, the main types of depositional carbonates environments according to Scholle, Bebout and Moore, 1991; are Subaerial exposure, Lacustrine, Eolian, Tidal Flat, Beach, Shelf, Middle Shelf, Reef, Bank Margin, fore-reef Slope, Basin Margin and Pelagic. So the carbonate rocks can be formed both in a continental and marine environment. The subaeral exposure, lacustrine and eolian environment are related to continental cases of carbonate formations. For instance, carbonate deposition can occur in non-marine lakes as a result of evaporation, in which case the carbonates are associated with other evaporate deposits, and as a result of organisms that remove CO2 from the water
causing it to become oversaturated with respect to calcite.
However, basically, most modern, and probably most ancient, carbonates are predominantly shallow water (depths <10-20 m) deposits. This is because the organisms that produce carbonate are either photosynthetic or require the presence of photosynthetic organisms. Since photosynthesis requires light from the Sun, and such light cannot penetrate to great depths in the oceans, the organisms thrive only at shallow depths. Furthermore, carbonate deposition in general only occurs in environments where there is a lack of siliciclastic input into the water. Siliclastic input increases the turbidity of the water and prevents light from penetrating, and silicate minerals have hardness much greater than carbonate minerals, and would tend to mechanically abrade the carbonates. Most carbonate deposition also requires relatively warm waters which also enhance the abundance of carbonate secreting organisms and decrease the solubility of calcium carbonate in seawater. Nevertheless, carbonate rocks form in the deep ocean basins and in colder environments if other conditions are right (James, 1983, Moore, 1983). The main marine carbonate depositional environments are following:
Tidal flats are areas that flood during high tides and are exposed during low tides. Carbonate sands carried in by the tides are cemented together by carbonate secreting organisms, forming algal mats and stromatolites.
28
Deep Ocean. Carbonate deposition can only occur in the shallower parts of the deep ocean unless organic productivity is so high that the remains of organisms are quickly buried. This is because at depths between 3,000 and 5,000 m (largely dependent on latitude – deeper near the equator and shallower nearer the poles) in the deep oceans the rate of dissolution of carbonate is so high and the water so undersaturated with respect to calcium carbonate, that carbonates cannot accumulate. This depth is called the carbonate compensation depth (CCD). The main type of carbonate deposition in the deep oceans consists of the accumulation of the remains of planktonic foraminifera to form carbonate ooze. Upon burial, this ooze undergoes diagenetic recrystallization to form micritic limestones. Since most oceanic ridges are at a depth shallower than the CCD, carbonate oozes can accumulate on the flanks of the ridges and can be buried as the oceanic crust moves away from the ridge to deeper levels in the ocean. Since most oceanic crust and overlying sediment are eventually subducted, the preservation of such deep sea carbonates in the geologic record is rare, although some have been identified in areas where sediment has been scraped off the top of the subducting oceanic crust and added to the continents, such as in the Franciscan Formation of Jurassic age in California (Scholle, Moore, et. al., 1984).
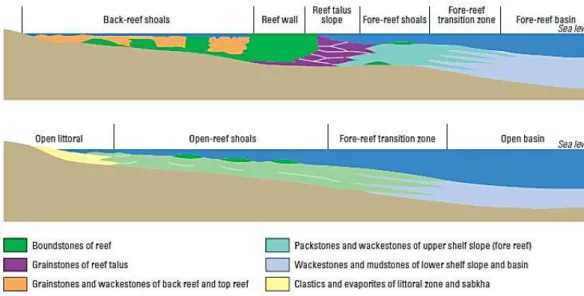
29 Figure 2.3.2 – Carbonates depositional environments (reefs and ramps), (Schlumberger, 2010)
In the main shelf area, carbonate skeletal sands may form barriers, beaches and shoals. Carbonate tidal deltas and sites of ooid deposition may develop along barrier coastlines at the mouths of major tidal channels that connect lagoons and the open sea. Reefs and other forms of carbonate buildup develop along the shelf margin, and may also form lagoonal barriers. Small patch reefs often form on the shelf and within the open lagoons.
In the study area there are three key depositional environments: carbonate shelves, carbonate banks or ramps and reefs.
30 may grow along the shelf edges. The depositional units in this setting are typically interrupted and discontinuous, both laterally and vertically (figure 2.3.3).
Carbonate banks or ramps – gently sloping carbonate platforms that pass, without abrupt changes of slope, from shoreline to basin. Units in a typical shelf sequence have wide lateral continuity, making for very easy stratigraphic and/or facies correlations (figure 2.3.4). Reefs form on shelves and ramps. Linear reefs are generally developed at the edges of shelves.
Figure 2.3.3 – Idealized shelf cross-section (Schlumberger, 2010)
31 Coral reefs can be classified into three main types: fringing reefs, barrier reefs and atolls (Figure 2.3.5). On ramps, the reefs develop as isolated features, making them harder to locate and exploit when they are hydrocarbon bearing.
Figure 2.3.5 – Classification of reefs: fringing reefs (top), barrier reefs (middle), atolls (bottom) (Schlumberger, 2010)
32
2.4 Properties
Carbonates can exhibit highly varying properties (for example, porosity, permeability, flow mechanisms) within small sections of the reservoir, making them difficult to characterize. A focused approach is needed to better understand the heterogeneous nature of the rock containing the fluids and the flow properties within the porous and often fractured formations. This involves detailed understanding of the porosity, pore-size distribution, permeability, rock texture, reservoir rock type, and natural fracture systems at different scales (Ahr, 2008).
The properties such as porosity, permeability, relative permeability, and fluid saturations are linked through pore-size. Pore-size is related to the size and sorting of the particles that make up the fabric of the rock, as well as to the porosity. Fluid saturations, such as water and oil saturations, are a function of pore size, porosity, and capillary pressure. Capillary pressure is directly linked to reservoir height through the density difference of the fluids involved. Permeability is a function of porosity and pore-size. Relative permeability is a function of absolute permeability and fluid saturation, which are both linked to pore-size (Lucia, 1999).
2.4.1 Porosity
Porosity is an important rock property because it is a measure of the potential storage volume for hydrocarbons. Porosity in carbonate reservoirs ranges from 1 to 35%. In carbonate sediment the shape of the grains and the presence of intragrain porosity as well as sorting have a large effect on porosity. The presence of pore space within shells and peloids that make up the grains of carbonate sediments increases the porosity over what would be expected from intergrain porosity alone (Dunham 1962). The effect of sorting on porosity is opposite from that found in siliciclastics. The porosity of modern ooid grainstones averages 45% but porosity increases to 70 % as sorting decreases (Montaron, et. al., 2009). This increase is largely related to the needle shape of the mud-sized aragonite crystal. As a result, there is no simple relationship among porosity, grain size, and sorting in carbonate rocks.
33
framework porosity—pore space formed by rigid carbonate skeletal components such as corals;
interparticle porosity in carbonate sands that depends on grain size, shape and distribution;
porosity in carbonate muds provided by features such as fenestrae (bird's-eyes). Secondary porosity includes:
molds, vugs and caverns formed when grains or rocks are dissolved by groundwater
intercrystalline pores produced by dolomitization
fractured porosity formed by tectonic movements.
The porosity of carbonate sediments is generally very high at time of deposition, but is reduced or lost through cementation, compaction and pressure solution. However, this is not a one-way process (Ahr, 2008). Porosity can increase as a result of solution, dolomitization and tectonic fracturing (figure 2.4.1.1).
Figure 2.4.1.1 – Changings of the porosity of carbonate sediments from deposition (Schlumberger, 2010)
34 rare in limestones, so pores tend to be polyconcave micropores (figure 2.4.1.3). The best primary limestone porosities are in grainstones, especially oolites and calcarenites such as back-reef lime sands.
Packstones, wackestones and mudstones that consist of pure limestone have a compact texture at time of deposition, and this compaction increases during burial. During burial, carbonate porosity is almost always reduced. Burial-related compaction can reduce the thickness of a limestone bed by up to 30% under just a few hundred meters of overburden. However, the reduction of carbonate porosity by compaction is only really significant if the carbonate remains uncemented. There is an inverse relationship between cementation and compaction in limestones (Montaron, et. al., 2009).
Figure 2.4.1.2 – Comparison of the primary porosity of carbonate sediments (Schlumberger, 2010)
35 Calcium carbonate is so abundant that cementation of carbonate rocks is always likely to happen. Other minerals – such as anhydrite – do occur in the cements of carbonate rocks, but sparry calcite derived from the limestone itself is by far the most common cement. The process of pressure solution is much more important in carbonate rocks than in clastic rocks, and it is this process that allows carbonates to generate their own cements. One indication of pressure solution is the development of stylolites (or pressure seams), which are common features in many sequences. Under extreme conditions, cementation may continue until the cement becomes the single largest component in the rock (Archie, 1952).
Counteracting this cementation process is a susceptibility to solution in carbonated waters, which have taken their carbon dioxide into solution from the atmosphere, soils or other limestones. This solution process leads to the development of secondary porosity, the ultimate development of which is karst topography (Archie, 1952).
2.4.2 Molds and vugs in carbonate reservoirs
Oil and gas geologists who work in carbonate reservoirs often spend a lot of time evaluating molds and vugs. Molds are pores formed by solution of an existing rock particle such as a shell fragment, crystal or grain. The resulting porosity is referred to as moldic porosity and is described according to the type of particle removed (e.g., oomoldic for an oolite from which ooids have been dissolved). If the leaching of the original particle passes the point at which it can be identified, the hole is referred to as a vug (figure 2.4.2.1). This factor, not the size of the hole, determines whether it is a mold or a vug. Extreme examples of vugs include the caverns that develop in some limestone sequences as a result of dissolution over thousands or millions of years.
36 Figure 2.4.2.1 – Stages in the development of molds and vugs (Schlumberger, 2010)
2.4.3 Fractured porosity
Carbonate deposits are brittle substances. They do not bend easily in response to Earth movements but fracture and break. These fractures may range between tiny breaks invisible to the naked eye, to wide crevasses. Fractures create another version of secondary porosity. Most of Middle East carbonate reservoirs are present in such carbonate fractures.
37 Fracturing is particularly effective and common in carbonate reservoirs because of the brittle nature of carbonates relative to the more ductile fine-grained siliciclastics with which they are often interbedded. Fracturing can take place at practically any time during the burial history of a carbonate sequence starting with shallow burial because of common early lithification. Fracturing can be associated with faulting, folding, differential compaction, solution collapse, salt dome movement, and hydraulic fracturing within overpressured zones (Lucia, 1999; Moore, et. al., 2001).
Fractures in carbonates are commonly filled with a variety of mineral species including calcite, dolomite, anhydrite, galena, sphalerite, celestite, strontianite, and fluorite (figure. 2.4.3.1). These fractures are, however, generally dominated by carbonate phases. Fracture fills are precipitated as the fracture is being used as a fluid conduit. CO2 degassing during pressure release associated
with faulting and fracturing in the subsurface can result in extensive, almost instantaneous calcite and dolomite precipitation in the fracture. These late carbonate fracture fills commonly have associated hydrocarbons as stains, fluid inclusions, or solid bitumen (Moore and Druckman, 1981).
Fracture porosity is exceedingly important porosity types in the subsurface. However, fractures generally enhance permeability rather than total porosity. Fracture porosity is generally only a small percentage of total reservoir porosity, but because the fractures are connected, the small fracture volume can contribute enormously to total permeability. If fracture porosity amounts only to about 1% in a thick and aerially extensive reservoir, fracture volume can be very large, justifying well spacing of hundreds to 1000 acres. A relationship between fracture porosity, fracture volume, and reservoir drainage area is shown in the figure 2.4.3.2.
38 Figure 2.4.3.2 – Diagram illustrating the relationship between fracture porosity, fracture volume, and reservoir drainage area. Intuitively, smaller drainage areas have smaller fracture volume. (Ahr, 2008)
To sum up, the distribution of primary porosity, and often secondary porosity, is facies controlled. Rocks occur in characteristic assemblages or fades that are controlled by the depositional environment. Certain fades, such as reefs and fore reefs, have high primary porosities compared to other facies, such as fine-grained lagoonal deposits or outer-shelf carbonates. Therefore, to assess reservoir potential, geoscientists must conduct detailed studies of depositional environments (Archie, 1962; Ahr, 2008).
2.4.4 Permeability
Carbonates are characterized by different types of porosity and have unimodal, bimodal and other complex pore size distributions, which result in wide permeability variations for the same total porosity, making difficult to predict their productivity (Lucia, 1999).
39 Permeability is expressed as specific permeability, effective permeability and relative permeability. Specific permeability is the permeability of a reservoir rock to a single fluid. It is measured on core samples, commonly by commercial laboratories. Effective permeability is a measure of the permeability to another fluid when the reservoir is already saturated, that is, the effective permeability to oil of a reservoir rock already saturated with water. The presence of a wetting fluid impedes the entry of a non-wetting fluid; therefore effective permeability is lower than specific or absolute permeability (Lucia, 1999).
Next to basic lithology, effective porosity and specific permeability are the most important variables used to describe reservoir rocks. Absolute permeability, or simply permeability, may vary directly with interparticle porosity in detrital reservoir rocks.
2.4.5 Pore size and fluid saturation
Pore-size is the common factor between permeability and hydrocarbon saturation. Permeability models have historically described pore space in terms of the radius of a series of capillary tubes. The number of capillary tubes has been equated to porosity so that permeability is a function of porosity and pore-radius squared (Al-Hanai, et. al., 2009)
It is common practice to estimate permeability using simple porosity permeability transforms developed from core data. However, porosity permeability cross plots for carbonate reservoirs commonly show large variability (figure 2.4.5.1), demonstrating that factors other than porosity are important in modeling permeability. In general it can be concluded that there is no relationship between porosity and permeability in carbonate rocks unless pore-size distribution is included (Lucia, 1999).
40 Smaller pores are filled with oil as capillary pressure and reservoir height increase. (C) Smallest pores are filled with oil toward the top of the reservoir (Lucia, 1999).
Figure 2.4.5.1 – Plot of porosity and permeability for carbonate rocks, illustrating that there is no relationship between porosity and permeability in carbonate rocks without including pore-size distribution. (Lucia, 1999)
41
2.5 Diagenetic process
Once the sediments have been deposited, a range of chemical and physical processes begin to modify them – altering fundamental rock characteristics such as porosity and permeability. This is known as diagenesis.
Carbonate minerals more susceptible to dissolution, recrystallization, replacement than most siliciclastic minerals. Carbonate minerals may experience pervasive alteration of mineralogy For instance, aragonite – calcite, dolomitization. These changes can alter or destroy original depositional textures. Porosity may be reduced or enhanced (Montaron, et. al., 2009).
After primary deposition of the original calcium carbonate bearing minerals changings during diagenetic process may result in dolostone formation, which are carbonate rocks composed almost entirely of dolomite – (Ca,Mg)CO3.
Two mechanisms of dolomitization of limestones have been proposed based on field and laboratory studies (Ahr, 2008).
Evaporative Reflux. This mechanism involves the evaporation of seawater to form brine that precipitates gypsum. After precipitation of gypsum, the brine is both enriched in Mg relative to Ca and has a higher density. If the brine then enters the groundwater system and moves downward into buried limestones. This Mg-rich brine then reacts with the calcite in the limestone to produce dolomite.
Mixing of Seawater and Meteoric Water. This mechanism involves the mixing of groundwater derived from the surface with saline groundwater beneath the oceans. Dolomitization is thought to occur where the two groundwater compositions mix with each in the porous and permeable limestone within a few meters of the surface.
42 algae themselves reduce the sulfate that would otherwise inhibit the dolomitization process. The vast mats of algae in the epicontinental seas of the great Paleozoic transgressions are undoubtedly a factor in the prevalence of Paleozoic dolomites. There is very little dolomite in the stratigraphic record since the Cretaceous (Harris, 1984; Scott, 1990; Murris, 1980).
2.6 Reservoir potential. Seals and traps
The final step in describing carbonate rock as a potential reservoir for oil and gas after determination of properties is a whole consideration of formation on order to estimate the presence of potential oil trap. So trap is a part of the reservoir, where conditions of occurrence and relationship with shielding rocks provide the possibility of accumulation and long-term conservation of oil and gas. The elements of the traps are:
porous reservoir rock to accumulate the oil and gas – in this case, limestones and dolomites.
overlying impermeable rock to prevent the oil and gas from escaping – seal or cap.
source for the oil and gas, typically black waxy shales.
A trap forms when the buoyancy forces driving the upward migration of hydrocarbons through a permeable rock cannot overcome the capillary forces of a sealing medium. The timing of trap formation relative to that of petroleum generation and migration is crucial to ensuring a reservoir can form.
There are three main types of traps that are based on their geological characteristics: the structural trap, the stratigraphic trap and the far less common hydrodynamic trap. The trapping mechanisms for many petroleum reservoirs have characteristics from several categories and can be known as a combination trap.
43 within the reservoir rock, and are trapped if overlain by an impermeable layer. If fractures occur, oil and gas may seep to the surface.
Fold (structural) trap Fault (structural) trap
Anticlinal trap
Figure 2.6.1 – Structural traps (Discovery Drilling Funds, 2005)
Stratigraphic traps are formed as a result of lateral and vertical variations in the thickness, texture, porosity or lithology of the reservoir rock (figure 2.6.2). Examples of this type of trap are an unconformity trap, a lens trap and a reef trap.
Figure 2.6.2 – Stratigraphic Pinch-Out trap: limestone reservoir loses its porosity and becomes impermeable limestone (Discovery Drilling Funds, 2005)
44 surface. Often a structural element such as tilting is required, so many of these traps can be considered combination traps (Harris, 1984).
The process most favorable to leaching is a marine regression that allows the exposure of carbonates to meteoric waters. Subsequent transgressions bury the weathered, fractured zone characterized by high solution porosity below an unconformity or at a depositional break. Nearly all of the oil in the Middle East's limestone reservoirs is pooled in this type of reservoir and trap (Skelton, et. al., 1990).
Diagenetic traps are a subtype of stratigraphic traps. These are more common in carbonate reservoirs which are more easily affected by cementation, dissolution and dolomitization (figure 2.6.3). These post-depositional processes lead to a lateral change in reservoir quality to acts as the trapping mechanism (Scott, 1990).
Figure 2.6.3 – Secondary diagenetic stratigraphic traps. A – Traps were created by post-depositional updip porosity occlusion. B – Traps were created by post-depositional porosity and permeability enhancement (Archie, 1952).
45 Figure 2.6.4 – Stratigraphic sedimentological trap – reef (Discovery Drilling Funds, 2005)
Hydrodynamic traps are a far less common type of trap. They are caused by the differences in water pressure that are associated with water flow, creating a tilt of the hydrocarbon-water contact.
The seal is a fundamental part of the any type of trap that prevents hydrocarbons from further upward migration. A capillary seal is formed when the capillary pressure across the pore throats is greater than or equal to the buoyancy pressure of the migrating hydrocarbons. They do not allow fluids to migrate across them until their integrity is disrupted, causing them to leak. There are two types of capillary seal whose classifications are based on the preferential mechanism of leaking: the hydraulic seal and the membrane seal (Halliburton, 2001; Gluyas, Swarbrick, 2004).
The membrane seal will leak whenever the pressure differential across the seal exceeds the threshold displacement pressure, allowing fluids to migrate through the pore spaces in the seal. It will leak just enough to bring the pressure differential below that of the displacement pressure and will reseal (Gluyas, Swarbrick, 2004).
The hydraulic seal occurs in rocks that have a significantly higher displacement pressure such that the pressure required for tension fracturing is actually lower than the pressure required for fluid displacement – for example, in evaporates or very tight shales. The rock will fracture when the pore pressure is greater than both its minimum stress and its tensile strength then reseal when the pressure reduces and the fractures close (Gluyas, Swarbrick, 2004).
Over geological time the Middle East region has passed through the equatorial belt a number of times. Optimum conditions for reef growth occurred during the Precambrian, Jurassic, Cretaceous and Middle Tertiary.
3 PROSPECTING METHODS AND INTEREST VARIABLES
The determination of hydrocarbon in place and technically recoverable reserves requires the implementation of a data acquisition scheme. The degree of understanding of reservoir continuity and properties should improve with each well drilled but will always be a subject of uncertainty.
The data collected in the pre-development, reservoir appraisal and delineation stage needs careful planning and coordination in order to extract the maximum information. The basic step in reservoir characterization is the obtaining field information. The further stages of exploration work at the reservoir or deposits directly depend on the quality of morphological, lithological and petrophysical information.
The complex investigation of carbonate hydrocarbon reservoirs via geological, geophysical and field methods has a great scientific and practical importance. The role of geophysical prospecting technics is essentially increasing when carbonates rocks are investigated because core collected not from the whole thickness of rock does not provide their authoritative description. Petrophysical measurements provide a basis for quantifying geological descriptions. Usually these measurements and descriptions are expanded in one dimension by detailed sampling of core material. However, cores are normally available from only a few wells, whereas wireline logs are available from most wells. Therefore, using correlation methods is preferably in order to associate the facies descriptions with wireline logs and core data. Such methods as drilling time logs, drill cuttings, mud logging and measurements while drilling represent the earliest information available, and can help in determining intervals for coring, thicknesses of porous, hydrocarbon bearing layers, the lithology of the section, and possibly the type of hydrocarbon (Halliburton, 2001).
Sidewall cores and core samples give information about lithology pore structure, porosity, permeability, and may help to determine depositional environments, fluid saturations and hydrocarbon type. Special core analysis techniques will indicate recovery potential (Levyant, 2010).
48 zonation. Logs may be open hole or cased hole production logs (Archer, 1986; Gluyas, et. al., 2004).
Well tests and fluid sampling. generally conducted in cased hole, represent hydrocarbon type and fluid samples and give information about initial reservoir pressure, pressure gradients, permeability, thickness estimates, and well productivities.
There are a number of parameters that are needed by the exploration and development and production of a formation. These parameters are provided from a number of different sources including, seismic records, coring, mud logging, and wireline logging (Archer, 1986). Based on the abovementioned there are some main source of obtaining geological information – core sampling and analysis, geophysical well logging and seismic. The initial information for the case study of this work was also provided by these methods.
3.1 Core description
The first step in quantifying a geologic model is the rock description from core material. The best sampling method is to drill 1-inch-diameter core plugs for analysis from every foot of core and to prepare a thin section from the end pieces for detailed rock description. Basic petrophysical quantification, lithology, dolomite crystal size, fabric, petrophysical class, amount and type of vugs are obtained from core description. Supplementary information includes grain types and visible interparticle porosity, is best obtained from thin sections.
49 under the best possible conditions (Harris, 2010). In the figure 3.1.1 the examples of core samples is shown.
The base for determining the calculation parameters is a petrophysical relation found in the process of core description in the laboratory. Obtaining reliable petrophysical relationships for carbonate reservoirs can be achieved only with a representative core sample of sufficiently large dimensions with remaining natural structure of the pore space. This is especially important for the cavernous reservoirs in which the ratio of interstitial pores and cavities should be preserved, as in natural conditions.
Figure 3.1.1 – The examples of core sampling of carbonates (Western Siberia) (TNK, 2005)
The physical properties of reservoir rocks are largely determined by the geometry of the pore space, pore shape parameter is a quantitative expression of it. The investigation of relations between the shape pore parameter and petrophysical properties of carbonate rocks (density, porosity, permeability, electrical resistivity) makes it possible to separate the types of reservoirs in dependence on the structure of the pore space.
50 properties. The scale of the alteration depends on clay content and structure of the pore space, characterized by fractured, vugs and intergrain porosity. In the rocks with a homogeneous structure of the pore space changes of petrophysical characteristics under the influence of temperature and pressure factors are small and it can be neglected by a first approximation. In reservoirs with complex geometry since the changes are more significant and may lead to a systematic error in the determination of reservoir properties from laboratory dependences obtained without taking into account reservoir pressures and temperatures (North, 1985; Harris, 2010).
Accurate estimation of parameters of carbonate reservoir depends on accuracy determination of its type. Simultaneous analysis of core and geophysical well logging give an opportunity to provide full characterization of complex carbonate reservoirs.
3.2 Seismic surveys
The reliability of geophysical surveys, particularly seismic, has greatly reduced the risk associated with drilling wells in existing fields, and the ability to add geophysical constraints to statistical models has provided a mechanism for directly delivering geophysical results to the reservoir model.
Most reservoir characteristics are based on reflection seismic data, although a wide variety of other techniques are employed regularly on specific projects. Almost all seismic data collected for reservoir studies is high-fold 3-D vertical-receiver data; however, the use of converted-wave data with multiple component geophones on land and on the sea floor, and multicomponent source (on land) is increasing. The importance of fractures in carbonate reservoir development schemes has led to a number of experimental programs for multicomponent sources and receivers in an effort to identify shear-wave splitting (and other features) associated with high fracture density. Some of these techniques will find continually increasing application in the future, but at the present, most surface seismic studies designed to characterize existing reservoirs are high-quality 3-D vertical-component receiver surveys (Pennington, 2001; Sheriff, 1992).
51 of seismic surveys for estimation of reserves and substantiation of development parameters in the conditions of such carbonate sections. The use of special processing techniques, different types of inversions of seismic data, seismic facies analysis, estimation and analysis of certain seismic attributes allow performing more accurate mapping of surfaces associated with top or base of the reservoir, identifying local bodies and predicting the permeability and porosity properties of fractured-cavernous type of carbonate reservoirs (Montaron, et. al., 2009).
Main geological problems, with which the seismic faced with because of specific conditions of the carbonate reservoirs, are mapping of the top and bottom of the carbonate reservoir, lithology differentiation and properties prediction (Archer, 1986).
At the interpretation stage of the morphology (top and bottom) of carbonate reservoirs the main problem is a multiple correlation (Gluyas, Swarbrick, 2004). The target reflections are almost always characterized by low amplitudes, the interference decay and seismic event discontinuities that make the interpretation process more. The main reason related to the specialty of the structure and formation derivations of carbonate reservoirs. Last research suggests that the implementation of cube acoustic impedance as an interpretation base leads to more reliable correlation and more confidence differentiation of the organic structures (Levyant, 2001)
Another problem is an existence of velocity anomalies. The basic strategy of its resolution is an integrated approach of using of all geological and geophysical information in the velocity model formation (Montaron, et. al., 1996).
52 Figure 3.2.1 – The example of seismic facies analysis of the form seismic traces (Levyant, 2010)
The third geological problem is the prediction of properties, specifically porosity and permeability as key properties in the case of the carbonate reservoirs. Most existing approaches can be classified into two groups: 1 - it recounts based on both linear and multidimensional dependence and forecast properties by the technology of neural net sometimes called a direct prognosis. Such solutions can be implemented as on a dynamic phase of interpretation, and on the stage of the geological modelling as well (Archer, 1986).
For porosity prediction the inversion technology of seismic data provide optimal results. As the porosity and permeability of carbonate reservoirs are connected with the fissility of rocks the seismic methods are used to its investigation. The approach of the fissure and cavity study depends on its size. There are two areas: interpretation of fissure system that are greater than seismic wave, and interpretation of micro-fissures that are comparable with the length of the seismic waves. In the first case the geometric attributes is applied, for the second – methods of analysis of the azimuthal anisotropy of kinematic and dynamic characteristics of the wave field (Endres, Lohr, et. al., 2008).
53 increased fracturing. The most efficient is use a combination of various attributes, and the classification methods (Sheriff, 1992; Pennington, 2001).
The great interest represents the integration of the fracturing and fissuring at the stage of geological modeling. The reference information point for modeling of fractures and fissures is a well data. Interpretation results of Formation Micro Imager (FMI) technology (figure 3.2.2) allows highlight main areas of micro-fissuring. Spatial information about the main directions of fracturing can be found of the seismic data, using the possibilities of the coherence cube technology. The obtained data about fracturing and fissuring may be used for further modelling of attributes. (Singh, 2001)
Figure 3.2.2 – Example of FMI images (Schlumberger, 2009)
Analysis of current investigation approaches and technology of complex carbonate environments suggests that there is a sufficiently rich arsenal of tools to solve the most complicated geological problems, and a plenty of practical examples convince the feasibility of their usage. All of these techniques focused on fundamental study of geological environment that provide a more detailed geological field model, which in turn allows to optimize the further development, minimize operating costs, increase a production and extend the exploitation period of a field as well.
3.3 Geophysical well logging
54 the reservoirs, the study of the technical condition of wells, monitoring the development of hydrocarbons.
The complexity conditions of the reservoir geometry require a comprehensive study of the physical properties. In this regard, there are a large number of geophysical well logging techniques, which combine several groups. The main ones are electrical, electromagnetic, nuclear physics, and acoustics methods. There are also thermal, magnetic, gravity, mechanical, and geochemical methods.
Effective solution of geological and technological challenges can only be based on an integrated application of geophysical methods with different petrophysical basis (electrical, nuclear, acoustic, etc.). The similarity of problems and solutions for different regions allows the model complex geophysical researches of wells drilled with the purpose of searching and exploration of similar minerals. In order to improve the effectiveness of geophysical methods a combination of such technological measures as changing wellbore fluid, increasing the diameter wells (drilling), hydrodynamic stimulation, and injection of tracer fluid is used. Analyzing the changes of geophysical parameters over time, it is possible to determine the true nature of the saturation recovery and to evaluate their initial and residual oil-and-gas content. A growing body of well logging, the complexity of the geological problems led to the development of systems of interpretation of complex data. These systems provide a preliminary assessment of the quality and selection of materials, the dismemberment of the section, the definition of bed boundaries, the allocation of mineral resources, evaluation of productivity of deposits (Sheriff, 1992).
Log measurements, when properly calibrated, can give the majority of the parameters required. Specifically, logs can provide a direct measurement or give a good indication of: porosity, both primary and secondary; permeability; water saturation and hydrocarbon movability; hydrocarbon type; lithology; formation dip and structure, sedimentary environment and also travel times of elastic waves in a formation. These parameters can provide good estimates of the reservoir size and the hydrocarbons in place.