Márcia Tojeira Tavares
Licenciada em Bioquímica
Development of composite particles for
pulmonary delivery
Dissertação para obtenção do Grau de Mestre em
Biotecnologia
Orientadora: Prof. Doutora Ana Aguiar-Ricardo, FCT-UNL
Co-orientadora: Doutora Teresa Casimiro, FCT-UNL
Júri:
Presidente: Prof. Dr. Carlos Salgueiro
Arguente: Dr. Eunice Costa
Vogais: Prof. Dr. Ana Aguiar-Ricardo
Development of composite particles for pulmonary delivery
Copyright © Márcia Tojeira Tavares, FCT-UNL, FCT
I
Acknowledgments
First of all I would like to thank to my supervisor Prof. Doctor Ana Aguiar-Ricardo, for giving me the opportunity to work in the Polymer Synthesis and Processing laboratory and for all the guidance and support given throughout this year. Likewise I want to thank to my co-supervisor Doctor Teresa Casimiro, whom positive and enthusiastic supervision was very important to keep me on working without giving up.
Funding from Fundação para a Ciência e Tecnologia (FC&T-Lisbon) through contracts PTDC/EQU-EQU/116097/2009 and Pest-C/EQB/LA0006/2013 is acknowledged.
I also would like to thank to Prof. Alexandra Fernandes, for giving me the opportunity to work in her laboratory and also for the guidance, and to Pedro Martins and Anna Tolmatcheva whose help and time I appreciate very much.
To my dearest thesis partner and friend, Anita Lourenço, for making the workplace an even better one with her presence, for the support, friendship and mostly patience to deal with me on a daily basis. To Renato Cabral, who taught me so many useful things to my work, who supported me and who was always available to help with my SAA problems, and to Ana Sousa that was my partner right from the beginning and that explained to me all that I needed to know about the SAA, I thank very much for the patience and for making those 2 hour assays so much fun.
I would also like to thank Vanessa Correia and Patrícia Morgado for all the incentive, advice and friendship, you are the best work buddies.
To Rita Restani for being a great work partner, I thank the help, but mostly I thank the joy and for always making me laugh.
To all the 510/508 lab team: Sofia Silva, Dr. Vasco Bonifácio, Telma Barroso, Tiago Reis, Rita Pires, José Pinto, Raquel Viveiros, Pedro Lisboa, Carmen Montoya and Gosia Zakrzewska.
To Mrs. Maria José Carapinha, Mrs. Conceição and Mrs. Idalina for all the assistance.
To all my friends, in and outside the university campus, for the support and for the good moments that I had with all of you this last year.
III
Abstract
In this work, biocompatible and biodegradable poly(D-L-lactide-co-glycolide) (PLGA) microparticles with the potential for use as a controlled release system of vaccines and other drugs to the lung were manufactured using supercritical CO2, through the Supercritical Assisted Atomization (SAA)
technique. After performing a controlled variance in production parameters (temperature, pressure, CO2/solution flow ratio) PLGA microparticles were characterized and later used to encapsulate active
pharmaceutical ingredients (API). Bovine serum albumin (BSA) was chosen as model protein and vaccine, while sildenafil was the chosen drug to treat pulmonary artery hypertension and their effect on the particles characteristics was evaluated. All the produced formulations were characterized in relation to their morphology (Morphologi G3 and scanning electronic microscopy (SEM)), to their physical-chemical properties (X-ray diffraction (XRD, differential scanning calorimetry (DSC), Fourier transform infrared (FTIR)) and aerodynamic performance using an in vitro aerosolization
study – Andersen cascade impactor (ACI) - to obtain data such as the fine particle fraction (FPF) and the mass median aerodynamic diameter (MMAD). Furthermore, pharmacokinetic, biodegradability and biocompatibility tests were performed in order to verify the particle suitability for inhalation. The resulting particles showed aerodynamic diameters between the 3 and 5 μm, yields up to 58% and FPF percentages rounding the 30%. Taken as a whole, the produced microparticles do present the necessary requests to make them appropriate for pulmonary delivery.
Keywords: Microparticles; Pulmonary delivery; Poly(lactic-co-glycolic acid); Supercritical Assisted
V
Resumo
Neste trabalho, desenvolveram-se micropartículas de ácido poli(láctico-co-glicolídico) (PLGA) biocompatíveis e biodegradáveis com potencial uso como sistemas de libertação controlada de vacinas e outros fármacos , através da técnica de atomização assistida por CO2 supercrítico (SAA). Depois de
variar controladamente os parâmetros de produção (temperatura, pressão, rácio CO2/solução), as
micropartículas de PLGA foram caracterizadas e posteriormente utilizadas para encapsulação de princípios ativos. A albumina do soro bovino (BSA) foi escolhida como proteína e vacina modelo enquanto o sildenafil foi escolhido como o fármaco para tratar a hipertensão arterial pulmonar, e foram avaliados os efeitos de ambos nas características das partículas. Todas as formulações produzidas foram caracterizadas em relação à sua morfologia (Morphologi G3, espectroscopia eléctronica de varrimento (SEM)), às suas propriedades físico-químicas (difracção de raio-X (DRX), calorimetria diferencial de varrimento (DSC), espectroscopia de infravermelho (FTIR)) e ao seu desempenho aerodinâmico usando um estudo de aerossolização in vitro –Andersen cascade impactor (ACI) - para
obter valores tais como fração de partículas finas (FPF) e o diâmetro aerodinâmico mediano de massa (MMAD). Para além disso, executaram-se testes farmacocinéticos, de biodegradação e de biocompatibilidade para verificar se as partículas são adequadas para inalação. As partículas obtidas mostram diâmetros aerodinâmicos entre 3 e 5 μm, rendimentos até os 58% e percentagens de FPF a rondar os 30%. Em geral, as micropartículas produzidas apresentam os requerimentos necessários que as fazem apropriadas para administração via pulmonar.
Palavras-Chave: Micropartículas; Administração pulmonar; Ácido poli(láctico-co-glicolídico);
VII
Contents
Acknowledgments ... I Abstract ... III Resumo ... V Index of Figures ... IX Index of Tables ... XI List of Abbreviatons ... XIII
1. Introduction ... 1
1.1 Vaccines ... 2
1.2 Pulmonary Arterial Hypertension... 2
1.3 Dry Powder Inhalers ... 4
1.4 Characterization of inhaled particles ... 5
1.5 Poly (lactic-co-glycolic acid) ... 8
1.6 Bulking Agents ... 10
1.7 Particle Production ... 11
1.8 Supercritical Fluid Technology ... 11
1.9 Supercritical Assisted Atomization ... 12
2. Experimental Section ... 15
2.1 Materials ... 15
2.2 Microparticles Preparation ... 15
2.2.1 BSA-Loaded Microparticles ... 15
2.2.2 SDF-Loaded Dendrimers Encapsulated in Microparticles ... 15
2.2.3 SAA Apparatus ... 15
2.3 Microparticles Characterization ... 16
2.3.1 Particle size distribution ... 16
2.3.2 Particles morphology ... 16
2.3.3 Bulk density ... 17
2.3.4 Differential scanning calorimetry (DSC) ... 17
2.3.5 X-ray diffraction ... 17
2.3.6 Fourier Transform Infra Red (FT-IR) ... 17
2.3.7 Water Content Determination... 17
2.3.8 Drug Loading and Encapsulation Efficiency... 17
2.3.9 Aerodynamic Properties ... 18
2.3.9.1. Emitted Fraction……….………..18
VIII
2.3.10 Pharmacokinetic Studies ... 19
2.3.10.1. BSA-loaded Microparticles………...19
2.3.10.2. SDF-Loaded Dendrimers Encapsulated in Microparticles………...19
2.3.11 Biodegradability Assays ... 20
2.3.12 Biocompatibility Assays ... 20
2.3.13 Design of Experiment (DoE) ... 21
3. Results and Discussion ... 23
3.1 PLGA microparticles ... 23
3.1.1 Morphology ... 24
3.1.2 Aerodynamic Performance ... 26
3.1.3 Physical-Chemical Properties ... 27
3.1.4 Biodegradability Assays ... 29
3.2 BSA-loaded microparticles ... 29
3.2.1 Morphology ... 30
3.2.2 Aerodynamic Performance ... 33
3.2.3 Physical-Chemical Properties ... 35
3.2.4 Pharmacokinetic Studies ... 39
3.2.5 Biodegradability Assays ... 41
3.2.6 Biocompatibility ... 42
3.2.7 Design of Experiment ... 42
3.3 Dendrimer-loaded microparticles ... 45
3.3.1 Morphology ... 46
3.3.2 Aerodynamic Performance ... 48
3.3.3 Physical-Chemical Properties ... 49
3.3.4 Pharmacokinetic Studies ... 51
3.3.5 Biodegradability Assays ... 53
3.3.6 Biocompatibility ... 53
4. Discussion ... 55
5. Conclusion ... 57
IX
Index of Figures
Figure 1.1 - Sildenafil (a) and a G3 Dendrimer25 (b) structures. ... 3
Figure 1.2 - Schematic representation of (a) a person using an inhaler 32 and (b)an example of a dry powder inhaler.33 ... 5
Figure 1.3 - Representation of the different stages of the respiractory tract and the particles’ deposition according to size. Adapted from Ungaro F. et al.39 ... 6
Figure 1.4 - Representation of the Andersen cascade impactor as well as its different stages and respective cut-off diameters at 60 L/min, adapted from Mitchell, J. P. et al.44 ... 7
Figure 1.5 - PLGA structure, with the lactic acid between the left-side brackets and the glycolic acid between the right-side brackets. x and y represent the number of times the unit it repeated. ... 9
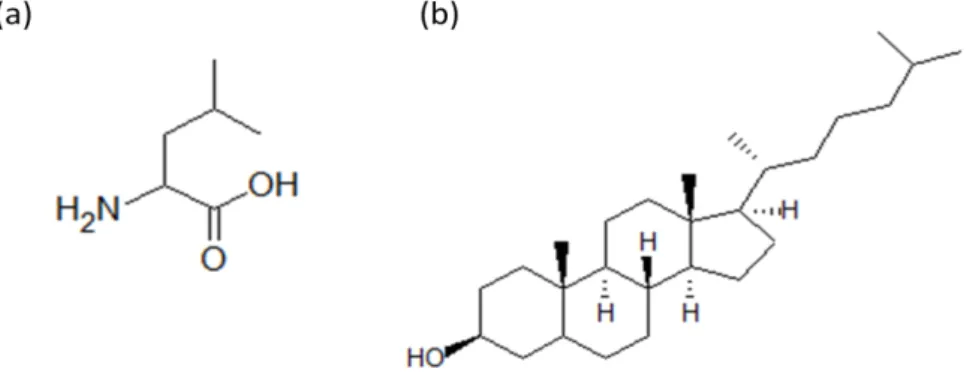
Figure 1.6 - L-leucine (a) and cholesterol (b) structures. ... 10
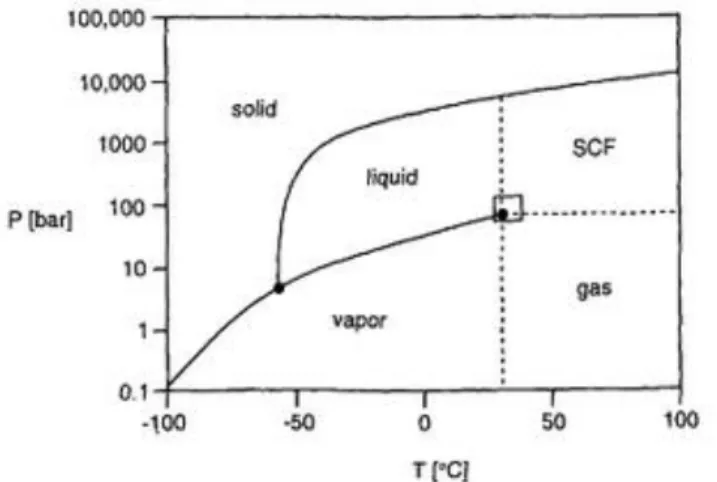
Figure 1.7 - Phase diagram of CO2 adapted from Leitner W. et al.73 ... 12
Figure 1.8 - Representation of SAA’s double atomization: pneumatic atomization (left-side) and decompressive atomization (right side), adapted from Porta, G. Della et al.81 ... 13
Figure 2.1 – Schematic representation of the SAA apparatus: (CB) cryogenic bath; (LP) liquid pump; (HB) heating bath; (TC) temperatute controller; (M) manometer; (S) saturator; (P) precipitator; (c) cyclone. ... 16
Figure 2.2 - Experimental set-up to perform ACI (adapted from European Pharmacopeia)41. ... 19
Figure 3.1 - SEM images of the PLGA microparticles with a magnification of (a) 1,500x and (b)10,000 x ... 25
Figure 3.2 - Morphologi G3 images of the PLGA microparticles (a;b) at assay 3 and (c;d) 4. (a;c) and (b;d) used magnifications of 20,000 and 50,000 respectively. ... 26
Figure 3.3- Graphical representation of the powder distribution in the ACI apparatus for the PLGA microparticles ... 26
Figure 3.4 - X-ray Diffraction. (a) unprocessed PLGA; (b) PLGA microparticles ... 27
Figure 3.5 – DSC of (a) unprocessed PLGA and (b) PLGA microparticles ... 28
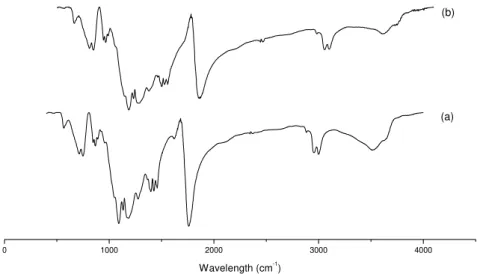
Figure 3.6 - FTIR. (a) unprocessed PLGA; (b) PLGA microparticles ... 28
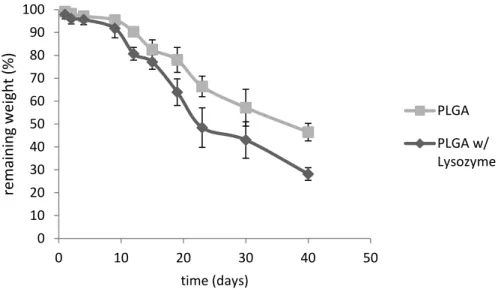
Figure 3.7 – Graphic representation of the PLGA degradation in a solution with and without lysozyme. ... 29
Figure 3.8 - SEM images of PLGA microparticles and the BSA-loaded PLGA microparticles with a magnification of (a) 1,500x (c) 5,000x and (b;d)10,000 x ... 32
Figure 3.9 - Morphologi G3 images of the (a) BSA-loaded PLGA microparticles; (b) Leucine loaded PLGA microparticles; (c;d) BSA/leucine loaded PLGA microparticles. (a;b;d) and(c) used magnification of 20,000 and 50,000 respectively. ... 32
Figure 3.10 – Morphologi G3 images from BSA-loaded particles when in contact with a simulated lung fluid. (a) t=omin (b) t=10min. Images have a magnification of 50.000x ... 33
Figure 3.11 - Graphical representation of the powder distribution in the ACI apparatus for the BSA-loaded and BSA/Leu-BSA-loaded PLGA microparticles. ... 34
Figure 3.12 - Graphical representation of the BSA distribution in the ACI apparatus for the BSA-loaded and BSA/Leu-BSA-loaded PLGA microparticles. ... 35
Figure 3.13 - X-Ray Diffraction. (a) unprocessed BSA; (b) BSA microparticles; ... 35
Figure 3.14 – X-Ray Diffraction. (a) PLGA microparticles; (b) BSA microparticles; (c)Leucine ; (d) PLGA-BSA microparticles; (e) PLGA-Leu microparticles ; (f) PLGA-BSA-Leu microparticles. ... 36
Figure 3.15 - DSC of (a) PLGA microparticles; (b) raw BSA; (c) BSA-loaded PLGA microparticles; (d) Leucine-loaded PLGA microparticles; (e) BSA/leu-loaded PLGA microparticles. ... 37
X Figure 3.17 - FTIR. (a) PLGA microparticles; (b) Leucine; (c) Leu-loaded PLGA microparticles; (d)
BSA/Leu-loaded microparticles ... 39
Figure 3.18 - Release profiles on the first 60% of BSA (a;c) and on the 100% release of BSA(b )adjusted with Kormsmeyer and Peppas equation and Peppas-Sahlin equation respectively. A zoom of the first two hours release is represented in (c). ... 40
Figure 3.19 - Graphic representation of the BSA/Leu PLGA microparticles degradation in a solution with and without lyzozyme. ... 41
Figure 3.20 – Graphic representation of the BSA, PLGA and BSA/leu-loaded PLGA microparticles effect in cell viability. ... 42
Figure 3.21 – Effect of BSA and leucine in the particles MMAD ... 43
Figure 3.22 - Effect of BSA in the particles FPF ... 44
Figure 3.23 – Effect of leucine in the particles Dv50 ... 45
Figure 3.24 - Morphologi G3 images of the (a) Meox; (b) EtOx (c) MeOx-SDF; (d) EtOx-SDF; (e) PLGA/Chol. The used magnification was 50,000x. ... 47
Figure 3.25 - Graphical representation of the powder distribution in the ACI apparatus for the cholesterol-loaded and dendrimer-loaded PLGA microparticles. ... 48
Figure 3.26 – X-ray Diffraction. (a) PLGA-Chol; (b) MeOX; (c)EtOx; (d) MeOX-SDF; (e) EtOx-SDF ... 49
Figure 3.27 – DSC. (a) PLGA-Chol; (b) MeOx; (c) EtOx; (c)MeOX-SDF; (e)EtOx-SDF. ... 50
Figure 3.28 – FTIR. (a) PLGA-Chol; (b) MeOX; (c) EtOx; (d) MeOX-SDF; (e) EtOx-SDF ... 51
Figure 3.29 - Release profiles on the first 60% of Sildenafil of (a;c) EtOx-SDF and of (b;d) MeOx-SDF adjusted with Kormsmeyer and Peppas equation. ... 52
Figure 3.30 - Release profiles of Sildenafil of (a) EtOx-SDF and of (b) MeOx-SDF adjusted with Peppas and Sahlin equation. ... 52
Figure 3.31– Graphic representation of the biodegradation of PLGA microparticles, PLGA/Chol, MeOx and EtOx microparticles ... 53
Figure 3.32 - Graphic representation of the 24hour (a) and 48 hour (b) sildenafil effect in cell viability. ... 54
XI
Index of Tables
Table 1.1 – Comparison between the different inhalers relatively to different characteristics. ... 4 Table 3.1- Operating parameters of some of the PLGA assays and the respectively yield. ... 24
Table 3.2 – Properties of PLGA microparticles ... 24 Table 3.3 – Representation of the aerodynamic properties determined by ACI and DUSA for the PLGA microparticles. ... 27 Table 3.4 - Operating parameters of some of the BSA-loaded PLGA assays and the respectively yield. ... 30 Table 3.5 - Operating parameters of some of the BSA-loaded PLGA assays using leucine and the respectively yield. ... 30 Table 3.6 – Properties of BSA-loaded PLGA microparticles ... 31 Table 3.7 - Properties of BSA-loaded PLGA microparticles using leucine. ... 31 Table 3.8 - Representation of the aerodynamic properties determined by ACI and DUSA for the BSA-loaded PLGA microparticles. ... 34 Table 3.9 – Water content values for the PLGA, BSA-loaded, Leucine-loaded and BSA/leucine-loaded PLGA microparticles ... 39 Table 3.10 – Cinetic values obtained from the Korsmeyer Peppas and Peppas & Sahlin equations for the BSA-loaded and BSA/Leu-loaded PLGA microparticles- ... 41 Table 3.11 - ANOVA testing the effects of the parameters on MMAD for a significance level of 5%.
p-values marked with * mean p<0.05; ** p<0.01; *** p<0.001; **** p<0.0001. ... 43
Table 3.12 - ANOVA testing the effects of the parameters on FPF for a significance level of 5%. p
-values marked with * mean p<0.05; ** p<0.01; *** p<0.001; **** p<0.0001. ... 43 Table 3.13 - ANOVA testing the effects of the parameters on Dv50 for a significance level of 5%. p
-values marked with * mean p<0.05; ** p<0.01; *** p<0.001; **** p<0.0001. ... 44 Table 3.14 - ANOVA testing the effects of the parameters on ED for a significance level of 5%. p
XIII
List of Abbreviatons
ACI: Andersen cascade impactor. API: Active pharmaceutical ingredient. BSA:Bovine serum albumin.
Chol: Cholesterol
Da:Aerodynamic diameter. DoE: Design of experiment
Dn50:Particle mean numeric diameter.
DPI: Dry powder inhaler
DUSA: Dosage unit sampling apparatus Dv50:Particle mean volumetric diameter.
DSC:Differential scanning calorimetry. EF: Emitted fraction.
EtOx: [PureG4EtOx]PLGA/Chol
EtOx-SDF: [PureG4EtOx-SDF]PLGA/Chol FPF:Fine particle fraction.
FTIR: Fourier transform infra red. GSD:Geometric standart deviation. Leu: L-Leucine.
MeOx: [PureG4MeOx]PLGA/Chol
MeOx-SDF: [PureG4MeOX-SDF]PLGA/Chol. MMAD:Mass median aerodynamic diameter. PLGA: Poly (lactic-co-glycolic acid).
SAS:Supercritical antisolvent. scCO2:Supercritical carbon dioxide.
SDF:Sildenafil.
Tg:Glass transition temperature.
1
1.
Introduction
The routes of drug administration usually reach lungs, skin and intestinal tract, since these organs have a direct contact with the exterior. Even though the oral route is simple and the most common one, it has a risk of drug decomposition by digestive system. The transdermal route is also simple, but an adsorption efficiency of drugs is generally low in this method. Injections result in high adsorption efficiency, an early effect of injected drugs’ pharmacological actions, and no risk of drug decomposition by digestive organs. However, because this is an invasive method, it provokes discomfort to patients.1
The local application of drugs to the respiratory tract via inhalation facilitates a site specific treatment of lung diseases (asthma, chronic obstructive pulmonary disease (COPD)) with lower systemic exposure and consequently, reduced side effects. Yet again, it is also an advantageous route for systemic drug delivery since it shows a high solute permeability, due to its very thin absorption membrane (0.1-0.2 μm), to its elevated blood flow (5L/min) and to the highly vascularized alveolar epithelium constituted by a single layer of cells, which offers a large absorptive surface (80–100 m2).
All this facilitates the distribution of the molecules throughout the body.2,3 It also has an easy
administration, shows early effects of drugs’ pharmacological actions and has no risk of drug decomposition.4 The absorption of macromolecules via the pulmonary route is rapid and facilitated by
the highly vascularized alveolar epithelium. Also, unlike the oral route, it is not subject to first pass metabolism which is especially important to macromolecules (i.e. peptides and proteins) that are easily degraded by enzymes.5
However, the short duration of drug action in the lung is considered a significant disadvantage of conventional inhalation therapy. Hence, the development of pulmonary controlled release formulations would be highly beneficial for patients suffering from lung diseases. Controlled drug release systems composed of polymeric materials with particular characteristics, such as biocompatibility and degradability, have been shown to improve the pharmacokinetic and pharmacodynamic profiles of encapsulated drugs in the lung.1,4
The use of dry powders as drug delivery systems has been increasingly considered as a treatment option, even though it brings out concerns related to respiratory tract anatomy, breathing pattern and particle size.6
2
1.1
Vaccines
Vaccine is an antigenic preparation used to establish immunity to a disease, which when administered to humans, provides protection against such disease by the activation of T and B cells.8 The future of
vaccines extend beyond the treatment of infectious diseases and it has been already used for cancer immunotherapy, being the first cancer vaccine licensed in 2010.9 Vaccines are responsible for a big
part of the death prevention associated with numerous infection diseases every year, even though there is still a huge amount of children morbidity due to vaccine-preventable diseases.10 This happens
because those children are mostly from developing countries, and vaccines nowadays are mainly delivered via a parenteral route, which is not the most appropriate to overcome this issue. Vaccines administered parenterally require expensive cold chain transport and trained personnel, and they can induce needle-stick injuries with possible transmission of viruses.11,12 To treat the infectious diseases that affect poor populations the vaccines should be simple, cheap, easy to produce and stable. This is all possible with pulmonary vaccination added to all the advantages for drug delivery already mentioned.13 Above that is the fact that the lungs have gained a lot of attention given that the
respiratory tract is the main entry of pathogens and also it has an extensive dendritic cell network lining the airway epithelium that facilitates a first line of defense for antigens.14 The ideal vaccine
formulation would be one delivered in a single dose, and it is known that microparticles efficiently act as immune system adjuvants by carrying antigenic materials and by depositing them in the bronchiolar region, so the exposure to the antigen can be increased.13,15 Even though it has already been proven
that the pulmonary delivery of antigens induces immunity, there are still no dry powder vaccines on the market and the major difficulty is the adaptation of the parenteral formulation for the lung safety and efficacy.12 Despite that, there are several known pulmonary vaccines already produced for such diseases as tuberculosis16, influenza11, measles17 and hepatitis B.18
1.2
Pulmonary Arterial Hypertension
Pulmonary Arterial Hypertension (PAH) is characterized by heavily proliferation and apoptosis resistance of vascular cells of the lung (smooth-muscle cells, fibroblasts and endothelial cells), reducing the area of small pulmonary arteries and stiffening large pulmonary arteries that have as a consequence the increase of pulmonary vascular resistance and artery pressure.19 This condition is
normally associated with connective-tissue diseases, congenital heart disease, protopulmonary disease and HIV. Its cause is not always sure, it can occur either due to genetic mutations in the bone morphogenetic protein type II receptor (BMPR-II) that will affect the growth-suppressive effect of the bone morphogenetic protein (BMP) or even because of environmental factors (drugs, toxins, viruses).19,20 The diminishing production of endothelial nitric oxide and the increase of the
3 vasodilator and antiproliferative pathway in the pulmonary circulation, PDE5 is responsible for its hydrolysis. Without cGMP the levels of intracellular calcium and potassium rise and lead to vasoconstriction, proliferation of smooth-muscle cells and resistance to apoptosis.21
PAH treatments normally use diuretics, anticoagulation, vasodilative or antiproliferative agents. Sildenafil ( Figure 1.1(a)), a PDE5 inhibitor used for the treatment of erectile dysfunction, is one of the most used therapeutic options that promotes apoptosis, reduces hyperoxia-induced lung injury, and augments pulmonary capillary density. The local delivery of sildenafil using the inhalation route allows for a reduction of drug exposure and shows more effectiveness than other routes thanks to the well-ventilated parts of the lung.22,23
To deliver sildenafil to the lung, it should be encapsulated using a carrier in order to maintain its stability and also to have a controlled release.4 Dendrimers are synthetic polymers with a well-defined
hyperbranched three-dimensional structure constituted by several layers as represented in Figure 1.1(b). Being able to have a nanoscale size, they are excellent carriers to use in a wide range of medical applications. They have been mainly used to deliver DNA drugs into the cell through the lung, but their use has been enlarged to other type of treatments.24,25 One example is the Polyurea (PURE)
dendrimers that are biocompatible, biodegradable and “green” dendrimers whose fluorescence is very valiable for cell imaging or biosensing.26
The use of nanoparticles as drug release systems has been considered because of their ability to protect drugs at both extracellular and intracellular levels and then release them in a sustained and controlled manner, and especially for the fact that they are still able to penetrate into deep tissue and then suffer cellular uptake. However, nanoparticles are not in between the optimal particle size for inhalation
(1-5μm) and are easily exhaled, so to improve both their aerodynamic properties and stability, they can
be microencapsulated using an excipient.27
4
1.3
Dry Powder Inhalers
For it to be a good delivery device, an inhaler should generate an aerosol of a suitable size (1-5 μm) with a reproducible drug dosing that makes sure the drug chemical stability and activity are intact. Also, this device should be simple, easy to use, inexpensive and portable.3 Taking these characteristics
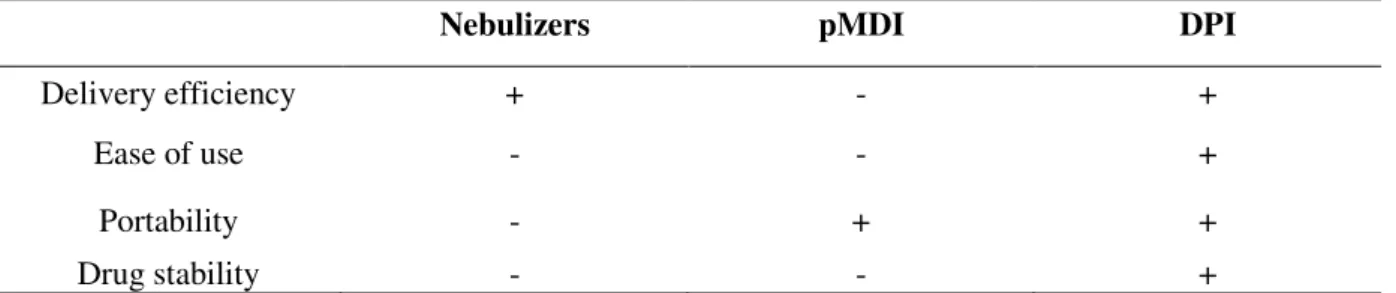
into account, Table 1.1 represents a comparison between the three existing inhalers.
Table 1.1 – Comparison between the different inhalers relatively to different characteristics.
Nebulizers pMDI DPI
Delivery efficiency + - +
Ease of use - - +
Portability - + +
Drug stability - - +
The first inhalers to be developed and to appear on the market were the nebulizers, in which the drug is dissolved in a polar liquid. However they showed some disadvantages such as low efficiency and reproducibility, the required time to the administration was about 30 minutes and their use was confined to hospitals or home, given that they were not portable.2,3
To surpass these issues, the pressurized metered dose inhalers (pMDIs) were developed since they show greater efficiency and reproducibility, they are faster to use and also portable. Despite that, they also show some drawbacks since they require the use of compressed volatile liquids as propellants (i.e. chlorofluorocarbon), making them environmentally unfriendly, and because they deliver the dose at high velocity it facilitates the deposition in the oropharynx.28
In order to overpass these problems, the inhalers were improved, and dry powder inhalers (DPIs) appeared (Figure 1.2). Besides being easy to use and portable, they are also propellant-free, making them environmentally friendly. Also, since the aerosols are in a dry state they assure the stability of the drug, needing no special condition storage and distribution.29 As for the delivery of vaccines these
devices are very suitable once macromolecules (polysaccharides, proteins and peptides) tend to degrade when in a liquid solution and so are provided with a greater stability. That was proven by the production of a dry powder influenza vaccine by spray-freeze drying that showed an increase of the systemic and mucosal humoral and cell-mediated immune response in mice when compared with liquid vaccines.11
However, they are expensive, complex to develop and the uniformity of the doses depends on the patient’s inspiratory flow because that is what set the particles in motion, provoking turbulence and shear in order to generate the aerosol. The particles then enter the patients airways and are carried to the deep lung.30 These devices are divided in “single-dose” DPIs, which use a single dose capsule, in
“multiple unit dose” DPIs, which contains small doses separated in several capsules or blisters and in
5 Figure 1.2 - Schematic representation of (a) a person using an inhaler 32 and (b)an example of a dry powder
inhaler.33
1.4
Characterization of inhaled particles
In order to understand where particles with different size deposit in the respiratory tract, the aerodynamic diameter (da) it has to be taken into account and is defined by the equation (1)
(1)
Where ρ is the mass density of the particle, is the unit density and the particle dynamic shape
factor.2
Though some conflicts regarding the range for optimal da to efficiently reach the deep lungs may exist,
the most recent works states that the aerodynamic diameter of aerosol particles should be between 1 and 5 µm since these size range is the one that gets to the deep lungs (Figure 1.3). While smaller particles may fail to deposit and are exhaled, bigger ones may accumulate in the mouth and throat by inertial impaction. The particles in between should deposit in the deep lung by inertial impaction and sedimentation.34–36
Moreover, smaller particles are more likely phagocytized and have the tendency to aggregate due to van der Waals and electrostatic forces37, making large porous particles with low density suitable for
lung delivery.38Large porous particles have a mean diameter bigger than 5 μm and an associated low
6 Figure 1.3 - Representation of the different stages of the respiractory tract and the particles’ deposition
according to size. Adapted from Ungaro F. et al.39
The mass median aerodynamic diameter (MMAD) is the particle diameter that can be obtained with the use of an in vitro aerosolization study such as a multistage cascade impactor, and it corresponds to
50% of the cumulative distribution. With the same apparatus it is possible to calculate the fine particle fraction (FPF) that is the mass of particles under a cut-off diameter of around 5 μm and with the use of a dosage unit sampling apparatus (DUSA) the shot weight can be determined, which is the proportion of powder that exits the capsule.40
In regards to inhaler products’ testing, the Andersen cascade impactor (ACI) and the next generation
impactor (NGI) are the recommended by both the European and US pharmacopeia, since the airflow and differential pressure over the inhaler are easily controlled.41,42 ACI is a sizing sampler containing 8
aluminium stages, each with a collection plate and a filter, and an induction port with a suitable mouth piece adapter. At times a pre-separator is used to collect large masses of non-respirable powders. The air flow rate should provide a pressure drop of 4 KPa with a defined time that allows the passage of 4 liters of air through the ACI. The inhaled aerosol will be fractionated into different stages that have a decrease in the nozzles’ diameter throughout the apparatus as represented in Figure 1.4. The particles deposition on each collection plate will depend on their size and density, and subsequently their inertia, being the particles with larger da collected in the early stages and the smaller ones on the
7 Figure 1.4 - Representation of the Andersen cascade impactor as well as its different stages and respective
cut-off diameters at 60 L/min, adapted from Mitchell, J. P. et al.44
In order to provide a sustained controlled release, drug-polymer systems were produced and because of that the release of the drug is dependent not only in the diffusion rate from the non-degraded polymer, but also by its swelling and erosion.
By modeling the drug release using mathematical equations, important information regarding mass transport and chemical processes relatively to the drug delivery system can be acquired, coupled with the effect of the parameters, for instance particle geometry or drug loading.45
When it comes to model the drug release out of polymeric matrices, the Korsmeyer-Peppas equation (2) has been the most used one, even though it stands on a simple method to study only the importance of the diffusional exponent, n, which indicates the transport mechanism. The mechanism can either be due to the Fickian diffusional release (n=0.43) or polymer’s swelling (n=0.85). It also considers a k
that is a constant incorporating characteristics of the macromolecular network system of the drug.46 However, it is only valid to the first 60% of the release, because the further release is dependent on other factors that are not taken into account, such as particles degradation.
= k (2)
8 = + (3)
The m is equally a Fickian diffusion exponent and equals n when the relaxation mechanism is not present while both Kd and Kr are constants. Using this model all the 100% of the drug can be
acknowledged.
Another important characteristic of the pharmaceuticals is its solid-state chemistry, in view of the fact that the existing polymorphism of the particles will have an influence on the stability of the drug and on the flowability as well. For lung delivery particles, the carrier should be amorphous because it brings out increased dissolution rates, higher water adsorption and also it is crucial for storage purposes while the API is preferably crystalline so the bioavailability is maintained. Nonetheless, and contrarily to crystalline forms, amorphous compounds are defined by a disorder arrangement of its molecules, showing less stability and more reactivity.30,48 For that, it is important to access to a
particle engineering process where these characteristics can be controlled. The most used technique to evaluate the solid-state is the X-ray Diffraction (XRD), which is based on the long-range order present, defining the intermolecular spacing of the unit cell and giving subsequently the crystalline system.49
In order to better understand a process and to reach full efficiency, knowledge at a theoretical level is advantageous, especially with the application of a statistical method like design of experiment (DoE). DoE is useful to obtain precise data and information of a process without the need of a large amount of experiments and associated costs. For instance, using a fractional factorial design it is possible to test parameters based on the obtained results and perform a screening. On the other hand, by performing a full factorial design the variables interaction can be studied. This kind of study is performed by an analysis of variance (ANOVA), which is going to test whether the difference between groups’ means are significant or not by comparing variances of the distributions. Basically, the variances are tested for statistical significance, and if significant the null hypotheses (all the groups are considered the same) is rejected and it is possible to admit that the means are different from each other.50
1.5
Poly (lactic-co-glycolic acid)
Poly (lactic-co-glycolic acid) (PLGA) (Figure 1.5) is used as a biodegradable slow-release polymer, it is physically strong, highly biocompatible and bioabsorbable and also allows an effective encapsulation of all kinds of drugs, proteins and various other macromolecules such as DNA, RNA and peptides.51,52 Additionally, it was approved by the FDA (Food and Drug Administration) for drug
9 research for release of therapeutic proteins and it is the most popular among the various available biodegradable polymers because of its long clinical experience, favorable degradation characteristics, bioadhesive properties and possibilities for sustained drug delivery.51,53
Figure 1.5 -PLGA structure, with the lactic acid between the left-side brackets and the glycolic acid between the
right-side brackets. x and y represent the number of times the unit it repeated.
A main influence on the release is the polymer biodegradation. PLGA’s ester backbone undergoes hydrolysis in aqueous environments, such as body fluids, and the polymer eventually degrades to lactic and glycolic acid monomers with well-established compatibility and safety profile since the products are nontoxic, noncarcinogenic, and nonteratogenic.54–56 Lactic acid is converted to pyruvate,
which is degraded in the Krebs cycle via acetylating of coenzyme A, and carbon dioxide, which is mainly eliminated by respiration. Part of the glycolate is excreted directly via the urine while another part is oxidized to glyoxylate, which is converted to glycine, serine and pyruvate.53
The presence of a drug may change the mechanism from bulk erosion to surface degradation. In general, the PLGA degradation and the drug release rate can be accelerated by greater hydrophilicity, increase in chemical interactions among the hydrolytic groups, less crystallinity and larger volume to surface ratio of the particles. In spite of that, higher content of glycolic acid leads to quicker rates of degradation with an exception of 50:50 ratio of PLA/PGA, which exhibits the fastest degradation.51
The Tg (glass transition temperature) of the PLGA copolymers are reported to be above the
physiological temperature of 37 ºC and hence are glassy in nature, exhibiting fairly rigid chain structure. It is known that the Tg decrease with a decrease of lactide content in the copolymer
composition and with a decrease in molecular weight.51 The glass transition temperature for 50:50
ratio is between 45 and 50ºC. 55
As for the risk of inflammation in situ caused by the polymer, there is some discrepancy in the
literature as to whether that is true or not. Some groups suggest PLGA particles are inflammatory in vitro and in vivo57, whereas others have not found this to be the case.58,59 The discrepancy between
these findings may be due to differences in particle fabrication or experimental settings. However, given the long clinical history of PLGA and the broad literature reporting PLGA particle uses for biomedical applications, it seems unlikely that particles derived from PLGA would trigger potent inflammatory responses.58
10 globular proteins must remain encapsulated at the physiological temperature, and in the dry powder state the retention of their structural integrity and biological activity is successful.8 Moreover, the
majority of proteins and peptides are hydrophilic and any attempt to load them into hydrophobic PLGA becomes a challenging task, because most methods developed often require the use of aqueous media.8
For vaccination purposes, antigen is mostly formulated in PLGA microparticles that are ingested by phagocytic cells following administration, resulting in particle degradation and antigen presentation.52
Also, the use of this polymer allows the possibility of the development of a single-dose vaccine due to the controlled particle degradation to several weeks.13
1.6
Bulking Agents
In order to obtain particles with the ideal characteristics for lung delivery it is sometimes required the use of bulking agents and dispersibility enhancers. Ideally, bulking agents will cover the particles during their formation, keeping them from agglomerating in the drying process and also during the storage60, hence decreasing the bulk density and increasing the dispersibility.61 One the most used in
the literature is L-Leucine (Figure 1.6 (a)), a nontoxic and nonirritant amino acid, known to improve flowability and dispersibility.62 It was proved that the addition of leucine improved FPF given that it
reduced the cohesiveness and coalescence of the particles.37
Another option is the use of cholesterol (Figure 1.6 (b)), a neutral lipid that because of its hydrophobic nature reduces the absorption of the ubiquitous vapor leading to a reduction in the aggregation and the adhesion of particles. Besides, it is biocompatible and it is easily metabolized, being cleared out by direct absorption by either epithelial cells or by macrophage uptake.63
11
1.7
Particle Production
There are several known methods to produce particles for inhalation and those can be divided into two groups: the top-down (large particles are mechanically broken down to smaller ones) and the bottom-up (particles are formed from the molecular level).
Milling is based on a top down approach since it consists on the grinding of bulk crystallized particles into small ones with the use of mechanical forces such as pressure, friction, attrition, impact or shear.25
In order to produce particles for inhalation, there are three types of mills that can be used, fluid-energy mills (jet-milling), high-peripheral-speed mills (pin-mill) and ball mills. The most used technique is jet-milling where high-pressure nitrogen is used to provide a sonic velocity to solid particles, which makes them collide and fracture into particle down to 1μm. Even though it is considered a traditional particle production technique with a low cost associated, it is inadequate when it comes to particle production since the control of size distribution is limited.64 Also the process might change the
physicochemical properties of the material, turning the surface of fractured crystals amorphous.31
The bottom-up processes tend to be more sophisticated and complex, and produce particles with a better control of its characteristics. In this case, the manufacturing methods involve the use of an antisolvent or are based on solvent evaporation as is spray-drying, the most used and studied solvent evaporation technique.65 Spray drying is very rapid, convenient and has very few processing
parameters, making it suitable for industrial scalable processing and it also provides stability and biological activity for the API. In this process, drug/protein/peptide loaded microspheres are prepared by the means of an atomization of the feed solution into a spray, which later enters in contact with heated air in a drying chamber forming a dry powder. The nature of solvent used, temperature of the solvent evaporation and feed rate affect the morphology of the microspheres. The disadvantages of this process is the adhesion of the microparticles to the inner walls of the spray-dryer, turning the yields insufficient, and the possible degradation of heat-sensitive drugs.66,67
1.8
Supercritical Fluid Technology
More recently, alternative particle production methods using supercritical fluids, especially supercritical CO2 (scCO2), have been proposed to overcome some limitations. Conventional methods
usually require large amounts of organic solvents and thus require additional extensive purification steps to remove the residual solvent. When it comes to using scCO2, organic solvents can be
minimized or eliminated easily, since scCO2 has a high affinity for them which enables their removal.
A rapid expansion of the CO2 using a pressure drop leads to the clustering of CO2 molecules inside
the liquid polymer, expanding it and inducing pore formation, making the system suitable for drug deliver.5,51 Moreover, the morphology and porosity can be easily altered by changing operation
12 Supercritical Fluids (SF) are gases or liquids that are above their critical temperature and pressure, and that present characteristics of both states. In one hand they have the density of a liquid, which shows advantageous solvation power, while in the other hand they have the viscosity of a gas with an associated high diffusivity. Since these aspects are very changeable near the critical point, it is easy to control both of them by a slight change in pressure/temperature.69 Also, near the critical point the
compressibility and the heat capacity are much higher than in other conditions.
Carbon dioxide is the most used gas as a SF, since it is nontoxic, nonflammable, inexpensive and readily available in high purity from a variety of sources. Because it is a gas at normal pressure by simply reducing the pressure of the system, it is possible to easily separate the solvent and residues from the polymer, leading to highly pure materials.70,71 Besides, it has a low critical point (31.1oC/73.8
bar)(Figure 1.7), which is suitable to use with heat-sensitive materials and can reduce manufacturing complexity and energy.72
Figure 1.7 - Phase diagram of CO2 adapted from Leitner W. et al.73
There are several particle production techniques that use supercritical fluids, such as supercritical fluid extraction where particles are produced when a solution is brought into contact with scCO2 in a
semi-continuous method74,75, rapid expansion of supercritical solutions (RESS) where the solid material is
dissolved in scCO2 and the solution is expanded by depressurization, leading to a fast decrease of
temperature that will induce supersaturation and consequently microparticle formation48,76 and
particles from gas saturated solutions (PGSS)77,78 that consists in two steps: the saturation of a solution
with CO2and the mixture’s expansion through a nozzle into a spray tower.
1.9
Supercritical Assisted Atomization
13 SAA is based on the solubility of controlled quantities of scCO2 in a liquid solution containing the
drug and excipient. The mixing happens in a heated saturator with a large contacting surface, assuring a high residence time and a near-equilibrium solubilization of the CO2. The gaseous properties of
scCO2 allow it to diffuse into the amorphous regions of polymers where it enters into the free volume
between the individual chains. The chain separation increases, enhancing the mobility as a result and inducing a proper mixing. This lowers the Tg of amorphous polymers, enabling them to be liquefied
and since it is reversible, the Tg returns to the original value upon the complete removal of the scCO2.
The solution is atomized through a nozzle (thin-wall injector) into a precipitator in the form of a spray. The CO2 works as a cosolute, since it dissolves itself in the liquid solution and it also works as a
pneumatic agent, atomizing the solution in fine droplets (pneumatic atomization). After that there is a second atomization due to the CO2 expansion existing in the fine droplets interior (decompressive
atomization) (Figure 1.8).56,81
Figure 1.8 - Representation of SAA’s double atomization: pneumatic atomization (left-side) and decompressive
atomization (right side), adapted from Porta, G. Della et al.81
One important factor to keep in mind is the full solubilization of the scCO2 in the liquid solution, and
that is going to depend on such factors as the pressure and temperature because those are related to the high–pressure vapor liquid equilibria (VLE). Moreover, the presence of the solute might also induce some modifications and that has to be taken into account because in order to have a successful atomization a single-phase should be formed in the saturator.82,81 Nonetheless, when one is working
with a complicated ternary mixture it is known that by using high pressure and temperature, it becomes easier to avoid a two-phase behavior.83 Another problem is the use of aqueous solutions due to the low solubilization of CO2 in water, but that can be resolved with the use of an organic solvent
15
2.
Experimental Section
2.1 Materials
Poly(D-L-lactide-co-glycolide) (PLGA, PURASORB® PDLG 5002A, molar ratio: 50/50, inherent viscosity 0.21dl/g) was purchased from PURAC (Gorinchem, Netherlands). Bovine Serum Albumin (BSA, Mw 60 kDa), L-Leucine (>98%), cholesterol (94%), acetone (99.8%) and acetonitrile were obtained from Sigma-Aldrich. Ethanol (96%) was purchased in Panreac. The sildenafil-loaded dendrimers were developed in the host laboratory1. Industrial carbon dioxide (purity ≥ 99.93%) was
obtained from Air Liquide.
2.2 Microparticles Preparation
2.2.1 BSA-Loaded Microparticles
A solution of 0.47% (w/v) PLGA, 0.09% (w/v) BSA and 0.02% (w/v) L-Leucine was prepared with 83% (v/v) acetonitrile and 16% (v/v) distilled water. While the PLGA was dissolved in part of the acetonitrile, both the BSA and Leucine were dissolved in water. After full dissolution the aqueous solution was added to the PLGA solution under stirring, with the rest of the acetonitrile added in the end.
2.2.2 SDF-Loaded Dendrimers Encapsulated in Microparticles
A solution of 0.28% (w/v) PLGA, 0.19% (w/v) cholesterol and 0.14% (w/v) sildenafil-loaded dendrimers was prepared with 42.3% (v/v) acetonitrile and 39.5% (v/v) acetone and 18.3% (v/v) ethanol. The PLGA was previously dissolved in acetonitrile, the cholesterol in acetone and the sildenafil-loaded dendrimers in ethanol.
2.2.3 SAA Apparatus
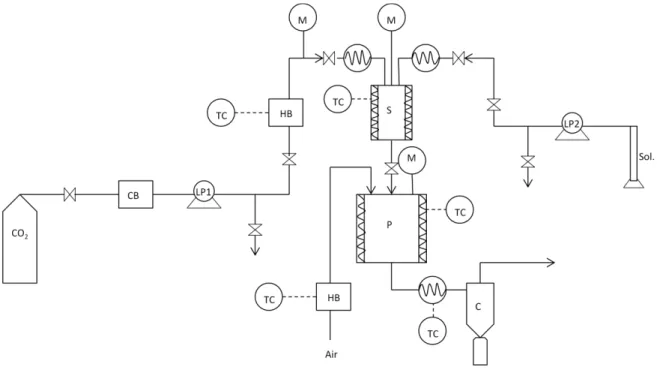
The laboratory scale SAA apparatus, represented in Figure 2.1 consists of two high-pressure pumps to deliver the liquid solution (HPLC pump 305 Gilson) and the CO2 (HPLC pump K-501, Knauer) to the
static mixer. Since the CO2 pump is suitable for liquid solutions, there is a need to liquefy the CO2 in a
cryogenic bath. Before entering the static mixer the CO2 is heated in an oil bath. The static mixer (3/16
model 37-03-075 Chemieer) is a high-pressure vessel with a 4.8 mm diameter, 191 mm length and 27 helical mixing elements that allows the solubilization of the CO2 into the liquid solution due to its
high surface packing. In order to control the temperature of the mixture, the static mixer is enrolled by heating tapes controlled by a shinko FCS-13A temperature controller (0.2oC resolution). The obtained
16 Setra pressure indicator (0.1 psig stability). To indicate the pressure of the precipitator an EROELECTRONIC LDS controller (0.1oC stability) is connected to the top of it. After the precipitator
there is a heating tape set to make sure the flow remains at high temperatures, thus avoiding heat losses and consequent solvent condensation, connected to an Isopad TD 2000 heat controller (0.1oC
stability). The particles will then be collected from a filter (FSI, nylon mono-filament, 1 μm) which is placed in a cyclone that helps with the separation between the particles and the CO2-solvent flow.
Figure 2.1 – Schematic representation of the SAA apparatus: (CB) cryogenic bath; (LP) liquid pump; (HB)
heating bath; (TC) temperatute controller; (M) manometer; (S) saturator; (P) precipitator; (c) cyclone.
2.3 Microparticles Characterization
2.3.1 Particle size distribution
The particle size (PS) and the particle size distribution (PSD) were measured by a Morphologi G3 essentials, a particle analyzer system. In each particle size calculation around 30000 particles were considered. Also the span was calculated, a measure of the width of particle distribution, and it considers the dv,10, dv,50 and dv,90 (particle diameter in volume corresponding to 10, 50 and 90% of the
population) as represented in equation 4:
Span=
(4)
2.3.2 Particles morphology
17 magnifications of 5K and 10K. All the samples were dispersed on carbon tape previously attached to an aluminum stub and were coated with gold before analysis.
2.3.3 Bulk density
Once inside the calibrated cell the powder was maintained 24 h under vacuum to totally dry and degas the sample. The cell was then installed into the adsorption apparatus from the adsorption laboratory (Faculty of Sciences, University of Lisbon). Bulk density of the microparticles was determined by measuring the pressure change of helium in a calibrated volume.
2.3.4 Differential scanning calorimetry (DSC)
The differential scanning calorimetry patterns were obtained by treating the samples in a differential scanning calorimeter PerkinElmer DSC 7. The samples (10-30 mg) were placed in a holder where the temperature was raised from 25oC to 300oC in a heating rate of 10oC/min in nitrogen.
2.3.5 X-ray diffraction
X-ray diffraction patterns were obtained by treating the samples in a RIGAKU X-ray diffractometer, model Miniflex II. Samples were placed in a holder and analyzed through CuKα radiation (3 KV/15 mA), with a 2θ angle ranging between 2o and 55o with a scan rate of 1o/min.
2.3.6 Fourier Transform Infra Red (FT-IR)
FT-IR spectra were carried out on a PerkinElmer spectrum 1000 FTIR coupled with Opus Spectroscopy Software with potassium bromide (KBr) tablets containing 20% sample.
2.3.7 Water Content Determination
Karl Fischer coulometric titration was used for the determination of water content on the samples. An aliquot of the samples was transferred into the titration vessel and titrated with Karl Fischer reagent, which reacts quantitatively and selectively with water. The instrument was composed by the 831 KF
Coulometer and a 728 stirrer both from Metrohm and by a Pt /-20…70 ºC electrode.
2.3.8 Drug Loading and Encapsulation Efficiency
The drug encapsulation was determined by milling a fixed amount of powder and then adding a known amount of PBS. The solution was under stirring for 2 h and then was centrifuged at 15000 rpm for 5 min. The supernatant was collected and the amount of drug was obtained by UV spectroscopy. The percentage of encapsulation was calculated from the obtained mass (mr) and the initial mass (mi) as
represented in equation 5.
18
2.3.9 Aerodynamic Properties
2.3.9.1 Emitted Fraction
To determine the shot weight, which is the amount of powder that is released from the capsules, the Dosage Unit Sampling Apparatus (DUSA) is used. The air is drawn by a High Controller Pump model HCP5 (Copley) that simulates inhalation and air flow was regulated in a Critical Flow Controller model TPK (Copley) until the P1 pressure achieves the 4kPa. The air flow (Qair) was measured with a
flow meter model DFM3 (Copley) in order to calculate the run time of each capsule using the equation 6:
t(s)=
x 60 (s/min) (6)
Also, there is a need to ensure that P3/P2 ≤ 0.5 in order to guarantee the critical flow.
The assay consists on the release of 4 capsules (HPMC capsules nº3 Aerovaus) with 30±2 mg of powder each from a dry powder inhaler (Plastique 60LPM – Mode 7) and it is performed in triplicate as reported in the European Pharmacopeia.41
The emitted fraction (%) uses the weights (mg) of the capsule before and after the assay (mfull and
mempty respectively) as represented in equation 7:
EF(%)=
x 100% (7)
2.3.9.2 Andersen Cascade Impactor
The aerodynamic properties of fine particles were carried out using an aluminum Andersen Cascade Impactor apparatus (ACI)(Copley) (Figure 2.2). The assay is performed with the same instruments as the emitted fraction test, being the capsules prepared equally and the run time calculated using the same European Pharmacopeia protocol.41
19 Figure 2.2 -Experimental set-up to perform ACI (adapted from European Pharmacopeia)41.
The fine particle fraction (FPF) was determined by the interpolation of the percentage of the particles
containing less than 5 μm. The Mass Median Aerodynamic Diameter (MMAD) was determined as the
particle diameter corresponding to 50% of the cumulative distribution. The Geometric Standard Deviation (GSD) was determined using the values of d84 and d16, which represent the diameters of
84% and 16% of the cumulative distribution as in equation 8:
GSD= (8) 2.3.10 Pharmacokinetic Studies
2.3.10.1 BSA-Loaded Particles
The in vitro release studies were carried out in phosphate-buffered saline at pH 7.4 (PBS). 60±2 mg of
sample was introduced in a cellulose ester dialysis membrane (MWCO 100,000, 24 mm x 15 feet dry diameter, 1.8 mL/cm, Spectrum Labs) that was suspended in 5 mL of PBS. Samples of 0.5 mL were taken at predetermined time points and other 0.5 mL of PBS were added to the suspension and the samples.
2.3.10.2 Dendrimer-Loaded Particles
The in vitro release studies were carried out in phosphate-buffered saline at pH 7.4 (PBS). 20±2 mg of
20 The drug concentration was obtained by UV-visible spectroscopy and the drug-release profiles (%) were represented as a function of time.
The release profiles were modulated using Korsmeyer-Peppas (2) and Peppas and Sahlin (3) equations.
2.3.11 Biodegradability Assays
Biodegradation of microparticles was carried out in the presence of 0.2 mg/mL of lysozyme dissolved
in PBS 10 mM at 37 oC. 2 mg of microparticles were incubated with 1 mL of lysozyme solution under
horizontal agitation at 50 rpm. The enzymatic degradation medium was changed every 48 h to restore the original level of enzymatic activity. The solution was centrifuged at 13500 rpm for 7 min and the supernatant removed. Then the particles were lyophilized and weighed and the process repeated. The biodegradation rate is represented as a percentage of the remained weight (Wr) and it is calculated with
the use of equation 9 where W0 and the Wfare the initial and final particles’ weight, respectively:
Wr(%)= 100 - x 100 (9)
2.3.12 Biocompatibility Assays
In vitro cytotoxicity assays were performed for each cell line available and for each compound mentioned above, through the use of
purity ≥ 99.93%
CellTiter 96® AQueous Non-Radioactive Cell Proliferation Assay (Promega, Madison, USA), a colorimetric method for determining the number of viable cells.At 80 % confluence, cells were harvested and centrifuged. The supernatant was discarded, and the cell pellet resuspended in 2 mL of medium. For growth inhibition assays, 0.75*105 cells/mL were plated
into flat bottomed 96-well plates (Costar, Corning, NY) and incubated at 37 ºC, 99 % humidity and 5 % CO2 (v/v). Cell density was evaluated as the total number of viable cells within the grids on the
hemacytometer (Hirschmann, Eberstadt, Germany) using trypan blue exclusion method. For this procedure 350 µL of medium was pipetted to a 2 mL eppendorf together with 50 µL of the 2mL cell suspension followed by 100 µL of 0.4 % (v/v) trypan blue solution (Sigma). The hemacytometer was loaded and examined immediately under the microscope at low resolution, and cell viability was determined through the equation 10.
(10)
(3-(4,5-dimethylthiazol-2-yl)-5-21 (3-carboxymethoxyphenyl)-2-(4-sulfophenyl)-2H-tetrazolium, inner salt), and PMS (phenazine methosulfate) in a ratio of 100:19:1 was added to each well and further incubated for 45 min. During this period, MTS is bioreduced into formazan, by dehydrogenase enzymes present in metabolically active cells, which in turn is susceptible of being measured at 490 nm absorbance by Tecan Infinite F200 Microplate Reader (Tecan, Männedorf, Switzerland), directly from the 96-well assay plate, so that the quantity of formazan product measured is directly proportional to the number of living cells in culture. The cell viability results for each concentration assayed were normalized relative to the control samples and obtained accordingly to equation 11:
(11)
Before testing the powders, the drug was tested by itself at different concentrations (10, 50, 100 and 250 nM) and duration (24 and 48 hours). The assays were performed in duplicate.
2.3.13 Design of Experiment (DoE)
To understand the effect of some of the formulation variables on the particles size, a design of experiment (DoE) approach was adopted using STATISTICATM software version 10 (Statsoft, Bell,
Tulsa, Oklahoma). In this case the absence or presence of both L-leucine and BSA was tested, which means that 22 experiments were taken into account. All the experiments were made in triplicate and the
23
3.
Results and Discussion
To study the production of microparticles for vaccine pulmonary delivery, while BSA was chosen as the model protein, since it has already been extensively studied and it also is safer to work with than an actual antigen; L-leucine was chosen as the bulking agent. While BSA and L-leucine are soluble in water, PLGA is not. The chosen organic solvent to dissolve PLGA was acetonitrile, since it was one of the few miscible in water and it also was the “greener” option. The quantity of water in the solution was diminished to a minimum, since CO2 is partially soluble in it; therefore, the concentrations of
BSA/L-Leucine used in the formulation were on their limit of solubility, as well as PLGA’s.
Meanwhile, to treat pulmonary hypertension, neither the dendrimers nor the cholesterol, the chosen bulking agent, required the use of an aqueous solution, and ethanol and acetone were chosen to dissolve them respectively.
3.1
PLGA microparticles
Even though PLGA has been used as a carrier for pulmonary delivery in several research papers, there is no literature of it being micronized by SAA. Therefore, the first step of the process was to optimize the PLGA microparticles until the best operating conditions were found.
The temperature was a very important parameter to control due to the low Tg PLGA presents (45-50
ºC). When the mixture occurs in the static mixer, the temperature needs to be below this value, but yet, it has to be above the CO2’s critical temperature (31.1 ºC) and so 40 ºC was used as the set point,
while the CO2 was heated at 50 ºC. Other problem associated with the temperature was the efficient
drying of the particles in the precipitator because the acetonitrile and water’s boiling temperature (82 ºC and 100 ºC respectively) is much higher than the PLGA Tg. It was found that the best temperature
to be used in the precipitator was around 70 ºC with compressed air entering at nearly 100 ºC. Temperatures below that led to wet particles, while temperatures much higher led to formation of melted particles. In order to maintain a heated flow until it reaches the cyclone, a heating tape was placed right after the precipitator.
As for the pressure, throughout the assays three different pressures were tested. At first a pressure of 10 MPa was used, and since the particles still required to be optimized, a higher pressure was tested but no differences were noticed. At last, a lower pressure was used (9 MPa) and there was a slight improvement in the particles characteristics, such as their size and morphology.
The gas to liquid ratio was calculated taking into account the volumetric flows and was varied between 5 and 1.55 but since there was a slight improvement with the higher ratio, the assays proceeded with it. Other experimented option was the heating of the cyclone. This would ideally make sure that the solvent remained evaporated and the particles were dried. Instead it turned the particles more plasticized due to the polymer’s Tg and to the fact that the particles were in contact with the heated
24 Besides obtaining suitable particles’ characteristics, another problem was the yield of the assays. They started out very low (5-10%), but with the optimization of the parameters they started to increase until they reached almost the 30%. Initially, two filters were used in the cyclone to improve the amount of powder collected, however because the PLGA particles are so small with sizes around the filter’s pore diameter, they often obstructed the filter resulting in a fast pressure increase. The only way to perform an assay without the rise of pressure was to use a single filter inside the cyclone, which as a drawback, increased the amount of lost particles that left with the gaseous flow.
Table 3.1 shows some of the assays performed only with PLGA that showed major differences in yield and morphology.
Table 3.1- Operating parameters of some of the PLGA assays and the respective yields.
Assay Yield (%) Tsat
(oC)
Tprec (oC)
Tpre-cyc (oC)
TCO2 (oC)
Tair (oC)
Pressure
(MPa) QCO2/Qsol Ratio a
1 10 n.a. 65 n.a. 180 180 10 5
2 23.6 45 n.a. 35 100 180 10 1.55
3 27.9 45 50 35 100 180 10 1.55
4 14.9 40 70 50 50 100 9 5
Tsat – Temperature of the saturator; Tprec – Temperature of the precipitator; Tcyc Temperature of the the pre-cyclone; TCO2 – Temperature of the carbon dioxide; Tair – Temperature of the compressed air; n.a. – not available. a
QCO2/Qsol ratio was obtained considering volumetric flows
3.1.1 Morphology
Although the first particles obtained were characterized for having geometric diameters much bigger than expected, their numeric diameters were smaller, and this can be explained by the existence of big agglomerates that even though were few in number, were large enough to make the geometric diameter increase to such high values, represented in Table 3.2. The first two assays showed agglomerates so large that only the 10x objective of Morphologi G3 was able to do the analysis, and which was probably not being capable of counting the smaller particles. When the most appropriate conditions were found, the agglomerates diminished from a diameter of around 200 μm to 10 μm. To calculate the particles aerodynamic diameter the bulk density has to be taken into account. Because the particles have a small bulk density, when using the Stokes equation (1) to determine the da, the
values decrease, even getting inside the appropriate range in the last assay.
Table 3.2 –Properties of PLGA microparticles
Assay Dv,50 (μm)
Dn,50 (μm) Span Bulk Density (g/mL) Da (μm)
1 203.7(10x) 7.26 0.80
0.19±0.01 88.8
3 193.9(10x) 6.38 1.35 84.5
4 11.25±3.4 5.17±0.30 0.66±0.40 4.9
25 Also to prove that the Dv50 is due to the presence of agglomerates SEM was performed and the results
are shown in Figure 3.1. As can be seen in the right side of the image (b) single particles do not have diameters much larger than 1μm. In the other hand, they do not seem spherical, but that is because when exposed to the electron beam of SEM, the particles tend to melt since they are heat-sensitive and lose their original form. Also by analyzing the images obtained by Morphologi G3 (Figure 3.2) it is possible to recognize the presence of agglomerates. The images (a;b) are from assay 3 particles and in (a) besides the expected particle aggregates there is also possible to see small single particles, while in (b) there is a confirmation that these big diameter particles are truly aggregates because their individual form is outlined. Comparing these to the images obtained in assay 4 the particle aggregates show a smaller size, and the presence of small particles is also confirmed.
26
0 10 20 30 40 50 60 70 80
Ma
ss
P
LGA
(%
)
Figure 3.2 -Morphologi G3 images of the PLGA microparticles (a;b) at assay 3 and (c;d) 4. (a;c) and (b;d) used
magnifications of 20,000 and 50,000 respectively.
3.1.2 Aerodynamic Performance
As already mentioned, the MMAD is also an important parameter when it comes to study particles suitable for inhalation purposes, and it is determined by the use of the ACI. The obtained result regarding the powders distribution is represented in Figure 3.3.
Figure 3.3- Graphical representation of the powder distribution in the ACI apparatus for the PLGA