AbstrAct: The production systems of upland rice culture in Mato Grosso are not consolidated yet while the effects of soil physical
properties and their correlation with rice yield in crop-livestock
integrated systems are not defined as well. Therefore, this study
determined the spatial variability of physical properties of soil and
rice cultivated in no-tillage system under different cover crops, using
principal components analysis and geostatistics. The experiment was
conducted in Santa Carmen, northern Mato Grosso. A regular grid with
100 sample points distributed in an area of 26,400 m² was installed.
soil And PlAnt nutrition -
Article
Variability of physical properties of soil and
rice grown under cover crops in crop-livestock
integrated system
Rodrigo Gonçalves Trevisan1, Onã da Silva Freddi2*, Flávio Jesus Wruck3, Renan Rimoldi Tavanti2,
Fernanda Salles Cunha Peres4
1. Universidade de São Paulo - Escola Superior de Agricultura “Luiz de Queiroz” - Departamento de Engenharia de Biossistemas - Piracicaba (SP), Brazil.
2. Universidade Federal de Mato Grosso - Instituto de Ciências Agrárias e Ambientais - Sinop (MT), Brazil. 3. Embrapa Agrossilvipastoril - Sinop (MT), Brazil.
4. Universidade do Estado de Mato Grosso - Cáceres (MT), Brazil.
*Corresponding author: [email protected]
Received: Dec. 2, 2015 – Accepted: Apr. 25, 2016
Soil and rice samples were collected to determine rice variables and
soil physical properties. The average rice yield was 1.70 Mg∙ha−1, ranging from 0.70 to 3.12 Mg∙ha−1. The highest yields were observed in consortium with cowpea and brachiaria and were associated with lower
incidence of grain spots, despite higher soil density and penetration
resistance. The consortium with brachiaria, crotalaria, and sudangrass
had lower yields, which was associated with higher incidence of grain
spots, despite higher soil macroporosity and total porosity.
introduction
The upland rice has been gradually inserted in the farming systems of Mato Grosso. To this end, the rice crops are being introduced as rotation crop in old systems or established areas, and not just cultivated in new or newly-open areas. Carvalho et al. (2011) reported that consortium with crops, such as corn, tall and with fast initial development, has already been elucidated in the literature and is technically feasible. However, there is little information on consortium with shorter crops such as rice, which is an interesting alternative to pasture recovery in crop-livestock system (CLS) (Carvalho et al. 2011).
In Brazil, integrated production systems are becoming increasingly popular due to the problems that arise from successive crops, such as soybeans and corn in no-tillage. The main problems are compaction and soil erosion, decreasing organic matter content and yield, resulting in higher production costs and degradation of natural resources, especially soil and water.
However, integrated production is considered more complex cultivation system that modifies the relationships between the factors that govern yield, especially regarding no-tillage, crop rotation, and phytosanitary control, with different results when compared to monoculture.
Surface soil compaction is among the constraints to upland rice cultivation under no-till system. Beutler et al. (2004) reported limitations for rice yield for values of bulk density and soil penetration resistance of 1.62 Mg∙m−3 and 1.82 MPa, respectively.
Another problem of the no-till system is crop residue management since all the straw is left on the soil, creating favorable conditions for the proliferation and survival of necrotrophic pathogens in crop debris, as many depend on these conditions to survive (Reis et al. 2011). Reis and Casa (2004) stated that crop diseases, such as wheat leaf stains, are more severe in the no-till system. All phytopathogens that survive as saprophytes in crop debris have their populations affected by no-tillage and crop rotation (Reis et al. 2011). Therefore, the integrated production systems need further understanding, especially alternative crops for rotation systems and the incidence of diseases.
To this end, the objective of this study was to determine the spatial distribution and correlation of soil physical
properties, the incidence of grain spots and rice cultivation parameters in no-till system under different cover crops, after 7 years of crop-livestock integration using, conjointly, principal component analysis and geostatistics.
MATERIAL AND METHODS
The experiment was conducted at Fazenda Dona Isabina, in Santa Carmen, northern Mato Grosso, located at lat 12°03′58″S and long 55°21′07″W, at 375 m average altitude. The region is in the transition area between the Cerrado and Amazon biomes. The climate is hot and humid tropical, Aw type, according to Koppen classification. The soil was classified as Red-Yellow Latosol (OXISOL), clayey, containing 342 g∙kg−1 sand,
123 g∙kg−1 silt, and 535 g∙kg−1 clay, with the following
chemical parameters in the 0 – 0.20 m layer: pH 5.7 in H2O;
6.6 mg∙dm−3 P; 58.65 mg∙dm−3 K; 2.17 cmolc∙dm−3 Ca;
1.10 Mg cmolc∙dm−3; 5.08 cmolc∙dm−3 H + Al; 38% base
saturation, and 32.7 g∙kg−1 organic matter.
The area was planted in the crop-livestock integrated system for 7 years. However, in recent years, the management adopted consisted of pasture crops in 2005/2006 and 2007/2008, followed by rice crop and second common bean crop in 2008/2009, early soybean crop and consortium between corn and brachiaria (Brachiaria ruziziensis) in the second harvest of 2009/2010. In the 2010/2011 agricultural year, early soy was cultivated as main crop. Subsequently, the area was divided into 3 subareas to plant cover crops, in 3 consortium treatments consisting of brachiaria (B. ruziziensis) with cowpea (Vigna unguiculata), T1; with crotalaria (Crotalaria ochroleuca), T2; and with sudangrass (Sorghum sudanense), T3.
The chemical management of cover crops was carried out on 11/10/2011, and the rice was sown 20 days later, on 12/01/2011. The rice cultivar BRS Monarca was sown spaced 0.225 m apart, perpendicular to the rows of cover crops. Fertilization consisted of applying 0.370 Mg∙ha−1 of 04-20-20 fertilizer at sowing and
2 topdressings, 0.060 Mg∙ha−1 of 20-00-20 fertilizer. The
Priori fungicide (0.3 L∙ha−1) was applied to control fungal
diseases on 01/15/2012. All other crop practices followed the technical recommendations for rice cultivation in rainfed conditions.
and Environmental Sciences of the Federal University of Mato Grosso (UFMT), Sinop campus. The precipitation values adapted to those observed in the experimental area (Figure 1). The potential crop evapotranspiration (ETC) was obtained by multiplying daily evaporation in
the class A tank by the crop coefficient (Kc) as described in Stone and Moreira (2005).
The data were collected using a rectangular grid (7 rows × 12 columns), containing 84 sample points, spaced 20 m from one another on both axes, covering a total area of 26,400 m2. Furthermore, additional
16 refinement points were placed in the center of the square formed by 4 adjacent points, aiming at a more detailed study of data spatial dependency using points spaced less than 20 m. Sampling and refinement points totaled 100 sampling points.
In each point of the mesh, 2 non-deformed samples were collected at the center of the 0 – 0.10 and 0.10 – 0.20 m layers, using volumetric rings, 0.05 m high and 0.05 m diameter.
At the laboratory, the samples were saturated by gradually raising the water level on a tray and then were subjected to the pressure of 60 hPa using a Sandbox. After water drainage stabilized, the samples were weighed to determine the water content, and soil penetration resistance (PR) was determined using a bench top
electronic penetrometer at a constant penetration speed of 10 mm∙min−1 and 30° cone. After determining the soil
resistance, the samples were dried at 105 °C for 24 h and reweighed. Macro and microporosity (MA/MI), total porosity (TP), and bulk density (BD) were determined as recommended by Embrapa (1997).
Non-deformed soil samples were collected in the 0 – 0.10 m layer to determine the stability of the aggregates in water. After air-drying, the samples were sieved to separate 8- to 4-mm aggregates. For the wet sieving process, three 30 g samples were used in each repetition, 2 to determine the aggregation and 1 for moisture. The samples were moistened by capillarity on a filter paper and then, using water jets, transferred to the sieve set with 4.0; 2.0; 1.0; 0.5; 0.25 and 0.125 mm mesh to separate the aggregates according to size classes. Then, the sieve set was placed on Yoder tank and subjected to vertical stirring for 15 min at 30 oscillations per minute. The aggregate index adopted was the mean weight diameter (MWD) and geometric mean diameter (GMD), according to Kemper and Rosenau (1986).
The following plant variables were determined: number of tillers (NT) and the number of fertile panicles (FP) in two 1-m rows at each point of the sample grid, reporting the data for a 1-m2 area. The grain yield (GY) was given
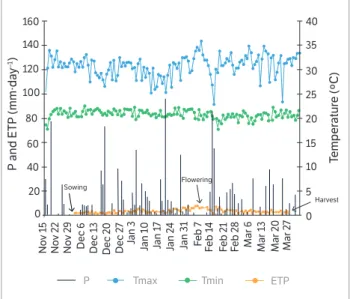
by the grain mass of two 3-m rows, near each sampling point, correcting to 13% moisture and extrapolating to 1-ha area. The one hundred grain weight (HGW) and the severity of grain spots (SS) were determined as well. The SS was determined following the rating scale developed by the International Rice Research Institute (IRRI 1996). A descriptive analysis was performed for each variable. Subsequently, the data were standardized to present mean 0 and variance 1 and then subjected to principal component analysis (PCA), considering only the PCs with eigenvalues greater than 1 (Hair et al. 2005). The PC scores, obtained from the linear combination of the original variables, were subjected to geostatistical analysis, which consisted of modeling the semivariograms. The classification of spatial dependence evaluator (SDE) was based on the nugget effect and level ratio (C/C + Co). The spatial dependence of a variable is classified as follows: SDE ≤ 20% — low; 20% < SDE ≤ 40% — low; 40% < SDE ≤ 60% — medium; 60% < SDE ≤ 80% — high; and SDE > 80% — very high (Dalchiavon et al. 2012). The final criterion to decide the semivariogram model Figure 1. Maximum temperature (Tmax), minimum temperature (Tmin),
daily precipitation (P), and potential evapotranspiration (ETP) during the upland rice cycle grown in Red-Yellow Latosol under a crop-livestock integrated system. Data provided by the weather station of the Institute of Agricultural and Environmental Sciences of the Federal University of Mato Grosso, Sinop campus.
P and ETP (mm∙
d ay –1) Temper atur e (ºC ) 0 40 60 80 100 120 140 160 0 5 10 15 20 25 30 35 40 No v 1 5 No v 2 2 No v 2 9
Dec 6 Dec 1
3 Dec 2 7 Dec 2 0 Jan 1 7 Jan 2 4 Jan 3 1 F eb 7 F eb 1 4 F eb 2 1 F eb 2 8
Mar 6 Mar 1
3 Mar 2 0 Mar 2 7 Jan 10 Jan 3 Sowing Flowering Harvest 20
and the number of neighbors used to predict the best fit was obtained by cross-validation, that is, the angular coefficient was adjusted closer to 1 and the linear coefficient closer to 0. Once the semivariograms were adjusted, ordinary of kriging data was performed and the maps produced.
rEsults And discussion
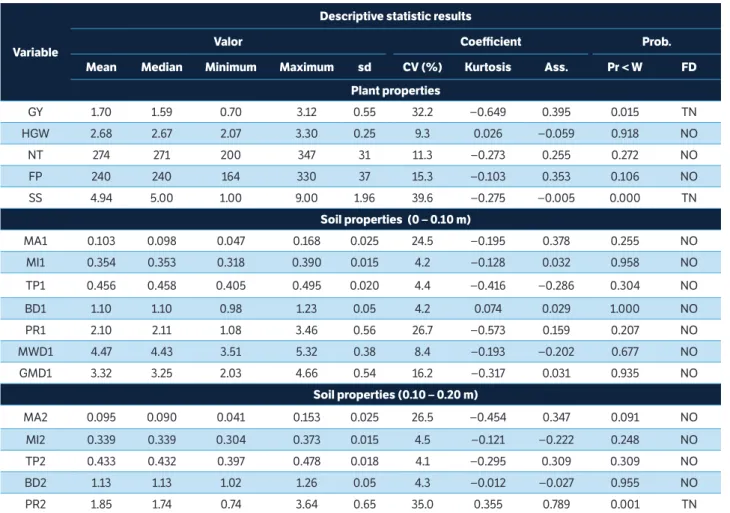
Table 1 shows that rice crop average GY was 1.70 Mg∙ha−1,
b e l ow t h e av e r a g e of Mat o G ro s s o, w h i c h w a s 3.20 Mg∙ha−1 in the 2011/2012 harvest year (CONAB 2012).
The rainfall recorded during the crop cycle was 1,200 mm (Figure 1), greater than the water needed for upland rice cultivation, which ranges from 600 to
700 mm (Stone and Moreira 2005). However, the rainfall distribution was uneven, occurring during the Indian summer in the rice “booting” and flowering stages, between 60 and 70 days after plant emergence (Figure 1), possibly limiting grain yield. Evapotranspiration during this period also exceeded 8 mm water depth per day.
Guimarães et al. (2002) stated that water deficit is not important during the vegetative stage of the rice, but it can severely damage the crop during the reproductive phase, especially in the pollen mother cell division (meiosis) and flowering stages. These authors reported that water stress affects the yield by interfering in the photosynthetic processes, transportation of carbohydrates, inhibiting the emission of panicles, and causing spikelet sterility. Furthermore, Heinemann (2010) reported rice
Variable
descriptive statistic results
Valor coefficient Prob.
Mean Median Minimum Maximum sd cV (%) Kurtosis Ass. Pr < W Fd Plant properties
GY 1.70 1.59 0.70 3.12 0.55 32.2 −0.649 0.395 0.015 TN HGW 2.68 2.67 2.07 3.30 0.25 9.3 0.026 −0.059 0.918 NO NT 274 271 200 347 31 11.3 −0.273 0.255 0.272 NO FP 240 240 164 330 37 15.3 −0.103 0.353 0.106 NO SS 4.94 5.00 1.00 9.00 1.96 39.6 −0.275 −0.005 0.000 TN
soil properties (0 – 0.10 m)
MA1 0.103 0.098 0.047 0.168 0.025 24.5 −0.195 0.378 0.255 NO MI1 0.354 0.353 0.318 0.390 0.015 4.2 −0.128 0.032 0.958 NO TP1 0.456 0.458 0.405 0.495 0.020 4.4 −0.416 −0.286 0.304 NO BD1 1.10 1.10 0.98 1.23 0.05 4.2 0.074 0.029 1.000 NO PR1 2.10 2.11 1.08 3.46 0.56 26.7 −0.573 0.159 0.207 NO MWD1 4.47 4.43 3.51 5.32 0.38 8.4 −0.193 −0.202 0.677 NO GMD1 3.32 3.25 2.03 4.66 0.54 16.2 −0.317 0.031 0.935 NO
soil properties (0.10 – 0.20 m)
MA2 0.095 0.090 0.041 0.153 0.025 26.5 −0.454 0.347 0.091 NO MI2 0.339 0.339 0.304 0.373 0.015 4.5 −0.121 −0.222 0.248 NO TP2 0.433 0.432 0.397 0.478 0.018 4.1 −0.295 0.309 0.309 NO BD2 1.13 1.13 1.02 1.26 0.05 4.3 −0.012 −0.027 0.955 NO PR2 1.85 1.74 0.74 3.64 0.65 35.0 0.355 0.789 0.001 TN
table 1. Descriptive analysis of rice production variables and physical properties of a Red-Yellow Latosol under crop-livestock integrated system.
yield losses above 60% due to water stress which occurred 10 days before the rice flowering period. Tonello et al. (2012) studied the BRS Monarca rice cultivar and reported decreasing yields due to water stress, between 0.520 to 1.82 Mg∙ha−1, and 1.17 Mg∙ha−1 average. According
to the authors, the low yield resulted from the water stress that lasted ten days from the differentiation stage of early flowers.
Despite the low average yield of rice in the CLIS, the yields of rice consortia varied from 0.70 to 3.12 Mg∙ha−1,
showing the high yield potential of this system. The average HGW was 2.67 g, close to the 2.80 g reported for the same cultivar by Tonello et al. (2012).
The average SS of 4.94 indicated a moderate severity of disease incidence, which can reduce by 12 to 30% the grain weight and 18 to 22% the number of filled grains per panicle (Filippi and Prabhu 1998). Singh et al. (1978) stated that the environmental conditions favorable to the development of the disease are intermittent high rainfall and a 4-week light period before flowering. Therefore, the conditions favorable to the development of pathogens justify the severity of the disease.
Regarding soil properties, the average MA was 0.10 m3∙m−3 (Table 1) for the 2 layers studied, the limit
for proper soil aeration (Reichert et al. 2007). However, macroporosity ranged from 0.041 to 0.168 m3∙m−3 in the
2 soil layers studied. Thus, there were localities where macroporosity was below 10%, possibly restricting soil oxygen diffusion and root growth.
The MI, TP and BD (Table 1) displ aye d low values, confirmed by the low coefficients of variation found for these variables, according to the scale by Pimentel-Gomes and Garcia (2002).
The average BD was 1.11 Mg∙m−3, considered low for
Red-Yellow Latosol. However, density values were high, up to 1.26 Mg∙m−3. It was also verified that the increase
from 0.98 to 1.26 Mg∙m−3 in BD changed greatly the MA
and PR (Table 1), variables that are more susceptible to modifications imposed by soil management.
Only the top soil layer (0 – 0.10 cm) had average PR higher than the 1.82 MPa, suggested by Beutler et al. (2004) as the limiting value for the rainfed rice yield. However, it is known that the limiting PR value varies with soil type, and these authors determined this value for Red Latosol of medium texture, making it difficult to compare the results.
Ralisch et al. (2008) reported PR values above 2 MPa in a forest area, and PR values above 3 MPa in no-tillage, conventional tillage and pasture systems in the 0.20 to 0.40 m soil layer. Nascimento et al. (2010) also determined PR values between 2 and 5 MPa for the 0.05 – 0.35 m layer of Yellow-red Latosol at the Federal University of Tocantins, in Gurupi, Tocantins state, Brazil.
The MWD and GMD values, representing the stability of the aggregates in water, were 4.47 and 3.32 mm, respectively (Table 1). According to Loss et al. (2011), these are considered high values, showing excellent structure of this soil under the CLIS for 7 years.
The Shapiro-Wilk confirmed the normal distribution of most data, except for GY and SS, PR in the 0.10 to 0.20 m layer. Although the test results were significant for these variables, indicating deviations from normality, it was assumed that the data distribution tended to be normal. This assumption can be justified by the low coefficient of skewness and kurtosis, and the proximity between the mean and median of these variables (Table 1).
The principal components analysis (PCs) was performed for the plant and soil variables. As already discussed, eigenvalues above 1 was the criteria for analysis, so analyses were performed using the first 6 principal components (Table 2), which represented 82.67% of the variability. Furthermore, the first 2 PCs represented 44.81% of the variability, and the other PCs represented variability lower than 12.58%.
The PCs resulted from the combination of the correlation between plant and soil variables and were classified according to Coelho (2003). The eigenvectors, values that represent the weight of each variable in each component (Silva et al. 2015), were classified according to the absolute value: < 0.30 minor, between 0.30 and 0.40 moderately significant, and ≥ 0.50 highly significant. All plant and soil variables had eigenvectors equal or higher than 0.50, highly significant. Therefore, all variables were kept in the analysis.
The PC1 was positively correlated with the GY, BD, and PR of the surface layer, and negatively with SS, MA and TP of the 0 – 0.10 m layer. It is noted that the separation of the access in PC1 was governed by two plant variables and physical properties of the 0 – 0.10 m soil layer, while the physical properties of the 0.10 – 0.20 m layer did not correlate with the varying GY.
highest yield occurred in places with high BD and PR. Moreover, the lowest yields were obtained in places with high SS while SS was observed in regions with higher MA and TP, that is, in places where the soil was less compacted, had better aeration and gas exchange with the atmosphere.
The PC2 is the variability of physical variables in the 0.10 – 0.20 m soil layer. PC was negatively correlated with MI, BD, and PR, and positively with MA and TP. The PC positive values indicated better drainage conditions, soil aeration, and root growth while negative values indicate soil compaction, represented by high BD and PR values.
The PC3 shows the variability of the NT, FP, MWD and GDM variables in the 0 – 0.10 m soil layer, which were positively correlated to PC3. Thus, higher PC values indicate higher number of tillers and rice panicles and higher soil aggregation. However, PC4 was negatively correlated with GY, MWD and GDM, showing that GY was not correlated with NT and FP and that the highest
rice yield occurred in regions of less structured soil, i.e. with lower MWD and GMD, justifying the results in PC1. Possibly the greatest yields are correlated with the HGW, which was represented in the PC5 as the only explanatory variable. In PC1, HGW was positively correlated with GY, although this variable is considered moderately significant. PC6 was negatively correlated with the microporosity of the 0 – 0.10 m layer only.
The geostatistical analysis was performed to map soil physical condition and GY after consortia in CLIS. Only the PC1, PC2 and PC6 displayed spatial correlation (Table 3), after the fitting of the spherical (PC1 and PC2) and exponential (PC6) models. The other PCs showed pure nugget effect, i.e. a random and spatial distribution independence.
The semivariance stabilizes when the threshold is reached, defining the reach, which for PC1, PC2, and PC6 were 30.7, 56.5, and 35.7 m, respectively. PC2, which represents the physical properties of the 0.10 – 0.20 m soil layer, showed greater range, indicating greater
Principal component Pc1 Pc2 Pc3 Pc4 Pc5 Pc6
Eigenvalue 3.93 3.67 2.13 1.82 1.38 1.12 Explained variance (%) 23.17 21.64 12.58 10.73 8.14 6.61
Variable correlation1
Grain yield 0.52* −0.29 0.19 0.51* 0.31 −0.04 Hundred-grain weight 0.48 −0.15 0.10 0.39 0.52* −0.08 Number of tillers 0.25 −0.34 0.58* 0.33 −0.47 0.16 Number of panicles 0.23 −0.35 0.56* 0.40 −0.45 0.07 Severity degree −0.55* 0.065 −0.06 −0.40 −0.42 −0.12 Macroporosity 1 −0.86* −0.20 0.22 0.19 0.11 0.11 Microporosity 1 0.47 0.31 0.02 −0.04 0.08 −0.71*
Total porosity 1 −0.73* −0.06 0.30 0.21 0.21 −0.41 Soil density 1 0.87* 0.14 −0.23 −0.13 −0.13 0.16 Soil resistance 1 0.78* 0.20 −0.11 −0.13 −0.31 −0.20 Mean weight diameter 1 0.18 0.18 0.77* −0.53* 0.18 0.00 Geometric mean diameter 1 0.16 0.16 0.76* −0.55* 0.19 0.02 Macroporosity 2 −0.05 0.93* 0.09 0.20 −0.01 0.06 Microporosity 2 −0.11 −0.66* −0.03 0.00 −0.25 −0.43 Total porosity 2 −0.17 0.71* 0.10 0.28 −0.24 −0.29 Soil density 2 0.15 −0.79* −0.19 −0.30 0.18 0.01 Soil resistence 2 0.07 −0.80* 0.00 −0.21 −0.08 −0.20
table 2. Summary of the main components of the multivariate analysis of rice production of components and the physical properties of a Red-Yellow Latosol in the crop-livestock integrated system.
1Correlations considered in the interpretation of the main component. The numbers 1 and 2 following the soil properties indicate the 0 – 0.10 m and 0.10 – 0.20 m
continuity of properties in space. This result can be attributed to minor changes in this layer due to crops and machine traffic. The spatial dependence evaluator (SDE) was rated high for PC1 and PC6, and medium to PC2. PC1 had the best fit, confirmed by the cross-validation method with regression coefficient equal to 1 (Table 3). Adjustments were satisfactory for PC2 and PC6, with regression coefficients over 0.60.
Based on semivariance models and taking into consideration the adjusted parameters, data from PCs were interpolated by ordinary kriging (Figure 2). The PC1 map shows that the consortia between crotalaria and pasture and sudangrass and pasture displayed the lowest values for PC1, meaning that the highest MA, TP and SS values were observed for these consortia. A possible explanation for the lower productivity of the sudangrass and brachiaria consortium may be the release of allelopathic compounds by species of the Sorghum genus, especially sorgoleone, a benzoquinone exudate released by the plant living roots, which has potent inhibitory effect of mitochondrial respiration, and the electron transport in photosystem II (Vidal and Trezzi 2004).
Cazetta et al. (2008) highlighted the negative effect of sorghum on upland rice yield in no-till system, which despite producing adequate amount of straw, reduced by almost half the grain yield when compared to cultivation after crotalaria. The authors attributed this behavior to sorghum allelochemical effect. In addition, the high C/N ratio of the straw associated with low doses of N, which were lower than those required by culture, may have caused the immobilization of N by microorganisms,
becoming a limiting factor to grain yield (Guimarães and Stone 2003).
The variability of SS may have resulted from the ability of each culture to host the pathogens that cause the disease, and several species of the Sorghum genus have been reported as hosts of the main pathogens responsible for grain spots (Fakhrunnisa and Ghaffar 2006). Malavolta et al. (2007) reported that the severity of grain spots was negatively correlated with panicle weight and the number of filled grains, and positively with the number of void grains and percentage of sterility, thus affecting the main components of rice yield.
The highest PC1values were observed in the cowpea and brachiaria consortium area, indicating the highest yields, and the highest BD and PR as well.
PC1 shows that the highest GYs were observed in the most compacted areas while the incidence of grain stain was higher in less compacted areas. The presence of macropores is important for soil aeration, but it also contributes to the reduced volume of micropores and, thus, of retained water. The lower micropore volume accentuated the problem caused by water stress, which may explain the negative correlation between GY and MA, and positive with MI. Areas with higher MI held higher water volume in the soil, allowing higher productivity due to the occurrence of the Indian summer during the rice flowering stage (Figure 2).
The rice plant has a tissue in the roots called aerenchyma that transports the oxygen available in the atmosphere to the cells of the roots; therefore, the lower soil aeration provided by the low MA was not limiting for root breathing. However, the lower MA values are associated with higher BD and PR, confirming that these
Variable
Fitting parameters
Model co co + c Ao (m) r2 sQr sdE cross-validation
% class a b r
PC1 Spherical 0.804 3.352 30.7 0.61 0.70 0.76 AL 0.06 1.00 0.39 PC2 Spherical 1.871 3.335 56.5 0.61 0.696 0.44 ME 0.05 0.77 0.32
PC3 Epp 2.120 2.120 - - -
-PC4 Epp 1.543 1.543 - - -
-PC5 Epp 1.020 1.020 - - -
-PC6 Exponential 0.140 0.632 35.7 0.62 0.016 0.78 AL 0.03 0.63 0.21
table 3. Semivariogram parameters of the main components of the multivariate analysis of rice and soil physical properties in the 0 – 0.10 and 0.10 – 0.20 m layers for a Red-Yellow Latosol in Crop-Livestock integrated system.
values are not limiting for the development and yield of upland rice under CLIS.
PC2 represents the soil physical variables in the 0.10 – 0.20 m layer. The cowpea and brachiaria consortium resulted in higher MI, BD and PR values (Figure 2). The highest MA and TP were observed for the sudangrass and brachiaria consortium while the crotalaria and brachiaria consortium presented intermediate values (Figure 2).
Multivariate analysis based on major components associated with geostatistics, allowed to summarize, map and correlate all the variability of soil physical properties and rice cultivation in a complex experiment, with many factors involved, such as the crop-livestock integrated systems (CLIS), no-tillage and incidence of disease in grains, facilitating the joint interpretation of the data.
conclusion
The soil physical properties and rice cultivation had medium-to-high spatial variability, with all information summarized into 3 main components.
The highest rice grain yield and lowest incidence of grain stain are obtained in the Brachiaria and cowpea consortium. Brachiaria in consortium with either crotalaria or sudangrass results in higher incidence of grain stain and lower rice yield.
The soil in the Brachiaria and cowpea consortium has a higher density and resistance to penetration when compared to the consortia between brachiaria and crotalaria or sudangrass.
Figure 2. Maps of the 2 principal components (PC1 and PC2) of rice variables and the physical properties in the 0 – 0.10 and 0.10 – 0.20 m layers of a Red-Yellow Latosol under a Crop-Livestock integrated system.
T1 = Cowpea and brachiaria consortium T2 = Crotalaria and brachiaria consortium T3 = Sudangrass and brachiaria consortium
T1 T2 T3
T1 T2 T3
2,4
0,8
-0,8
-2,4
-4,0
2,0
1,0
-0,0
-1,0
-2,0
1,2
0,6
-0,0
-0,6
-1,2
120
80
40
0
120
80
40
0
120
80
40
0
0 55 110 165 220
0 55 110 165 220
0 55 110 165 220
CP2
CP1
CP6
Distance (m)
Distance (m)
Beutler, A. N., Centurion, J. F., Silva, A. P., Roque, C. G. and
Ferraz, M. V. (2004). Compactação do solo e intervalo hídrico
ótimo na produtividade de arroz de sequeiro. Pesquisa
Agropecuária Brasileira, 39, 575-580. http://dx.doi.org/10.1590/
S0100-204X2004000600009.
Carvalho, M. A. C., Yamashita, O. M., Roque, C. G. and Noetzold,
R. (2011). Produtividade de arroz no sistema integração
lavoura-pecuária com o uso de doses reduzidas de herbicida.
Bragantia, 70, 33-39.
rEFErEncEs
Cazetta, D. A., Arf, O., Buzetti, S., Sá, M. E. and Rodrigues, R. A.
F. (2008). Desempenho do arroz de terras altas com a aplicação
de doses de nitrogênio e em sucessão às culturas de cobertura
do solo em sistema de plantio direto. Bragantia, 67, 471-479.
http://dx.doi.org/10.1590/S0006-87052008000200023.
Coelho, A. M. (2003). Agricultura de precisão: manejo da
variabilidade espacial e temporal dos solos e das culturas.
In N. Curi, J. J. Marques, L. R. G. Guilherme, J. M. Lima, A. S.
Lopes and V. V. H. Alvarez (Eds.), Tópicos em ciência do solo
C o m p a n h i a N a c i o n a l d e A b a s t e c i m e n t o ( 2 0 1 2 ) .
Acompanhamento da safra brasileira: grãos (Décimo segundo levantamento, p. 1-30). Brasília: CONAB; [accessed 2015 Nov. 26]. www.conab.gov.br
Dalchiavon, F. C., Carvalho, M. P., Andreotti, M. and Montanari, R. (2012). Variabilidade espacial de atributos da fertilidade
de um Latossolo Vermelho distroférrico sob Sistema Plantio Direto. Revista Ciência Agronômica, 43, 453-61.
Empresa Brasileira de Pesquisa Agropecuária (1997). Manual de métodos de análise de solo. Rio de Janeiro: Embrapa Solos.
Fakhrunnisa, M. H. H. and Ghaffar, A. (2006). Seed-borne mycoflora of wheat, sorghum and barley. Pakistan Journal of
Botany, 38, 185-192.
Filippi, M. C. and Prabhu, A. S. (1998). Doenças do arroz e seu
controle. In F. Bresseghello and L. Stone (Eds.), Tecnologia para o arroz de terras altas (p. 139-156). Santo Antônio de Goiás: Embrapa Arroz e Feijão.
Guimarães, C. M., Fageria, N, K. and Barbosa Filho, M. P. (2002). Como a planta de arroz se desenvolve. Piracicaba: Potafos.
Guimarães, C. M. and Stone, L. F. (2003). Adubação nitrogenada
do arroz de terras altas no sistema de plantio direto. Revista Brasileira de Engenharia Agrícola e Ambiental, 7, 210-214.
Hair, J. F., Anderson, R. E., Tatham, R. L. and Black, W. (2005). Análise multivariada de dados. Porto Alegre: Bookman.
Heinemann, A. B. (2010). Caracterização dos padrões de estresse hídrico para a cultura do arroz (ciclo curto e médio) no estado de Goiás e suas consequências para o melhoramento
genético. Ciência e Agrotecnologia, 34, 29-36.
International Rice Research Institute (1996). Standard evaluation system for Rice. Manilla: INGER/Genetic Resources Center.
Kemper, W. D. and Rosenau, R. C. (1986). Aggregate stability and size distribution. In A. Klute (Ed.), Methods of Soil Analysis: Part 1 – Physical and Mineralogical Methods (p. 425-442).
Madison: Soil Science Society of America.
Loss, A., Pereira, M. G., Anjos, L., Giacomo, S. and Perin, A.
(2011). Carbono e nitrogênio em agregados do solo sob plantio direto com integração lavoura-pecuária. Pesquisa Agropecuária Brasileira, 46, 658-767.
Malavolta, V. M. A., Soligo, E. A., Dias D. D., Azzini, L. E. and Bastos, C. R. (2007). Incidência de fungos e quantificação
de danos em sementes de genótipos de arroz. Summa
Phytopathologica, 33, 280-286.
Nascimento, A. H. C., Queiroz, A. P., Lima, S. O., Carvalho, C. M.,
Feitosa, H. O. and Oliveira, A. L. (2010). Desenvolvimento da mamoneira com diferentes níveis de calagem em um Latossolo
Vermelho-Amarelo compactado. Revista Brasileira de Ciências Agrárias, 5, 163-169.
Pimentel-Gomes, F. and Garcia, C. H. (2002). Estatística aplicada
a experimentos agronômicos e florestais: exposição com exemplos e orientações para uso de aplicativos. Piracicaba:
FEALQ.
Ralisch, R., Miranda, T. M., Okumura, R. S., Barbosa, G. M.
C., Guimarães, M. F., Scopel, E. and Balbino, L. C. (2008). Resistência à penetração de um Latossolo Vermelho-amarelo do
cerrado sob diferentes sistemas de manejo. Revista Brasileira de Engenharia Agrícola e Ambiental, 12, 381-384.
Reichert, J. M, Suzuki, L. E. A. S. and Reinert, D. J. (2007)
Compactação do solo em sistemas agropecuários e florestais:
identificação, efeitos, limites críticos e mitigação. In C. A. Ceretta, L. S. Silva and J. M. Reichert (Eds.), Tópicos em ciência do solo
(p. 49-134). Viçosa: Sociedade Brasileira de Ciência do Solo.
Reis, E. M. and Casa, R. T. (2004) Sobrevivência de fitopatógenos. In F. X. R. Vale, V. C. Jesus and L. Zambolim (Eds.), Epidemiologia
aplicada ao manejo de doenças de plantas. (p. 335-364). Belo Horizonte: Perfil.
Reis, E. M., Trezzi, C. and Bianchin, V. (2011). Controle de doenças
de plantas pela rotação de culturas, Summa Phytopathol, 37,
85-91.
Silva, E. N. S., Montanari. R., Panosso, A. R., Correa, R., Tomaz, P. K. and Ferraudo, A. F. (2015). Variabilidade de
atributos físicos e químicos do solo e produção de feijoeiro cultivado em sistema de cultivo mínimo com irrigação. Revista
Brasileira de Ciência do Solo, 39, 598-607. http://dx.doi.
org/10.1590/01000683rbcs20140429.
Singh, B. M., Saharan, G. S., Shyam, K. R. and Sood, A. K. (1978). Factors affecting severity of glume blight in different cultivars of
rice in Himachal Pradesh. Indian Phytopathology, 31, 419-423.
Stone, L. F. and Moreira, J. A. A. (2005). Irrigação do arroz de terras altas em função da porcentagem de cobertura do solo
pela palhada, no sistema plantio direto. Santo Antônio de
Tonello, L. P., Silva, J., Ramos, D. P., Sousa, S. A. and Fidelis, R. R. (2012). Eficiência do uso de fósforo em genótipos de arroz cultivados em solos de terras altas. Revista Verde de Agroecologia e Desenvolvimento Sustentável, 7, 25-32.