AbstrAct: The objective of this study was to evaluate sugarcane straw decomposition and the potential of increasing soil carbon
as a function of the initial biomass and vinasse addition to soil
surface. The experimente consisted of incubation (240 days, in the
dark, humidity equivalent to 70% of soil water retention capacity
and average temperature of 28 °C) of Oxisol soil samples (0-20 cm
soil layer) with straw added to soil surface at rates of 2; 4; 8; 16 and
24 t∙ha−1 and with or without vinasse addition (200 m3∙ha-1). The
following variables were determined: released C-CO2, remaining
straw dry matter, carbon straw and soil carbon concentration. The
added biomass did not influence straw decomposition rate, but
vinasse treatments provided rates between 70 and 94% compared
soil And PlAnt nutrition -
Article
Sugarcane straw decomposition and carbon
balance as a function of initial biomass and
vinasse addition to soil surface
Carina Sayuri Yamaguchi1, Nilza Patrícia Ramos2, Cristina Silva Carvalho2, Adriana Marlene Moreno Pires2, Cristiano Alberto de Andrade2*
1. Instituto Agronômico - Curso de Pós-Graduação em Agricultura Tropical e Subtropical - Campinas (SP), Brazil. 2. Embrapa Meio Ambiente - Jaguariúna (SP), Brazil.
*Corresponding author: [email protected]
to 68 to 75% for the ones without vinasse. The straw (16 and
24 t∙ha−1) decomposition rate increased between 14 and 35% due
to vinasse addition, but the same behavior was not observed
for released C-CO2. This result was explained by the twofold
increase of soil carbon concentration, estimated by mass balance
and confirmed analytically by the carbon concentration of soil
samples. It was concluded that sugarcane straw decomposition,
under no limiting conditions of humidity and temperature,
did not depend on biomass initially added and that vinasse
addition accelerated straw decomposition and potentialized
carbon input into the soil.
introduction
Brazil is a major sugarcane producer in the world, with approximately 660 million tons of stalks produced in the 2013/2014 harvest, in approximately 9.1 million hectares (CONAB 2014). São Paulo State is the largest national producer, with about 4.7 million hectares planted with sugarcane, equivalent to 51% of the planted area (UNICA 2014).
In addition to sugar and ethanol, bagasse, and, more recently, straw, also started to add value to the production process of the sugar and alcohol industry since they represent important raw materials for power generation (Dias et al. 2009). Currently, the sugarcane biomass is the main source of bioenergy in the country, playing a strategic role in diversifying the energy sources and reducing the use of fossil fuels (CNBIO 2015).
Among the important innovations in the industry, the mechanized harvest of raw sugarcane is noteworthy because it allowed harvesting sugarcane without pre- viously burning it. In São Paulo State, the area harvested without burning increased from 37% in 2004 (Smeets et al. 2008) to 83% in 2014 (UNICA 2014). In this system, the straw input varies between 10 and 30 t∙ha−1∙year−1, representing a significant amount of carbon (C) and the possibility of nutrient recycling in the system. However, straw has become an input/raw material due to the demand for renewable energy and a change in focus of the industry and/or large business groups, which incorporated into their activities the production of “bioenergy” (Dias et al. 2009).
The value of straw as a raw material for bioenergy can be estimated relatively easily. On the other hand, the value in the field is related to potential benefits such as increased soil C (Razafimbelo et al. 2006; Canellas et al. 2010), reduced use of fertilizers (Thorburn et al. 2012), and maintenance of soil moisture (Marin et al. 2014). However, the straw can cause losses as well, such as budding failure and increased likelihood of fires (Rossetto et al. 2008) in the agricultural fields, and, therefore, should continue to be studied. A key aspect in this sense refers to the process of straw decomposition over time, since most of the straw benefits may be related to the presence of a physical barrier on the
soil surface and the mineralization process of organic compounds.
The decomposition of straw or the mineralization of sugarcane straw carbon were evaluated in some studies in Brazil. In general, the average decomposition rate of straw to a ratoon cycle is 66 ± 20% (Oliveira et al. 1999; Robertson and Thorburn 2007; Vitti et al. 2008; Fortes et al. 2012). Differences in the straw decomposition process are related to the biomass chemical composition (Oliveira et al. 1999; Oliveira et al. 2002), soil type and its attributes (Kliemann et al. 2006), climate (Alvarenga et al. 2001; Kliemann et al. 2006), and water and oxygen availability (Oliveira et al. 1999; Austin and Ballaré 2010). However, the amount of straw remaining on the field after harvest may affect the decomposition process since it keeps the soil moisture (Oliveira et al. 2002) favorable to microbial activity, partially regulating the amount of inorganic nitrogen immobilized by soil microorganisms in an attempt to reduce C/N ratio and favor the mineralization process (Vitti et al. 2008).
The decomposition of sugarcane straw is strongly influenced by its composition, especially regarding the C/N ratio, lignin, cellulose, hemicellulose, and polyphenols present in the residue (Fortes et al. 2012; Santos et al. 2012). Therefore, under appropriate temperature and moisture conditions, N availability should play a key role in the straw decomposition process (Potrich et al. 2014).
Vinasse, a byproduct of ethanol production, is used as potassium source in the sugarcane crop. It contains soluble carbon between 3.5 and 36 g∙L−1 and nitrogen
between 0.09 and 0.35 g∙L−1, which, added to the
dose commonly applied in the field, may change the dynamics of organic matter in the productive system (Penatti 1999), increasing pH and microbial activity (Doelsch et al. 2009). Thus, maintaining the straw on the soil and adding vinasse may be considered strategic to maintain or increase the soil fertility in long-term sugarcane crops (Canellas et al. 2003).
straw on the field depend on the decomposition process, among other factors.
MAtEriAl And MEtHods
The experiment was conducted under controlled conditions (in a dark room at 28 ± 2 °C). The soil and straw samples were incubated in 2.5 L (13.8 cm diameter and 21.5 cm tall) glass jars closed with plastic lid, with and without vinasse addition.
The soil used in the incubation is classified as Yellow Oxisol clayey (67% clay) (Embrapa 2006), collected from the 0 – 20-cm layer in a sugarcane planted area. The soil fertility was determined following the methodology described in van Raij et al. (2001): pHCaCl2 = 4.6; O.M. = 30 g∙kg−1; P
resin = 15 mg∙dm
−3; K = 1.3 mmol c∙dm
−3;
Ca = 3.4 cmolc∙kg−1; Mg = 1.4 cmol c∙kg
−1; H + Al = 4.1
cmolc∙kg−1; and V = 55%.
The straw of the RB86-7515 sugarcane variety used in incubation was collected manually, separating green (pointers) from dried leaves. This material was dried in an oven at 40 °C and sieved to remove the remaining soil. The incubated straw samples contained a mixture of 25% green and 75% dry leaves (weight/weight), cut into 1 to 3-cm long fragments. Subsamples were ground and used to determine the levels of C and N by
dry combustion in an TruSpec CN LECO® elemental
analyzer (Leco, St Joseph, MI, USA). The C and N levels were 469 and 5.5 g∙kg−1 on a dry basis, respectively, and C/N ratio was 85.
The vinasse used in the experiment was not mixed with any other liquid waste from the industry. The vinasse chemical parameters were pH = 4.7; 116 mg∙L−1 Na, 1,496 mg∙L−1 K; 10.4 g∙L−1 C and 0.35 g∙L−1 N, determined following the Technical Standard P4.231 (CETESB 2006).
T h e e x p e r i m e n t f o l l o w e d a c o m p l e t e l y randomized design, 6 × 2 factorial, consisting of 6 quantities of straw on the soil surface and 2 vinasse l e vels ( w it h and w it hout ) . E a ch t re at me nt w as performed in triplicate, totaling 36 experimental units.
Each jar contained 750 g of soil, a 5-cm deep layer on the bottom of the jar. The following straw quantities were
deposited on the soil: 20; 40; 80; 120; and 240 mg∙cm−2 dry basis, equivalent to 2; 4; 8; 16; and 24 straw t∙ha−1, resp e c t ively, and 9.38; 18.76; 37.53; 56.29; and 1 1 2 . 5 8 mg ∙ c m− 2 i n te r ms of c ar b on . T he st r aw quantities were calculated based on the jar area (149.57 cm²).
The vinasse was applied at the rate of 200 m3∙ha−1, and this volume was assumed to be distributed in the 0 – 20-cm layer. As the soil height was 5 cm in the jar, the applied dose corresponded to ¼ of the reference dose, which was equivalent to 150 mL∙jar−1. In addition to the straw and straw + vinasse treatments, soil and soil + vinasse (control) treatments were also incubated in jars to isolate the effect of the tested factors.
The humidity was monitored using the Time Domain Reflectometry (TDR) technique during the experimental period to maintain 70% of the maximum water retention capacity. In the treatments with vinasse, only supplementary water volume was used to adjust moisture.
Straw decomposition pattern was evaluated according to the respirometry method recommended by the Technical Standard P4.230 (CETESB 1999). The C-CO2 was captured using standard NaOH solution; the jars were opened periodically to change the NaOH solution, while the CO2 of the removed solution was quantified by reading the electrical conductivity (Rodella and Saboya 1999), as described in Coscione and Andrade (2006).
The NaOH solution was renewed daily in the first 30 days of incubation and every 5 days after that until the end of the experimental period, which lasted 240 days.
At the end of the incubation experiment, the remaining straw was manually collected from each jar, and the jars remained open in an airy room to dry the soil. The straw samples were washed with ultrapure water and dried at 40 °C to constant weight. Weights were recorded to calculate the straw decomposition rate. Subsequently, the samples were ground in a Wiley mill (0.84-mm mesh sieve) to determine C and N content
in the TruSpec CN LECO® elemental analyzer. Soil
a 0.150-mm opening mesh to quantify total C, also in the mentioned elemental analyzer.
Mass balance calculations for soil C and statistical correlation analysis were performed to assist in the discussion of the results. To determine whether the soil gained or lost C, the mass balance was performed using the equation:
carbon (mg∙cm−2) that remained in the straw at the end of the incubation period; Cvinasse is the carbon (mg∙cm−2) added to the soil-straw system via 150 mL vinasse; C-CO2 is the total carbon (mg∙cm−2) released as CO2 until the end of the incubation period.
The results were submitted to analysis of variance considering a completely randomized design, double factorial (straw versus vinasse), and, in case of significant
effect, we used regression for straw quantities and Tukey’s test (p ≤ 0.05) to compare means for vinase levels.
Statistical correlations between the mass balance results and soil carbon levels were determined to assist
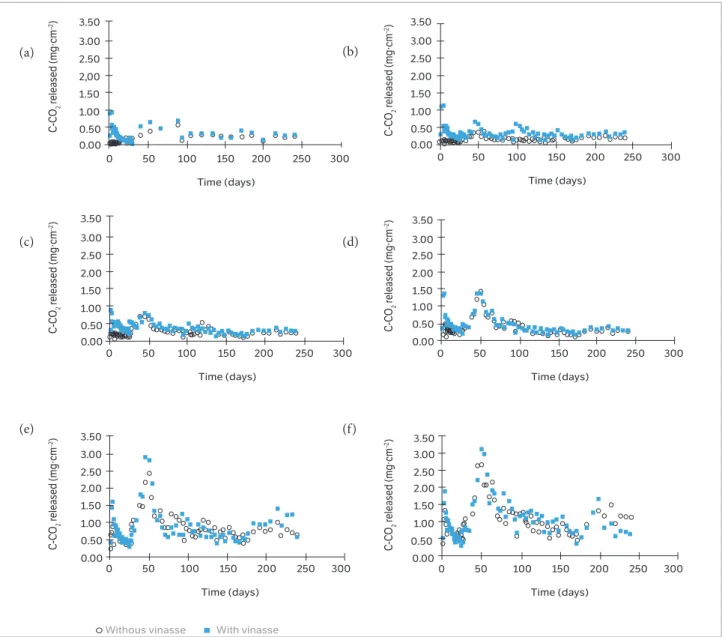
Figure 1. Carbon released as CO2 (C-CO2) over time, with and without vinasse. (a) 0 t∙ha−1 straw; (b) 2 t∙ha−1 straw (20 mg∙cm−2); (c)
4 t∙ha−1 straw (40 mg∙cm−2); (d) 8 t∙ha−1 straw (80 mg∙cm−2); (e) 16 t∙ha−1 straw (160 mg∙cm−2); (f) 24 t∙ha−1 straw (240 mg∙cm−2).
C
-CO
2
rele
ased (mg·cm
–2)
C
-CO
2
rele
ased (mg·cm
–2)
C
-CO
2
rele
ased (mg·cm
–2)
C
-CO
2
rele
ased (mg·cm
–2)
C
-CO
2
rele
ased (mg·cm
–2)
C
-CO
2
rele
ased (mg·cm
–2) 3.50
3.00 2.50 2,00 1.50 1.00 0.50 0.00
3.50 3.00 2.50 2.00 1.50 1.00 0.50 0.00
3.50 3.00 2.50 2.00 1.50 1.00 0.50 0.00
3.50 3.00 2.50 2.00 1.50 1.00 0.50 0.00 3.50 3.00 2.50 2.00 1.50 1.00 0.50 0.00 3.50 3.00 2.50 2.00 1.50 1.00 0.50 0.00
0 50 100 150 200 250 300
Time (days)
0 50 100 150 200 250 300
Time (days)
0 50 100 150 200 250 300
Time (days)
0 50 100 150 200 250 300
Withous vinasse With vinasse
0 50 100 150 200 250 300
Time (days)
0 50 100 150 200 250 300
Time (days)
Time (days)
Cbalance = (Cinitial straw − Cfinal straw) + Cvinasse − C-CO2
where: Cbalance is the lost or gained soil carbon (mg∙cm−2) quantity; C
initial straw − Cfinal straw represents the
(a) (b)
(c) (d)
in the discussion of the results. The Sisvar software was used for statistical analysis (Ferreira 2000).
rEsults And discussion
The C-CO2 flows varied significantly with the
addition of vinasse over time, during the incubation period (Figure 1). C-CO2 emission peaked was observed on the third day of incubation for all treatments with vinasse, which was attributed to microbial metabolism of soluble carbon residue. This effect lasted 20 to 25 days in the controls (without straw) and in the 3 treatments with lower straw quantities (20; 40; and 80 mg∙cm−2). In the treatments with higher straw quantities, the peak lasted less than 20 days. In general, the C-CO2 flow associated with vinasse varied from 120 to 285 mg∙cm−2.
In fac t, carb on vinass e or ig inates esp e cia l ly f rom t he comp ounds de r ive d f rom t he lysis of yeast cells and partially-fermented must, which are easily decomposed and a labile energy source for microorganisms (Glória 1980). Minhoni and Cerri (1987) also reported that vinasse decomposition in the soil resulted in CO2 emission peak, in the first days of incubation.
Then, C-CO2 flux peaked again for all amounts
of straw regardless of vinasse, after the first 25 days of incubation (Figure 1a,b,c,d,e,f ). Carbon mineralization is accelerated by increasing microbial activity due to the addition of more easily decomposable substrates to the soil (Souza et al. 2006). In this process, the initial phase is more intense, in which less recalcitrant compounds are sources of energy and carbon to microorganisms, but, over time, the process intensity tends to decrease concomitantly with increased participation of other more recalcitrant compounds (Gonçalves et al. 2010). Thus, the microbial community needed approximately 25 days to adapt to the carbon substrate characterized by the straw (more recalcitrant), since, almost all C of this residue (readily available) had already been mineralized in the vinasse treatments.
The highest C-CO2 emission peak, associated with the straw decomposition, occurred near the 50th day of incubation (Figure 1) with variable magnitude depending on the amount of straw initially added to the soil.
The C-CO2 flows increased as the straw amount also increased (0.5; 0.7; 1.4; 2.6, and 2.9 mg∙cm−2 C-CO
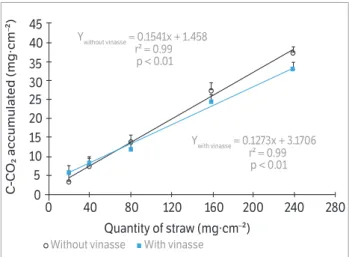
2 for 20; 40; 80; 160 and 240 mg∙cm−2 straw, respectively). The cumulative C-CO2 increased linearly with the amount of straw (Figure 2). The accumulated C-CO2 was not affected by vinasse for straw quantities up to 80 mg∙cm−2; however, the value was lower for higher straw amounts (160 and 240 mg∙cm−2) in the presence of vinasse. The C-CO2 emitted as a function of applied vinasse averaged 7.86 ± 3.34 mg∙cm−2, close to the C levels (10.43 mg∙cm−2) applied via vinasse.
Figure 3. Remaining straw dry matter for the straw amounts (0; 20; 40; 80; 160 and 240 mg∙cm−2) with and without vinasse.
Vertical bars represent the least significant difference between the average amounts of remaining dry matter by Tukey’s test (p ≤ 0.05).
Figure 2. Cumulative carbon emission (C-CO2) for the studied quantities of sugarcane straw (0; 20; 40; 80; 160 and 240 mg∙cm−2)
with and without vinasse. Vertical bars represent the least significant difference between C-CO2 accumulated at each evaluation time.
0 40 80 120 160 200 240 280
Quantity of straw (mg∙cm–²)
Without vinasse With vinasse
Ywithout vinasse = 0.2895x - 0.8564 r² = 0.98
p < 0.01
Ywith vinasse = 0.2098x - 0.66 r² = 0.80
p < 0.01
Dry ma
er (mg∙cm
–²) 90 80 70
50 60
40 30 20 10 0
C
-CO
₂ ac
cumulat
ed (mg∙cm
–²) 45
40 35
25 30
20 15 10 5 0
0 40 80 120 160 200 240 280
Quantity of straw (mg∙cm–²)
Without vinasse With vinasse
Ywithout vinasse = 0.1541x + 1.458 r² = 0.99 p < 0.01
Ywith vinasse = 0.1273x + 3.1706 r² = 0.99
The C-CO2 accumulated at the end of the 240-day period was proportional to the amount of straw deposited on the soil, and, for straw amounts up to 80 mg∙cm−2, vinasse had non-significant effect (Figure 3). The 2 largest amounts of straw released less C-CO2 in the presence of vinasse, which is apparently contradictory considering that vinasse is a labile C source. However, it must be considered that the vinasse nitrogen can assist in stabilizing the organic material in the soil, similarly to what occurs in areas with straw and mineral fertilizers (Graham et al. 2002). Therefore, the fact that the C-CO2 flow, for lower straw amounts (20; 40; and 80 mg∙cm−2), was not affected by the presence of vinasse can be explained by the lower N demand for carbon stabilization, since the soil is an N source as well. The higher the initial amount of straw, the higher the straw dry matter remaining on the soil (Figure 3). For the lower straw amounts (20; 40; and 80 mg∙cm−2 straw), vinasse had non-significant effect.
The remaining mass was 11 and 24% lower for 160 and 240 mg∙cm−2 straw (16 and 24 t∙ha−1, respectively) in vinasse treatment compared to without vinasse (Figure 3). On the contrary, the treatments with vinasse had higher
accumulated C-CO2 compared to treatments without
vinasse (Figure 2). In fact, greater straw decomposition rate was expected in the presence of vinasse since this residue is a source of soluble C, which is readily metabolized by soil microorganisms (Glória 1980;
Brito et al. 2009), and N, which also often limits the microbial activity.
The straw decomposition rate can be estimated from the slopes of the straight lines shown in Figure 3, assuming that the C mineralization or straw decomposition process stabilized in time. Straw decomposition rates were estimated as 79 and 71% with and without vinasse application, respectively. The straw decomposition rates at the end of the 240-day period (Figure 4) were not affected by the straw amounts. However, there was significant difference between treatments with and without vinasse. These differences occurred for the lower (20 mg∙cm−2) and higher (160 and 240 mg∙cm−2) straw amounts, where the straw decomposition rates were higher in treatments with (70 and 94%) and without (68 – 75%) vinasse.
The highest decomposition rate in the presence of vinasse may be due to soluble carbon and nitrogen present in this residue, in amounts able to change the dynamics of the mineralization process in the system, especially in the presence of sugarcane straw, rich in lignin and low in nitrogen. Furthermore, the application of vinasse may increase the pH, favoring the increase of microbial community and activity in the soil (Da Silva et al. 2007) and accelerating the decomposition of organic substrates. Other studies in the literature reported that the straw decomposition rate is independent of vinasse
Figure 4. Straw decomposition rate for the studied amounts (0; 20; 40; 80; 160; and 240 mg∙cm−2) with and without vinasse.
Vertical bars represent the least significant difference between the straw decomposition rates in the treatments with and without vinasse by Tukey’s test (p ≤ 0.05).
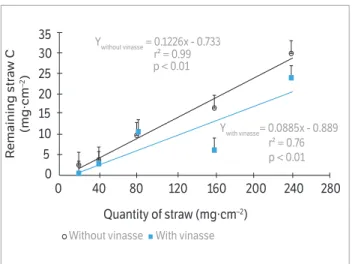
Figure 5. Remaining straw carbon for the amounts (0; 20; 40; 80; 160; and 240 mg∙cm−2) with and without vinasse, added to
the soil after 240 days of incubation. Vertical bars represent the least significant difference between the average amounts of remaining straw dry mass, with and without vinasse by Tukey’s test (p ≤ 0.05).
0 40 80 120 160 200 240 280
Quantity of straw (mg∙cm–2)
Without vinasse With vinasse
Dry ma
er
dec
omposition r
at
e (%)
100 95 90
80 85
75 70 65 60 55 50
0 40 80 120 160 200 240 280
Quantity of straw (mg∙cm–2)
Without vinasse With vinasse
R
emaining str
a
w C
(mg∙cm
–2) 35
25 30
20 15 10 5
0
Ywithout vinasse = 0.1226x - 0.733 r² = 0.99
p < 0.01
application. Oliveira et al. (1999) reported a straw decomposition rate between 66 and 75% regardless of vinasse for the 100 m3∙ha−1 dose. Similarly, Zotelli (2012) also found no effect of vinasse (56 m3∙ha−1) on straw decomposition rate for the amounts between 7 and 21 t∙ha−1. It is noteworthy that, in both papers, the vinasse amount applied was less than half of that used in this study, and the experiment was carried out under field conditions in which uncontrolled variability tends to be higher.
The remaining C results are consistent with those of dry matter, including the differences between treatments with and without vinasse for the 2 largest amounts of straw studied (Figure 5).
The contrasting behavior between the presence and absence of vinasse for the 160 and 240 mg∙cm−2
straw treatments, observed for accumulated C-CO2
(Figure 2) or the remaining dry mass (Figure 3), may be better explained by the C content in the soil and the mass balance.
The soil carbon content increased with the initial amount of straw in the treatments with vinasse (Figure 6), while, in the treatments without vinasse, the straw amount did not affect soil carbon.
It is possible to suppose that the soil carbon increased assuming that vinasse increased the straw decomposition rate and that the sugarcane straw, with high initial C/N ratio, could help stabilize C due to N deposition
Figure 6. Soil carbon for the straw amounts (0; 20; 40; 80; 160 and 240 mg ∙cm−2), with and without vinasse after 240 days of incubation.
Vertical bars represent the least significant difference between the average carbon content in the soil with and without application of vinasse by Tukey’s test (p ≤ 0.05).
Figure 7. Carbon mass balance in the soil for the straw amounts (0; 20; 40; 80; 160 and 240 mg∙cm−2), with and without vinasse.
Vertical bars represent the least significant difference between the average balance of carbon in the soil with and without vinasse by Tukey’s test (p ≤ 0.05).
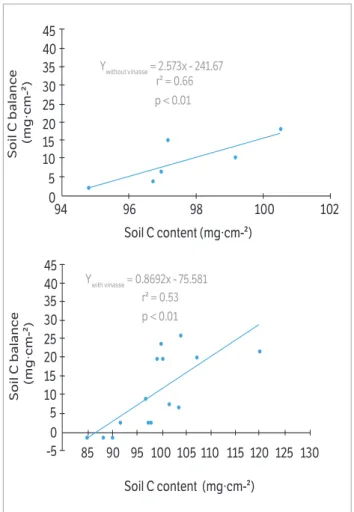
Figure 8. Correlation between soil carbon content and mass balance estimated based on the contributions from straw and vinasse, emitted as C-CO2 and remaining straw dry matter. Cbalance = (Cinitial straw − Cfinal straw) + Cvinasse − C-CO2. (a) Without vinasse; (b) With vinasse.
40 80 120 160 200 240 280
Quantity of straw (mg∙cm–²)
Without vinasse With vinasse 40
35 30
20 25
15 10 5
0 -5
C ma
s
s balanc
e
(mg∙cm
–2)
Ywithout vinasse = 0,118x - 2,384 r² = 0,96
p < 0,01
Ywith vinasse = 0,059x - 1,561
r² = 0,86 p < 0.01
Soil C (g∙k
g
–1) 24 23 22
20 21
19 18 17 16 15
0 40 80 120 160 200 240 280
Quantity of straw (mg∙cm–2)
Without vinasse With vinasse
Ywith vinasse = 0.0111x + 18.773 r² = 0.57 p < 0.01
40 35 30
20 25
15 10 5 0 45
Soil C balanc
e
(mg∙cm-²)
40 45
35 30
20 25
15 10 5 0 -5
Soil C balanc
e
(mg∙cm-²)
94 96 98 100 102
Soil C content (mg∙cm-²)
Soil C content (mg∙cm-²)
100 105 110 115 120 125 130 85 90 95
Ywithout vinasse = 2.573x - 241.67 r² = 0.66 p < 0.01
through vinasse. The challenge is to determine the C soil gains or losses, especially when considering short-term studies. Thus, a mass balance is proposed to diagnose C soil losses or gains to assist in the description of the mineralization process and the potential impact on the edaphic system.
A negative soil C balance occurred for low straw quantities, regardless of vinasse (Figure 7), while balance was neutral for 20 mg∙cm−2 (≈ 2 t∙ha−1) and 26 mg∙cm−2 (≈ 3 t∙ha−1) straw with and without vinasse, respectively. C soil gains were twice as high for 160 and 240 mg∙cm−2 straw with vinasse (Figure 7). The relationship between the carbon contents estimated by mass balance and quantified directly in soil was tested using statistical correlations (Figure 8).
A statistically significant correlation was observed between the C soil values obtained in the mass balance
and quantified directly in the soil, validating the estimates, since the C soil results were not included in the mass balance. Note that, in treatments without vinasse, the correlation was only observed for the data pairs generated in the 160 and 240 mg∙cm−2 straw treatments (Figure 8a), which is reasonable due to small C inputs (less than 3.3 mg∙cm−2 — estimated by the mass balance, Figure 7).
conclusion
The straw decomposition rate is not affected by the amount initially deposited on the soil in non-limiting conditions of temperature and humidity. The vinasse application accelerates the straw decomposition rate on the surface and potentiates carbon input to the soil.
Alvarenga, C. R., Cabezas, W. A. L., Cruz, J. C. and Santana, D. P. (2001). Plantas de cobertura de solo para sistema plantio direto. Informe Agropecuário, 22, 25-36.
Austin, A. T. and Ballaré, C. L. (2010). Dual role of lignin in plant litter decomposition in terrestrial ecosystems. Proceedings of the National Academy of Sciences of the United States of America, 107, 4618-4622. http://dx.doi.org/10.1073/pnas.0909396107.
Brito, F. L., Rolim, M. M. and Pedrosa, E. M. R. (2009). Efeito da aplicação de vinhaça nas características químicas de solos da zona da mata de Pernambuco. Revista Brasileira de Ciências Agrárias, 4, 456-462.
Canellas, L. P., Busato, J. G., Dobbs, L. B., Baldotto, M. A., Rumjanek, V. M. and Olivares, F. L. (2010). Soil organic matter and nutrient pools under long-term non-burning management of sugar cane. European Journal of Soil Science, 61, 375-383. http://dx.doi. org/10.1111/j.1365-2389.2010.01229.x.
Canellas, L. P., Velloso, A. C. X., Marciano, C. R., Ramalho, J. F. G. P., Rumjanek, V. M., Rezende, C. E. and Santos, G. A. (2003). Propriedades químicas de um Cambissolo cultivado com cana-de-açúcar, com preservação do palhiço e adição de vinhaça por longo tempo. Revista Brasileira de Ciência do Solo, 27, 935-944.
http://dx.doi.org/10.1590/S0100-06832003000500018.
rEFErEncEs
Centro Nacional de Referência em Biomassa (2015); [accessed
2015 Jan 05]. http://www.cenbio.org.br
Companhia de Tecnologia de Saneamento Ambiental (1999).
Norma P4.230. Aplicação de lodos de sistemas de tratamento biológico em áreas agrícolas – critérios para projeto e operação.
São Paulo: CETESB.
Companhia de Tecnologia de Saneamento Ambiental (2006). Norma P4.231. Vinhaça – critérios e procedimentos para aplicação
no solo agrícola. São Paulo: CETESB.
Companhia Nacional de Abastecimento (2014). Acompanhamento da safra brasileira de cana-de-açúcar, v.1 – Safra 2014/15, N.3 – Terceiro
Levantamento. Brasília, 1-27; [acessado 19 Out. 2016]. http://www. conab.gov.br/OlalaCMS/uploads/arquivos/14_12_19_09_02_49_
boletim_cana_portugues_-_3o_lev_-_2014-15.pdf
Coscione, A. R. and Andrade, C. A. (2006). Protocolos para avaliação da dinâmica de resíduos orgânicos no solo. In J. C. Andrade and
M. F. Abreu (Eds.), Análise química de resíduos sólidos para monitoramento e estudos agroambientais (p. 159-177). Campinas:
Instituto Agronômico.
freático. Revista Brasileira de Engenharia Agrícola e Ambiental,
11, 108-114. http://dx.doi.org/10.1590/S1415-43662007000100014.
Dias, M. O. S., Ensinas, A. V., Nebra, S. A., Maciel, R., Rosell, C.
E. V. and Maciel, M. R. W. (2009). Production of bioethanol and other bio-base materials from sugarcane bagasse: integration to conventional bioethanol production process. Chemical Engeneering
Research & Design, 87, 1206-1216.
Doelsch, R., Masion, A., Cazevielle, P. and Condom, N. (2009).
Spectroscopic characterization of organic matter of a soil and vinasse mixture during aerobic or anaerobic incubation. Waste Management, 29, 1929-1935. http://dx.doi.org/10.1016/j.wasman.2008.12.009.
Empresa Brasileira de Pesquisa Agropecuária (2006). Sistema Brasileiro de Classificação de Solos. Rio de Janeiro: Embrapa.
Ferreira, D. F. (2000). Manual do sistema Sisvar para análises estatísticas. Lavras: UFLA.
Fortes, C., Trivelin, P. C. O. and Vitti, A. C. (2012). Long-term decomposition of sugarcane harvest residues in Sao Paulo
state, Brazil. Biomass and Bioenergy, 42, 189-198. http://dx.doi. org/10.1016/j.biombioe.2012.03.011.
Glória, N. A. (1980). Utilização da vinhaça. Brasil Açucareiro, 86, 11-17.
Gonçalves, S. L., Saraiva, O. F., Franchini, J. C. and Torres, E. (2010).
Decomposição de resíduos de aveia e trigo em função do tempo e do manejo do solo. Londrina: Embrapa Soja.
Graham, M. H., Haynes, R. J. and Meyer, J. H. (2002). Soil organic matter content and quality: effects of fertilizer applications, burning and trash retention on a long-term sugarcane experiment in South
Africa. Soil Biology and Biochemistty, 34, 93-102. http://dx.doi. org/10.1016/S0038-0717(01)00160-2.
Kliemann, H. J., Braz, A. J. P. B. and Silveira, P. M. (2006). Taxa de decomposição de resíduos de espécies de cobertura em Latossolo Vermelho distroférrico. Pesquisa Agropecuária Tropical, 36, 21-28.
Marin, F. R., Thorburn, P. J., Costa, L. G. and Otto, R. (2014). Simulating long-term effects of trash management on sugarcane yield for
Brazilian cropping systems. Sugar Tech, 16, 164-173. http://dx.doi. org/10.1007/s12355-013-0265-2.
Minhoni, M. T. A. and Cerri, C. C. (1987). Decomposição de vinhaça em solo sob diferentes níveis de umidade: liberação de CO2,
formação de biomassa microbiana e imobilização do nitrogênio adicionado. Revista Brasileira de Ciências do Solo, 11, 25-30.
Oliveira, M. W., Trivelin, P. C. O., Gava, G. J. C. and Penatti, C. P. (1999).
Degradação da palhada de cana-de-açúcar. Scientia Agricola, 56, 803-809. http://dx.doi.org/10.1590/S0103-90161999000400006.
Oliveira, M. W., Trivelin, P. C. O., Kingston, G., Barbosa, M. H. P. and Vitti, A. C. (2002). Decomposition and release of nutrients from sugarcane trash in two agricultural environments in Brazil.
Anais do 24th Australian Society of Sugar Cane Technologists;
Cairns, Australia.
Penatti, C. P. (1999). Avaliação nutricional em cana colhida sem a queima da palha. Relatório Interno Copersucar-RT974. Piracicaba: Copersucar.
Potrich, D. C., Marchetti, M. E., Potrich, D. C., Ensinas, S. C., Serra, A. P., Silva, E. F. and Souza, N. H. (2014). Decomposição de resíduos culturais de cana-de-açúcar submetidos a diferentes doses de
nitrogênio. Semina: Ciências Agrárias, 35, 1751-1760. http://dx.doi. org/10.5433/1679-0359.2014v35n4p1751.
Razafimbelo, T., Barthes, B., Larre-Larrouy, M. C., De Luca, E. F., Laurent, J. Y., Cerri, C.C. and Feller, C. (2006). Effect of sugarcane residue management (mulching versus burning) on organic matter
in a clayey Oxisol from southern Brazil. Agriculture, Ecosystems & Environment,115, 285-289. http://dx.doi.org/10.1016/j. agee.2005.12.014.
Robertson, F. A. and Thorburn, P. J. (2007). Decomposition of sugarcane harvest residue in different climatic zones. Australian Journal of Soil Research, 45, 1-11. http://dx.doi.org/10.1071/SR06079.
Rodella, A. A. and Saboya, L. V. (1999). Calibration for conductimetric determination of carbon dioxide. Soil & Biochemistry, 31, 2059-2060.
Rossetto, R., Cantarella, H., Dias, F. L. F., Landell, M. G. A. and Vitti, A. C. (2008). Manejo conservacionista e reciclagem de nutrientes em
cana-de-açúcar tendo em vista a colheita mecânica. Informações Agronômicas, 124, 8-13.
Santos, F. A., De Queiróz, J. H., Colodette, J. L., Fernandes, S. A., Guimarães, V. M. and Rezende, S. T. (2012). Potencial da palha de cana-de-açúcar para produção de etanol. Química Nova, 35,
1004-1010. http://dx.doi.org/10.1590/S0100-40422012000500025.
Smeets, E., Junginger, M., Faaij, A., Walter, A., Dolzan, P. and
Souza, E. D., Carneiro, M. A. C., Paulino, H. B., Silva, C. A. and Buzetti, S. (2006). Frações do carbono orgânico, biomassa e atividade microbiana em um Latossolo Vermelho sob cerrado submetido a diferentes sistemas de manejos e usos do solo. Acta Scientiarum Agronomy, 28, 323-329. http://dx.doi.org/10.4025/actasciagron.v28i3.940.
Thorburn, P. J., Meier, E. A., Collins, K. and Robertson, F. A. (2012). Changes in soil carbon sequestration, fractionation and soil fertility in response to sugarcane residue retention are site-specific. Soil & Tillage Research, 120, 99-111. http://dx.doi.org/10.1016/j.still.2011.11.009.
União da Indústria de Cana-de-Açúcar (2014). São Paulo fecha safra 2013/2014 com colheita mecanizada em 83% dos canaviais; [accessed 2016 Oct 19]. http://www.unica.com.br/noticia/6551584920310 621254/sao-paulo-fecha-safra-2013-por-cento2F2014-com-colheita-mecanizada-em-83-por-cento-dos-canaviais
Van Raij, B., Andrade, J. C., Cantarella, H. and Quaggio, J. A. (2001).
Análise química para avaliação da fertilidade de solos tropicais.
Campinas: Instituto Agronômico.
Vitti, A. C., Trivelin, P. C. O., Cantarella, H., Faroni, C. E., Franco, H. C.
J., Otto, R., Trivelin, M. O. and Tovajar, J. G. (2008). Mineralização da
palhada e crescimento de raízes de cana-de-açúcar relacionados
com a adubação nitrogenada de plantio. Revista Brasileira
de Ciência do Solo, 32, 2757-2762. http://dx.doi.org/10.1590/
S0100-06832008000700020.
Zotelli, L. C. (2012). Palha e vinhaça: emissões de CO2, N2O e
CH4 em solo com cana-de-açúcar (Master’s thesis). Campinas: