2016 | Lavras | Editora UFLA | www.editora.ufla.br | www.scielo.br/cagro
http://dx.doi.org/10.1590/1413-70542016404009516
Hydrological simulation as subside for management of
surface water resources at the Mortes River Basin
Simulação hidrológica como subsídio para a gestão dos recursos hídricos superficiais na Bacia do Rio das Mortes
Eliete Nazaré Eduardo1*, Carlos Rogério de Mello2, Marcelo Ribeiro Viola2, Phillip Ray Owens3, Nilton Curi1
1Universidade Federal de Lavras/UFLA, Departamento de Ciência do Solo/DCS, Lavras, MG, Brazil 2Universidade Federal de Lavras/UFLA, Departamento de Engenharia/DEN, Lavras, MG, Brazil 3Purdue University, Department of Agronomy, West Lafayette, Indiana, United States of America
*Corresponding author: elietenazare@gmail.com Received in March 10, 2016 and approved in May 2, 2016
ABSTRACT
Hydrological models are tools which describe processes and allow predicting the results of making management decisions, and are an important water resource management tool, especially for small-sized watersheds. This work had as an objective to test different calibration strategies and apply the SWAT model for hydrological simulation of the Mortes River Basin, MG. We evaluated 6 fluviometric stations, with drainage area between 272 and 6070 km² for purposes of water resource management. The evaluation of the model performance was conducted by using Nash-Sutcliffe coefficients (CNS) and percent bias (PBIAS). The results obtained from the statistic indices applied
in the analysis of the model performance qualified the SWAT hydrological model as adequate for streamflow simulation in the Mortes River Basin. The adopted strategies attest to the applicability of the model as a management tool for water resources planning for other small-sized watersheds without data, in order to plan for rational water use.
Index terms: Environmental management; SWAT; drainage area; calibration.
RESUMO
Os modelos hidrológicos são ferramentas que descrevem processos e permitem antecipar as ocorrências e tomar decisões, dessa forma, apresentam-se como uma importante ferramenta de gestão dos recursos hídricos, principalmente no contexto de bacias hidrográficas de pequeno porte. Assim, objetivou-se com este trabalho abordar diferentes estratégias de calibração e teste do modelo SWAT na simulação hidrológica da bacia hidrográfica do Rio das Mortes, MG. Foram avaliados 6 postos fluviométricos, com área de drenagem entre 272 e 6.070 km², para fins de gestão dos recursos hídricos. A avaliação do desempenho do modelo foi realizada usando os coeficientes de Nash-Sutcliffe (CNS) e percentual de viés (PBIAS). Os resultados obtidos dos índices estatísticos aplicados na análise de desempenho do
modelo, qualificam o modelo hidrológico SWAT como adequado na simulação da vazão para a bacia hidrográfica do Rio das Mortes. As estratégias adotadas atestaram a aplicabilidade do modelo como ferramenta de gestão e planejamento dos recursos hídricos para bacias menores e sem dados, possibilitando o uso racional da água na bacia.
Termos para indexação: Gestão ambiental; SWAT; área de drenagem; calibração.
INTRODUCTION
The economic and technological development and accelerated population growth have generated a series of
conflicts over natural resources, with water use being the most common of these. The recent problems of water supply
and the increasing pressure of occupation and degradation
of river basins have generated research demand regarding the changes in the hydrological dynamics of watersheds.
Understanding of water dynamics in a watershed
is of fundamental importance to water resource planning
and management programs. According to its behavior, it
can be assessed if the watershed is either in balance or in the degradation process (Pinto et al., 2013).
Knowledge of the interrelationships associated
with natural phenomena involving the hydrologic cycle has enabled the development of mathematical models that describe the water dynamics in natural ecosystems. Recently, the detailing of the physical characteristics by the
linkage of geoprocessing and remote sensing techniques
scenarios, soil use and studies on water availability (Viola et al., 2012), among others.
Among the numerous models that have been used for watershed planning and management, the SWAT model, (acronym for “Soil and Water Assessment Tool”) stands out (Arnold et al., 1998). The model was developed by the Agricultural Research Service (USDA-ARS) and by Texas A&M University. It is a public domain tool designed to predict the impact of soil management practices, sediment and agrochemicals upon watersheds (Neitsch et al., 2011). SWAT is one of the hydrological models most widely used in the world (Piniewski; Okruszko, 2011), being accepted internationally as a robust and versatile model of watersheds (Bressiani et al, 2015a). In Brazil, some studies were conducted by applying the SWAT as tool for hydrological studies, highlighting: Paim and Menezes (2009), in the state of Santa Catarina; Andrade, Mello and Beskow (2013), Durães, Mello and Naghettini (2011), Lelis and Calijuri (2010), Lelis et al. (2012), Melo Neto et al. (2014), Pinto et al. (2013), and Rodrigues et al. (2015), all in the state of Minas Gerais; Lessa et al. (2013), Galharte, Villela and Crestana (2014), in the state of São Paulo; Aragão et al. (2013), in the state of Sergipe; Fukunaga et al. (2015), and Pereira et al. (2014) in the state of Espírito Santo; Bonumá et al. (2015) in the state of Rio Grande do Sul; and Bressiani et al. (2015b) in the state of Ceará. These studies have shown satisfactory results for SWAT use as a tool in hydrologic simulation, aiming at the multiple daily demands of water resource management.
The ability of a hydrological model to simulate the hydrological cycle in a watershed is evaluated through both calibration and validation processes (White; Chaubey, 2005). These processes are critical since the models present a number of uncertainties involved in a phenomenon as complex as the hydrologic cycle.
The calibration of a hydrological model for a watershed has been commonly developed by applying data from a single fluviometric station. This is inevitable in a region where there is only one station, or even in small-sized watersheds. However, as the hydrologic variables (such as streamflow) have elevated temporal and spatial variabilities, the development of the modeling with data from only one station may not be able to adequately characterize the phenomenon in time and space in a watershed (Noor et al., 2014). Thus, some studies have been conducted comparing the calibration of a single station with that of a set of stations (Piniewski; Okruszko, 2011; Noor et al, 2014).
Due to the shortage of information of the hydrometric
network for water resource management studies in the state
of Minas Gerais, the need for studies of the behavior of streamflow is warranted. These studies may allow improving existing fluviometric information, by extrapolating results to sites which possess data either insufficient or inexistent, as is often the case of watersheds with small-sized drainage areas located in upstream regions. Viola et al. (2009) pointed out that hydrological models can be useful for better management of water resources, especially in the context of small-sized watersheds. According to Soares et al. (2010), the determination of the water availability in small watersheds, generally, devoid of streamflow measurements, constitutes a major problem in the application of the water
resource management instruments.
In this case, there is a demand for studies on calibration strategies of hydrological models that can
provide information for planning and management of water
resources, especially for smaller basins and without data. The Mortes River Basin is characterized by various mining projects, metallurgical activities and industrialization. The Mortes River represents one of the most important tributaries of the Grande River; its source is in the Mantiqueira range, near the city of Barbacena and the river mouth ends at the Funil Dam - Funil Hydroelectric Power Station (FHS). The relief presents itself is rolling and with significant extents already compromised by agricultural use, by the mining activities and the presence of gullies and rills (Curi; Chagas; Giarola, 1994) which present great
sediment production potential.
This study was conducted to address different calibration strategies for the SWAT model in the hydrologic simulation of the Mortes River Basin, MG, by evaluating 6 fluviometric stations with drainage area between 272 and 6070 km² for water resource management purposes.
MATERIAL AND METHODS
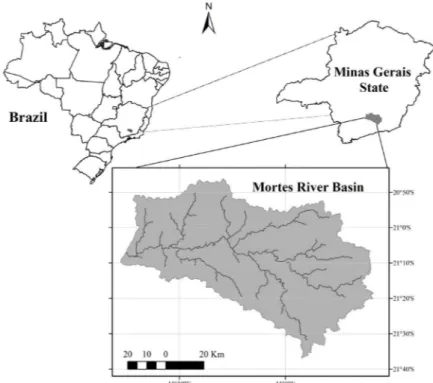
Study area
The Mortes River Basin (MRB) is located in the southeastern region of the State of Minas Gerais, Brazil (Figure 1). The MRB presents a 6070 km2 drainage area,
The SWAT model
The model “Soil and Water Assessment Tool” (SWAT) (Arnold et al., 1998) has been applied in many studies worldwide, especially in research related to water balance, soil management, transport of sediments, nutrients and pesticides, water quality, climate change and land use. SWAT is a semi-distributed model, continuous in time, and capable of simulation over long periods of time (Neitsch et al., 2011; Gassman et al., 2007). In simulation, the watershed is divided into sub-basins, which are then subdivided into hydrologic response units (HRU’s). Each HRU’s represent a homogeneous combination of characteristics of land use, soil type and slope classes (Neitsch et al., 2011). In this study, the version of SWAT2012 was utilized, through the ArcGIS 10.2 software interface, named ArcSWAT2012.
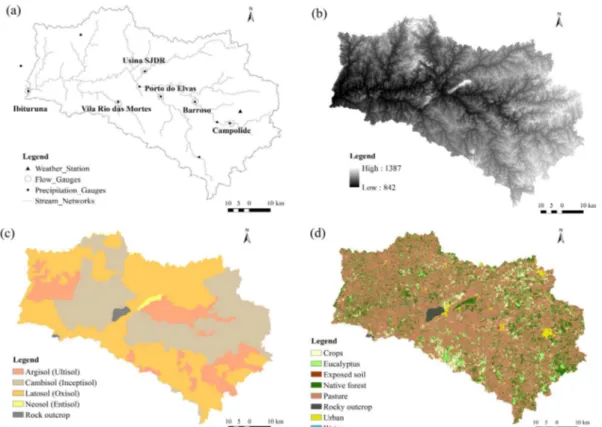
For hydrologic modeling of the watershed, SWAT requires a set of information such as: a digital terrain model (DEM), map of land use and soil cover and a soil class map. In addition, it is also necessary to feed the model with meteorological data such as rainfall, solar radiation, wind speed, relative humidity and maximum and minimum temperatures (Figure 2).
For application of the model, a hydrometeorological database with daily-step was developed. It was acquired from the Hydrological Information System of the National Water Agency (ANA), rainfall and fluviometric historical series (HIDROWEB, 2014), in addition to the records of the INMET station meteorological elements (BDMEP, 2014) presented in (Figure 2a and Table 1).
Vector topographic maps of the Systematic Mapping at the scale of 1:50,000 provided by the Brazilian Institute of Geography and Statistics (IBGE) were used for the DEM. Such maps were interpolated to generate the DEM allowing generating a regular grid with a spatial resolution of 30 vs. 30 m, this was the resolution used in the study. To obtain the DEM,
these interpolation procedures were performed from
tools available in ArcGIS 10.2 software interface. The altitude in the watershed ranges from 842 to 1,387 m (Figure 2b).
The soil map was obtained from the soil survey available in FEAM (2010), in the scale of 1: 650,000. In the watershed, the classes of Latosol soil occur in 45.1% of the area, Cambisol in 38.2% of the area; Argisol in 15.4% of the area; rocky outcrop in 0.7% of the area and Neosol in 0.6% of the area (Figure 2c).
For the soil use and cover mapping, images from the OLI sensor (Operational Land Imager) aboard the Landsat 8 satellite from 2013, with a spatial resolution of 30 meters and temporal passing every 16 days (Figure 2d) were utilized. The adopted classification method was
object-oriented classification which aimed to split the image into homogeneous regions through its spectral and spatial
attributes, followed by classification of these objects split into established land cover classes.
For modeling, the runoff curve number method (SCS-CN) for representation of the direct surface runoff process and the Penman-Monteith method for evapotranspiration were selected (Neitsch et al., 2011).
Sensitivity, calibration, validation analyses and uncertainty analysis
The sensitivity, calibration and validation analyses and uncertainty analysis were carried out in SWAT-CUP version 5.1.6 software (Abbaspour, 2015) using the algorithm “Sequential Uncertainty Fitting Procedure” Ver. 2 (SUFI-2) (Abbaspour; Johnson; van Genuchten, 2004; Abbaspour et al., 2007).
The sensitivity analysis of the SWAT model is conducted by means of the combination of the method of the Latin Hypercube sampling (LH) and of the One-Factor-At-a-Time structure (OAT) (Griensven et al., 2006). The sensitivity analysis determines which are the parameters most important to a particular watershed, which directs the set of parameters to be utilized in the subsequent calibration process. For this purpose, 16 parameters (Table 2) considered by the literature to be the most sensitive for streamflow simulation were used (Abbaspour et al., 2007; Andrade; Mello; Beskow, 2013; Durães; Mello; Naghettini, 2011; Lelis et al., 2012; Melo Neto et al., 2014). The calibration procedure used all six fluviometric stations: Vila do Rio das Mortes (272 km2),
Campolide (569 km2), Usina (SJDR) (643 km2), Porto
do Elvas (828 km2), Barroso (1040 km2) and Ibituruna
(6070 km2).
With the purpose of evaluating the SWAT performance as to the number of stations applied in calibration and respective drainage area (Da), different strategies for calibration and test of the model were carried out:
1) Calibration (1993 to 2000) and validation (2001 to 2005) utilizing exclusively the fluviometric data from the Ibituruna station, which was near the outlet of the studied watershed. Under this situation, the other five stations were utilized to test the capacity of the model to preview the runoff in upstream sub-basins, in the period of 1993 to 2000. The years of 1993 and 1994 were used as periods for warming up of the model since the early conditions for the model are unknown such as conditions of early moisture of the soil in the watershed. Warming up period is utilized for, when beginning the simulation, so that the variables would be free of the influences of early starting conditions (Zhang et al., 2007).
In addition our strategy, we compared the observed and simulated daily data to average streamflow, and the values of minimum and maximum streamflows for the calibration and validation period for the MRB.
2) Calibration considering all the available fluviometric stations.
3) Calibration considering each fluviometric station individually. It was aimed in this situation to compare the
quality of the individual fit of each station, with the joint calibration expressed in item (2).
4) It was evaluated the quality of the calibration resulting the combination of different fluviometric stations according to their drainage area, in the period of 1993 to 2000. They were:
4.1) Calibration using two stations with largest area (Da = 6070 and 1040 km2): under this situation the
other four stations were utilized to test the predictive capacity of the model in representing areas within smaller drainage areas;
4.2) Calibration based upon the station of largest drainage area (Da = 6070 km2) and smallest area (Da =
272 km2) and in this situation, a performance test of the model was conducted in the four monitored sections not
employed in the calibration process;
5) Calibration considering only the data of the fluviometric station of smallest drainage area (Da = 272 km2).
In this approach, the other five stations were utilized to test the predictive capacity of the model in representing
areas with a larger drainage area.
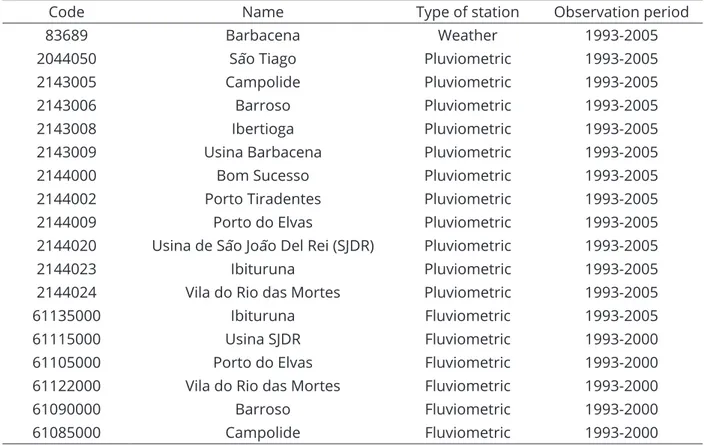
Table 1: Basic information of the utilized stations.
Code Name Type of station Observation period
83689 Barbacena Weather 1993-2005
2044050 São Tiago Pluviometric 1993-2005
2143005 Campolide Pluviometric 1993-2005
2143006 Barroso Pluviometric 1993-2005
2143008 Ibertioga Pluviometric 1993-2005
2143009 Usina Barbacena Pluviometric 1993-2005
2144000 Bom Sucesso Pluviometric 1993-2005
2144002 Porto Tiradentes Pluviometric 1993-2005
2144009 Porto do Elvas Pluviometric 1993-2005
2144020 Usina de São João Del Rei (SJDR) Pluviometric 1993-2005
2144023 Ibituruna Pluviometric 1993-2005
2144024 Vila do Rio das Mortes Pluviometric 1993-2005
61135000 Ibituruna Fluviometric 1993-2005
61115000 Usina SJDR Fluviometric 1993-2000
61105000 Porto do Elvas Fluviometric 1993-2000
61122000 Vila do Rio das Mortes Fluviometric 1993-2000
61090000 Barroso Fluviometric 1993-2000
The tests were conducted as follows: in each hydrologic simulation was considered a fluviometric station or the combination of stations in the calibration step. Once calibrated, the parameter values were applied to hydrologic simulation in other fluviometric stations. For each strategy calibration five iterations with 600 simulations each were performed. After each iteration, the sensitivity of the 16 parameters was determined, having as a criterion parameters presenting the value p <0.05 were selected and had their ranges reduced for the next iteration. Such a procedure finds support in the fact that such parameters present greater sensitivity since values close to 0 indicate a high significance (Abbaspour, 2015).
For practical application of the strategies adopted, permanence curves were developed for the sub-sections of the sub-basins, having as a basis the best strategy tested.
To assess the quality of the model adjustment to the observed data, the Nash-Sutcliffe coefficient (CNS - Equation 1) (Nash; Sutcliffe, 1970) and the percent bias of the simulated streamflow in relation to that observed (PBIAS - Equation 2) were utilized (Gupta; Sorooshian; Yapo, 1999).
Parameter Description Process Initial
value
Calibrated value
ESCO Soil water evaporation compensationcoefficient Evapotranspiration 0.80 0.739
CN2 Initial curve-number for moisture conditions II Surface runoff 55 to 92 -0.06%*
ALPHA_BF Base flow recession coefficient (days) Groundwater 0.048 0.004
GW_DELAY Time interval for aquifer recharge (days) Groundwater 31 68.15
GWQMN Water limit in the shallow aquifer for occurrence of base flow (mmH20) Groundwater 1000 1279
CANMX Maximum amount of water intercepted by vegetation (mmH20) Evapotranspiration 0 13.23
CH_K2 Effective hydraulic conductivity in the main channel (mm.h-1)
Transmission water
losses 0 1.166
CH_N2 Manning’s “n” value for the main channel Surface runoff 0.014 0.299
EPCO Water absorption coefficient by plants Groundwater 1 0.103
GW_REVAP Water rise coefficient to the saturated zone Groundwater 0.02 0.048
REVAPMN Soil water limit for occurrence of capillary rise
to the saturated zone (mmH20) Groundwater 750 1368
SOL_AWC Available water capacity of the soil (mmH2O.
mmsoil-1) Soil water 0.142 to 0.175 +0.005%*
SOL_K Soil saturated hydraulic conductivity Soil water 5.18 to 67.32 +0.024%*
SURLAG Surface runoff delay coefficient (days) Surface runoff 2 2.26
CH_N1 Manning’s “n” value for the secondary channel Surface runoff 0.014 0.264
CH_K1 Effective hydraulic conductivity in the tributary channel (mm.h-1)
Transmission water
losses 0 3.06
*parameters altered based on their initial values varying percentages depending on the class, land use and soil layer referred.
Table 2: Influent parameters in the streamflow simulating process by the SWAT and their initial values and final
calibrated value.
(1)
Where, QOBSi and QSIMi corresponds to the observed and
simulated streamflow, respectively, on day i (m3 s-1), and
QOBS corresponds to the average observed streamflow, in
(m3 s-1), and n corresponds to the number of events.
According to Zhang et al. (2007), the value of the Nash-Sutcliffe coefficient indicates the adjustment of simulated data to those observed on the straight 1: 1 line and can range from - ∞ to 1. To evaluate the CNS performance,
the criterion proposed by Moriasi et al. (2007) was adopted, which presents the following rating for this coefficient using a daily simulation step: CNS> 0.65, the model is considered very good; 0.54 < CNS < 0.65, the model is considered good
and between 0.50 and 0.54, satisfactory.
The PBIAS measures the average trend of the simulated data to be either larger or smaller than their equivalents observed (Moriasi et al., 2007). The classification by Van Liew et al. (2007) was adopted to evaluate the accuracy of the model in application of SWAT using daily intervals. According to this criterion:
|PBIAS| < 10%, very good; 10% < |PBIAS| < 15%, good;
15% < |PBIAS| < 25%, satisfactory and |PBIAS| > 25%, the model is inadequate.
In the SUFI-2 algorithm, the uncertainties of the input parameters are represented as uniform distributions,
while the output uncertainties of the model are expressed
as probability distributions of 95%. These are calculated at the 2.5% and 97.5% levels of the cumulative distribution of output variables obtained by the propagation of the uncertainties of the parameters using Latin Hypercube sampling (LH). This is referred to as the 95% prediction uncertainty, or 95PPU. These 95PPUs are the model outputs in a stochastic calibration approach. It is important to realize that there is not a single signal representing model output, but rather an envelope with possible solutions expressed by 95PPU, generated by certain parameter ranges. The SUFI-2 starts by assuming a large parameter uncertainty, so that the measured data initially falls within the 95PPU. In sequence, decrease this uncertainty in steps until two rules are satisfied: (1) the 95% prediction uncertainty (95PPU) supports more than 90% of the measured data, and (2) the average distance between the upper part (at 97.5% level) and the lower part (at 2.5% level) is lesser than the standard deviation of the measured data (Abbaspour; Johnson; van Genuchten, 2004; Abbaspour et al., 2007).
To quantify the fit of the simulation, expressed at 95PPU and observation expressed as a single signal (with any errors associated with it), two statistics were used: P-factor and R-factor (Abbaspour; Johnson; van
Genuchten, 2004; Abbaspour et al., 2007). The P-factor is the percentage of measured data involved by the result of the modeling, in other words, it is the 95PPU and varies from 0 to 1. The value 1 indicates 100% bracketing of the measured data within model prediction uncertainty (or being, a perfect model simulation considering the uncertainty). The R-factor, on the other hand, is the ratio of the average width of the 95PPU band by the standard deviation of the measured data, that is, the average thickness of the 95PPU band. For variable streamflow, values of P-factor > 0.7 and of R-factor of around 1 are recommended, considering thus the calibration as being adequate (Abbaspour, 2015, Abbaspour et al., 2007).
RESULTS AND DISCUSSION
Strategy 1: Behavior of the model at the Mortes River Basin
A tool used in the evaluation of the accuracy of hydrological models consists in analyzing visually the simulated hydrogram in relation to that observed. Figure 3 presents both the simulated and observed hydrograms and the daily hietograms for the Mortes River Basin at Ibituruna (6070 km2) during calibration and
validation periods, respectively. In general, the simulated streamflow adjusted well to the observed ones, i.e., the
model managed to capture the frequent oscillations
inherent to long-term continuous simulation.
In performing a visual analysis of the hydrograms, one realizes, in some situations, difficulty of simulating maximum streamflow. According to Pereira et al. (2014), streamflow peaks are naturally difficult to model, which is related to spatial and temporal representation problems of the most intense rains. Viola et al. (2009) add that the
simulation step is another factor limiting to the simulation
of the maximum streamflow events, since the sub-basins
present reduced concentration time in relation to the
main watershed. This difficulty was also observed by other authors, with the SWAT model, such as Andrade, Mello and Beskow (2013), Durães, Mello and Naghettini (2011), Melo Neto et al. (2014), Pereira et al. (2014), and Pinto et al. (2013).
In Figure 3 are also presented the results of the
precision statistics applied to evaluate the performance
of the SWAT model in the hydrological simulation of the Mortes River Basin calibrated and validated exclusively with Ibituruna station streamflow data. By analyzing the values, we observed good results in all the evaluated parameters. For the results of the uncertainty analysis, good results were obtained for both factors, i.e. values of P-factor > 0.7 and values of R-factor close to 1. That set of values allows classifying calibration on the basis of that strategy as adequate (Abbaspour et al., 2007).
The values of the CNS coefficient for the calibration step was of 0.76, which is classified as very good and for the validation step, it was of 0.62, which is classified as good, according to the classification by Moriasi et al. (2007) (Figure 3). It is usual for the statistical indices of the validation period to be inferior to the indices for the calibration period, since the values of the parameters are specifically optimized for the calibration period (Fukunaga et al., 2015; Lelis et al., 2012; Pinto et al., 2013). The
validation period can present different conditions which
cause the calibrated parameters to be different from the ideal (Fukunaga et al., 2015).
According to Durães, Mello and Naghettini (2011) the validation period of the simulation process is critical, allowing the definitive characterization of the applicability
of the model. That happens due to the fact that in this phase
the model is applied to a new database, considering the parameters obtained during the calibration period. Bonumá et al. (2015) points out that good validation results support the model’s utility in predicting other situations such as
alternative scenarios of soil use and management, future
climates and generation of simulated historical series.
Thus, since the CNS coefficient is the precision
statistics most applied and important to hydrologic simulation, it can be concluded that the model will produce good results for this watershed, proving an important tool
for planning and management of surface water resources.
Analyzing the performance of the model based on
the results of PBIAS (Figure 3), the values found indicated
an average underestimation of 6.0% of the streamflow in the calibration process and overestimation of 5.5% in the
validation phase and these values being considered as very
good according to the classification of Van Liew et al. (2007). Durães, Mello and Naghettini (2011) evaluated the performance of the SWAT model in the hydrologic simulation of the Paraopeba River watershed, MG, with 10,200 km² drainage area and obtained de CNS values equal to 0.79, both
in calibration and validation, the model being defined as appropriate and good. Melo Neto et al. (2014) evaluated the performance of the SWAT model in estimating the streamflow in two watersheds with different spatial scales (32 km2 and
4.7 km2) in the Upper Grande River region, south of Minas
Gerais. The authors found CNS values between 0.58 and 0.71
in the calibration phase and of 0.46 in the validation phase for mesoscale. By contrast, in the microscale, the model obtained inadequate performance with values of the statistical
coefficients below the limits recommended in the literature. Pereira et al. (2014) evaluated the performance of the SWAT model in the hydrologic simulation of a watershed located in Domingos Martins town, ES, with 943 km2 drainage area. The authors found C
NS values of
Figure 3: Daily hydrograms observed and simulated and respective hietogram, results of the precision statistics
0.65 and 0.70 for the calibration and validation periods, respectively, which provides the basis for the model to be classifiedas satisfactory. Fukunaga et al., 2015 evaluated the SWAT capacity to model daily streamflow in the Itapemirim River watershed, ES, with a 2237 km2 drainage
area. The authors found CNS values of 0.75 and 0.67
for the calibration and validation periods, respectively, and concluded that SWAT hydrologic model provided satisfactory results to the streamflow simulation of in
the studied watershed.
In order to test the performance of the SWAT model calibrated with data of the Ibituruna fluviometric station, the simulation of the behavior of the upstream streamflow, data of the Usina (SJDR), Porto do Elvas, Vila do Rio das Mortes, Barroso and Campolide stations were used.
In Table 3 are presented the results of accuracy statistics obtained by the calibration based on strategy 1, i.e., simulation for upstream sub-basins with smaller drainage
areas. The values obtained for the CNS coefficient ranged
from 0.28 (Porto Elvas station) to 0.50 (Barroso station), the latter being the only station with value of the CNS
coefficient classified as satisfactory.
As the CNS coefficient is an important statistical index in
the evaluation of hydrologic modeling, even though most of the stations have not presented CNS values considered satisfactory, these values can provide a starting point to the future studies addressing upstream tests of the studied test section.
The differences observed between calculated and observed streamflow, i.e., the percent bias (PBIAS) ranged
from 42.7% (Campolide station) to -1.3% (Barroso station),
indicating high underestimation of the model for the
Campolide station and slight overestimation of the model at the Barroso and Porto dos Elvas stations (Table 3). According to the classification proposed by Van Liew et al. (2007), the model showed very good performance PBIAS (< 10%) at the Barroso, Porto do Elvas stations; good (10 < PBIAS < 15%) at
Usina (SJDR); satisfactory 15% < |PBIAS| < 25% in Vila do Rio
das Mortes and non-satisfactory (PBIAS ≥ 25%) at Campolide. These results, together with a satisfactory performance obtained with the statistical coefficient, allowed concluding
that the model had an adequate performance upstream using
the calibration data at the Barroso station.
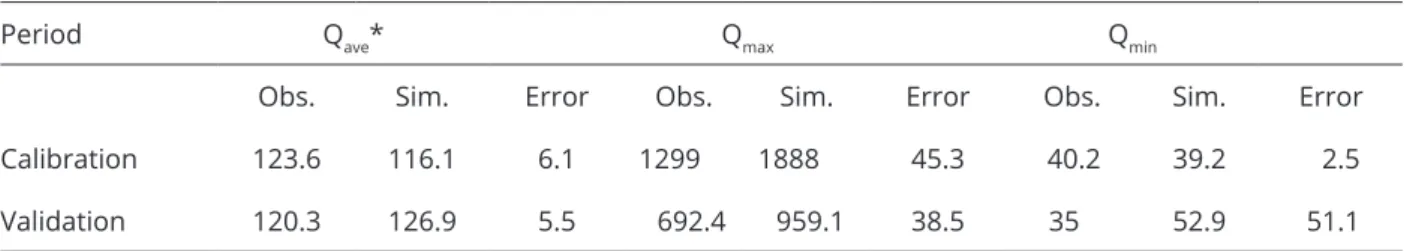
Table 4 lists the comparison between observed and simulated daily data to average streamflow, and values of minimum and maximum streamflows for the calibration and validation period for the MRB. We can observe smaller errors for average streamflow, denoting an adequate quality of the hydrological model in the simulation for the MRB.
Greater errors were found for the maximum and minimum
streamflows, which are expected, keeping in mind that the main aim of this study was the streamflows continuous simulation. Results of the same quality were found by Pereira et al. (2014) and Viola et al. (2009).
Considering the results, it can be inferred that the parameters calibrated at the watershed outlet may be used in future studies to represent the hydrological behavior of sub-basins, in the extent of the watershed under study.
This information is of importance to the management of
water resources, especially in large watersheds and with a low density of fluviometric stations.
Da* Stations CNS PBIAS
272 Vila do Rio das Mortes 0.38 15.4
569 Campolide 0.45 42.7
643 Usina (SJDR) 0.35 -13.1
828 Porto do Elvas 0.28 -1.5
1040 Barroso 0.50 -1.3
Table 3: Values of precision statistics obtained in the SWAT model performance test in the stations Usina
(SJDR), Porto do Elvas, Vila do Rio das Mortes, Barroso,
Campolide, using the parameters calibrated for the Ibituruna station.
*Drainage area in km2; C
NS - Nash-Sutcliffe coefficient; PBIAS -
percent bias
Period Qave* Qmax Qmin
Obs. Sim. Error Obs. Sim. Error Obs. Sim. Error
Calibration 123.6 116.1 6.1 1299 1888 45.3 40.2 39.2 2.5
Validation 120.3 126.9 5.5 692.4 959.1 38.5 35 52.9 51.1
*Qave = average streamflow (m3 s-1); Q
max = maximum streamflow (m 3 s-1); Q
min = minimum streamflow (m
Strategies 2 and 3: Calibration considering all the stations jointly and individually
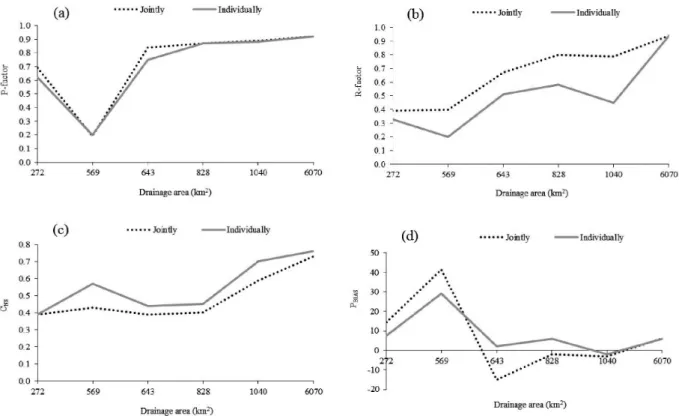
In Figure 4 are shown the results of the statistical accuracy obtained in the calibration of all the stations jointly, as well as of the individual calibration. Analyzing Figures 4a and b, it is observed, in general, for the results of the uncertainty analysis, a growing behavior of values P-factor
and R-factor as a function of the drainage area of the stations, with the P-factor > 0.7. For the R-factor, the best fits were also obtained for the stations with a larger drainage area, that is, when the value of R-factor is close to 1, the calibration is regarded as appropriate (Abbaspour et al., 2007). The different results found reflect the uncertainties involved in modeling natural systems.
According to Abbaspour (2015) one of the
greatest sources of error in the input data are the rainfall
information, being especially relevant in areas with occurrence of convective or orographic precipitations, with high spatial and percent variability. According to Bouraoui et al. (2004), an inadequate representation of
the required rainfall data or lack of rainfall collection
stations in the watershed makes it impossible to collect data that are spatially representative for this variable. According to Piniewski and Okruszko (2011), for use of the SWAT model on smaller spatial scales, which is an important demand of the water resource management, it is necessary to provide better input data and, in particular, use a monitoring network of the rainfall regime sufficiently detailed to describe the variability of rainfall events.
Figure 4c shows the graphical representation of the values of the CNS coefficient of the calibration of all
stations jointly with each individual calibrated station. Analyzing this figure, it can be seen that for both types of calibration, CNS values showed an increasing behavior in
function of the drainage area of the evaluated stations. For calibration of the jointly stations, the CNS values ranged
from 0.39 to 0.73. For the Barroso station the CNS values
was 0.59 which is classified as good, and for the Ibituruna station, 0.73, which is classified as very good, according to criteria used in this study (Moriasi et al., 2007).
In the calibration based on individual stations, the Barroso station obtained a CNS of 0.70, the Ibituruna
station, 0.76, which are classified as very good. For the
Figure 4: Graphical representation of the values of the precision statistics, P-factor (a), R-factor (b), CNS -
Nash-Sutcliffe coefficient (c), and PBIAS - percent bias (d) obtained in the calibration considering all the fluviometric
Campolide station we obtained a value of 0.57, which is classified as good (Figure 4c). Despite the CNS value for
the Campolide station having been satisfactory, when the other results of precision statistics are evaluated (PBIAS, P-factor and R-factor), it is found that they are inadequate. Thus, this demonstrates the importance of evaluating the overall results, characterized by several statistical coefficients and uncertainty analysis, and not by an isolated precision statistical value. According to Abbaspour (2015) there is a close relationship between calibration and uncertainty, thus in studies involving stochastic calibration,
the evaluation of this set of information is important.
Analyzing the percent bias (PBIAS) for calibration of the stations jointly, it is observed that most of the stations were within the class values considered adequate, except for the Campolide station since it showed a value of 41.3%, a result that is considered inappropriate. For the Porto dos Elvas, Barroso and Ibituruna stations calibrations were classified as very good, that is, values of |PBIAS| < 10%.
For the Usina (SJDR) and Vila do Rio das Mortes stations, calibration is classified as good, that is, values in the range of 10% < |PBIAS| < 15% (Figure 4d). The stations (SJDR)
and Mortes Rio Village calibration were classified as good, that is, values in the 10% range <| PBIAS | <15% (Figure 4d).
For the station calibration individually, the same behavior for most stations was observed, except for the Campolide station which had a value of 29.2%, which was inadequate. For all other stations evaluated, calibration was classified as very good, that is, values of |PBIAS| < 10% (Figure 4d).
Piniewski and Okruszko (2011) studied the
behavior of the drainage area with regard to calibration and validation of 12 sub-basins ranging from 355 to 1,657 km2, in a watershed located in Northeastern Poland.
For both evaluations, the authors concluded that the model was better in large watersheds and that the model should not be used for areas lesser than 600 km2, under
the conditions studied by the authors.
Thus, for the watershed under study, it can be concluded that the calibration of fluviometric stations in an individual way, when compared with the calibration of the stations jointly resulted into a small gain in the quality of CNS coefficient adjustment for all drainage areas. In
summary, for the watershed under study, the SWAT model performed better in the calibration of the station in an individual mode than for calibration of the stations jointly.
Noor et al. (2014) evaluated the calibration performance of a station compared with the calibration of several stations inside the same watershed in Iran with drainage areas ranging from 805 to 48 km2. The authors
concluded that the calibration based on a single station and based on several stations generated acceptable de CNS values.
According to Daggupati et al. (2015) use of a single location to calibrate large watersheds can result in calibrated parameters that represent the mean of the
characteristics in the watershed as a whole or present a
combination of over or underestimated values that result
into poor spatial accuracy within the watersheds. This may be undesirable for simulations of larger watersheds that are more spatially heterogeneous.
Therefore, when working with large watersheds, it becomes important to use more than one fluviometric station in the calibration process to assess whether the
use of one or more stations results in differences in the performance of the simulation.
Strategy 4: SWAT performance associated with the number of stations applied in the calibration and respective drainage areas
Aiming to evaluate the performance of SWAT as to the number of fluviometric stations applied in the calibration and respective watersheds we conducted combinations of fluviometric sections for calibration and model testing. The sections of Ibituruna, Barroso and Vila Rio das Mortes were considered for the calibration. While the other fluviometric stations in the watershed were used
to test the model’s performance.
The results are shown in Figure 5 where it can be seen that the model is sensitive to the settings analyzed. When comparing the results obtained from the jointly calibration
of the two stations with larger drainage areas (Ibituruna Da
= 6070 km2 and Barroso 1040 km2) with the combination
of the stations including larger and smaller drainage area (Ibituruna Da = 6070 km2 and Vila do Rio das Mortes Da =
272), it was observed by the CNS coefficient values that there was a gain in the fit quality for the other stations. This was especially noticiable for the Porto do Elvas (828 km2) and
Barroso (1040 km2), which presented C
NS values of 0.45 and
0.69, respectively. That shows that the model presents a good predictive ability for smaller drainage areas, when combining the larger drainage area stations in the calibration process.
Still analyzing Figure 5, it is observed by the results obtained that the SWAT model presents difficulty of simulation smaller drainage areas. According to Piniewski and Okruszko (2011) some of the possible reasons that can explain this
performance of the model are that in small upstream
the spatial heterogeneity becomes smaller and that super- and under-estimation of streamflow in small upstream watersheds may to do averaging in the downstream watershed. Uzeika et al. (2012) also report that the main limitation of SWAT to represent the variables in daily time scale is related to short and fast rain events, which occur in small watersheds.
Considering the importance of managing water resources inside a watershed, we can highlight the results obtained when combining stations with larger drainage areas. These analyses are important, especially considering the Brazilian conditions, where there is a lack of information of the hydrometric network many times, with insufficient or no data, as in the case of watersheds with small drainage areas, located in upstream regions. Fukunaga et al. (2015) pointed out that SWAT hydrological model is a useful tool to be applied to simulate streamflow for tropical watersheds under low availability of environmental data, especially
meteorological data.
Strategies 5: Calibration considering the station of smallest drainage area
Aiming to evaluate the predictive capacity of
SWAT in representing areas with larger drainage area, we proceeded using the calibration of the Vila do Rio das Mortes station, which presents the smallest drainage area
of the watershed (Da = 272 km2). The other fluviometric stations present in the watershed were utilized to test the performance of the model.
In analyzing the results presented in Figure 6 it can be observed that calibration with the station with the smallest drainage area resulted in good performance of the model, except fir values of the CNS coefficient obtained, for the Campolide, Barroso and Ibituruna stations, which presented values of CNS coefficient of 0.50, 0.61 and 0.65 respectively, being classified as “satisfactory” for the first station and as “good” for other two. These results show that the model presents good predictive capacity to represent areas with larger drainage areas, therefore, a potential tool for management, even when the calibration watershed is smaller, as in this case.
Development of the permanence curves
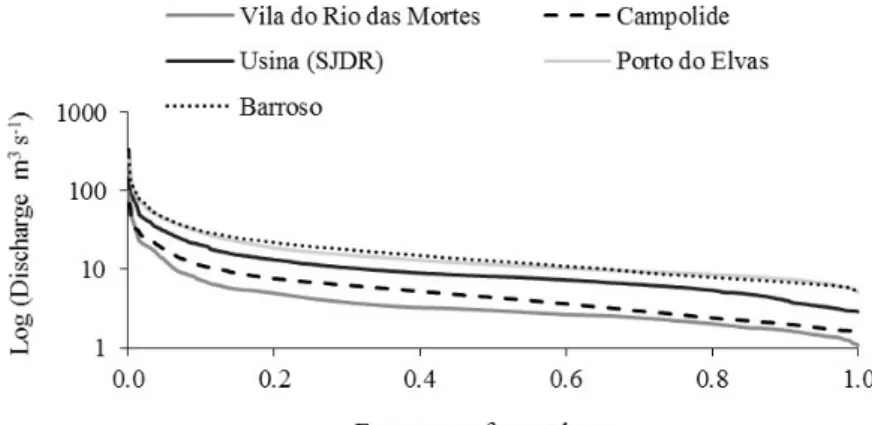
The curve of permanence provides the frequency with which determined streamflow is exceeded, having as the main functionality a determination of minimum streamflow of reference for a location, for water resource management (Viola et al., 2012).
In order to demonstrate the applicability of the work for water management purposes, permanence curves of streamflow for the sub-basins studied were developed, using strategy 4.1 as a basis which was the
one which presented the best performance of the model,
when associated with the two stations with the larger drainage area of the watershed. A reference value often
extracted from this curve is the Q90%, which represents the streamflow surpassed or equaled by 90% of the time. For the curves presented in Figure 7, the simulated values of Q90% were of 1.68, 2.02, 4.04, 7.47 and 6.90 m³ s-1 for the Vila do Rio das Mortes, Campolide,
Usina (SJDR), Porto do Elvas and Barroso sub-basins, respectively.
Andrade, Mello and Beskow (2013) showed that when it comes to the estimate of reference streamflow for a location there is a series of limitations for small watersheds,
since the availability of hydrological data of streamflow is limited or practically inexistent at this scale in Brazil.
For Fukunaga et al. (2015) the SWAT model has the potential to be used as a useful tool for water resource management, especially when applied to two of the most important instruments of Brazilian water resource policy
which are the concession of water resource use rights and charging for the use of water resources.
In that way, the results obtained in this work
demonstrate the importance of the development of methodologies which seek to give support for water
resource management, highlighting its need in small
watersheds without data.
Figure 6: Graphical representation of the Nash Coefficient values (CNS) obtained in the evaluation of the calibration and test SWAT model in function of the drainage area of the stations, considering as the calibration section the stations of the smallest area in the watershed.
CONCLUSIONS
The results obtained from the statistical indices applied in the model performance analysis found the hydrological SWAT model as appropriate for the
simulation of the streamflow in the Mortes River
watershed. The SWAT model was sensitive to the size of the drainage area, showing good results when combining the larger drainage area stations in the calibration process. The adopted strategies confirmed the applicability of
the model as a management and planning tool of water resources for smaller watersheds without data. The use
of the SWAT model in the Mortes River watershed can provide a better understanding of hydrological processes
and can provide support for planning and decision making
related to water resource management, especially for smaller watersheds without data, enabling the rational use
of water in the watershed.
ACKNOWLEDGEMENTS
We would like to thank the CAPES Foundation for the Ph.D. sandwich scholarship of the first author at Purdue University. The authors also thank CNPq, FAPEMIG, UFLA and Purdue University for the necessary support.
REFERENCES
ABBASPOUR, K. C. SWAT-CUP: SWAT Calibration and Uncertainty Programs - A User Manual. Swiss Federal Institute of Aquatic Science and Technology, EAWAG. 2015. 100 p.
ABBASPOUR, K. C.; JOHNSON, C. A.; GENUCHTEN, M. T. V. Estimating uncertain flow and transport parameters using a sequential uncertainty fitting procedure. Vadose Zone Journal, 3(4):1340-1352, 2004.
ABBASPOUR, K. C. et al. Modelling hydrology and water quality in the pre-alpine/alpine Thur watershed using SWAT.
Journal of Hydrology, 333:413-430, 2007.
ANDRADE, M. A.; MELLO, C. R.; BESKOW, S. Simulação hidrológica em uma bacia hidrográfica representativa dos Latossolos na região Alto Rio Grande, MG. Revista Brasileira de Engenharia Agrícola e Ambiental, 17(1):69-76, 2013.
ARAGÃO, R. de et al. Análise de sensibilidade dos parâmetros do modelo SWAT e simulação dos processos hidrossedimentológicos em uma bacia no agreste nordestino.
Revista Brasileira de Ciência do Solo, 37:1091-1102, 2013.
ARNOLD, J. G. et al. Large area hydrologic modeling and assessment: part I. Model development. Journal of the American Water Resources Association, 34(1):73-89, 1998.
BDMEP: Banco de dados, 2014. Available in: <http://www.inmet. gov.br/projetos/rede/pesquisa/>. Access in: May, 12, 2014.
BONUMÁ, N. B. et al. Modeling surface hydrology, soil erosion, nutrient transport, and future scenarios with the ecohydrological swat model in brazilian watersheds and river basins. In: NASCIMENTO, C.W.A. do. et al. Tópicos em ciência do solo. Viçosa, MG, Sociedade Brasileira de Ciência do Solo, 9:241-290, 2015.
BOURAOUI, F. et al. Impact of climate change on the water cycled and nutrient losses in a Finnish catchment. Climatic Change, 66(1):109-126, 2004.
BRESSIANI, D. A. et al. A review of SWAT (Soil and Water Assessment Tool) applications in Brazil: challenges and prospects. International Journal of Agricultural and Biological Engineering, 8(3):9-35, 2015a.
BRESSIANI, D. A. et al. Effects of different spatial and temporal weather data resolutions on the streamflow modeling of a semi-arid basin, Northeast Brazil. International Journal of Agricultural and Biological Engineering, 8(3):125-139, 2015b.
CURI, N.; CHAGAS, C. S.; GIAROLA, N. F. B. Distinção de ambientes agrícolas e relação solo-pastagens nos Campos da Mantiqueira (MG). In: CARVALHO, M. M.; EVANGELISTA, A. R.; CURI, N. Desenvolvimento de pastagens na zona fisiográfica Campos das Vertentes -MG. Coronel Pacheco, Embrapa Gado de Leite, 1994. 127p.
DAGGUPATI, P. et al. Impact of model development, calibration and validation decisions on hydrological simulations in West Lake Erie Basin. Hydrological Processes, 29(26):5307-5320, 2015.
DURÃES, M. F.; MELLO, C. R.; NAGHETTINI, M. Applicability of the SWAT model for hydrologic simulation in Paraopeba River Basin, MG. Cerne, 17(4):481-488, 2011.
FUKUNAGA, D. C. et al. Application of the SWAT hydrologic model to a tropical watershed at Brazil. Catena, 125:206-213, 2015.
FUNDAÇÃO ESTADUAL DO MEIO AMBIENTE - FEAM. Mapa de solos do estado de Minas Gerais. Belo Horizonte: FEAM, 2010. Available in: <http://www.feam.br/noticias/1/949-mapas-de-solos-do-estado-de-minasgerais> Access in: March, 27, 2014.
GASSMAN, P. W. et al. The soil and water assessment tool: Historical development, applications, and future research directions.
Transactions of the ASABE, 50(4):1211-1250, 2007.
GRIENSVEN, A. V. et al. A global sensitivity analysis tool for the parameters of multi-variable catchment models. Journal of Hydrology, 304(1):10-23, 2006.
GUPTA, H. V.; SOROOSHIAN, S.; YAPO, P. O. Status of automatic calibration for hydrologic models: Comparison with multilevel expert calibration. Journal of Hydrologic Engineering, 4(2):135-143, 1999.
HIDROWEB: Banco de dados, 2014. Available in: <http:// hidroweb.ana.gov.br/> Access in: March, 12, 2014.
LELIS, T. A.; CALIJURI, M. L. Modelagem hidrossedimentológica de bacia hidrográfica na região sudeste do Brasil, utilizando o SWAT. Revista Ambiente & Água, 5(2):158-174, 2010.
LELIS, T. A. et al. Análise de sensibilidade e calibração do modelo SWAT aplicado em bacia hidrográfica da região Sudeste do Brasil. Revista Brasileira de Ciência do Solo, 36(2):623-634, 2012.
LESSA, L. G. F. et al. Modelo hidrológico SWAT na determinação das perdas de solo na bacia hidrográfica do rio Pardo – Botucatu/SP. Energia na Agricultura, 28(3):170-178, 2013.
MELO NETO, J. O. et al. Simulação hidrológica escalar com o modelo SWAT. Revista Brasileira de Recursos Hídricos, 19(1):177-188, 2014.
MORIASI, D. N. et al. Model evaluation guidelines for systematic quantification of accuracy in watershed simulations.
Transactions of the ASABE, 50(3):885-900, 2007.
NASH, J. E.; SUTCLIFFE, J. V. River flow forecasting through conceptual models: a discussion of principles. Journal of Hydrology, 10(3):282-290, 1970.
NEITSCH, S. L. et al. Soil and water assessment tool: theoretical documentation - version 2009. SERVICE., G-S. A. W. R. L. - A. R. Texas - USA. 2011. 647p.
NOOR, H. et al. Comparison of single-site and multi-site based calibrations of SWAT in Taleghan watershed, Iran.
International Journal of Engineering, 27(11):1645-1652,
2014.
PAIM, J. B.; MENEZES, J. T. de. Estimativa do balanço sedimentar da bacia do rio Tijucas (SC-Brasil) a partir da aplicação do modelo hidrológico SWAT. Revista Geográfica
Acadêmica, 3(2):5-14, 2009.
PEREIRA D. R. et al. Hydrological simulation using SWAT
model in headwater basin in Southeast Brazil. Revista
Engenharia Agrícola, 34(4):789-799, 2014.
PINIEWSKI, M.; OKRUSZKO, T. Multi-site calibration and validation
of the hydrological component of SWAT in a large lowland catchment. In: SWIATEK, D.; OKRUSZKO, T. (Eds.) Modelling of hydrological processes in the Narew catchment.
Geoplanet: Earth and Planetary Sciences, 2011. p.15-41.
PINTO, D. B. F. et al. Application of the Soil and Water Assessment Tool (SWAT) for sediment transport simulation at headwater watershed in Minas Gerais state, Brazil.
Transactions of the ASABE, 56(2):697-709, 2013.
RODRIGUES, E. L. et al. Impact of changes in land use in the flow of the Pará River Basin, MG. Revista Brasileira de Engenharia Agrícola e Ambiental, 19(1):70-76, 2015.
SOARES, P. A. et al. Estimativa da disponibilidade hídrica
em pequenas bacias hidrográficas com escassez de dados fluviométricos. Revista de Estudos Ambientais, 12(1):29-38, 2010.
UZEIKA, T. et al. Use of the swat model for hydro-sedimentologic
simulation in a small rural watershed. Revista Brasileira
de Ciência do Solo, 36(2):558-566, 2012.
VAN LIEW, M. W. et al. Suitability of SWAT for the conservation effects assessment project: a comparison on USDA-ARS watersheds. Journal of Hydrological Research,
12(2):173-189, 2007.
VIOLA, M. R. et al. Hydrologic modeling in the Aiuruoca
River basin, Minas Gerais state. Revista Brasileira de
Engenharia Agrícola e Ambiental, 13(5):581-590, 2009.
VIOLA, M. R. et al. Modelagem hidrológica em uma sub-bacia hidrográfica do baixo rio Araguaia, TO. Journal of Biotechnology and Biodiversity, 3(3):38-47, 2012.
WHITE, K. L.; CHAUBEY, I. Sensitivity analysis, calibrations, and
validation for a multisite and multivariate SWAT model.
Journal of the American Water Resources Association, 41(5):1077-1089, 2005.
ZHANG, H. G. et al. Potential effects of climate change on runoff in the Yellow River basin of China. Transactions of the