AQG and DVC contributed equally to this manuscript. Acknowledgments: the authors thank Serviço de Anatomia Patológica and Serviço de Hematologia of HSM-CHLN, and Serviço de Pediatria and Serviço de Hematologia of IPOLFG, for provision of tumor samples;
and Dr. José Cabeçadas for helpful discussions.
Funding: this work was support-ed by the European Molecular Biology Organization (YIP Installation Grant to BS-S), Fundação Calouste Gulbenkian (SDH Oncologia 2008 - Projecto 99293) and Fundação para a Ciência e Tecnologia/FCT (PTDC/BIA-BCM/71663/2006). Manuscript received on December 3, 2009. Revised version arrived on January 26, 2010. Manuscript accepted on February 11, 2010.
Correspondence: Bruno Silva-Santos, Unidade de Imunologia Molecular, Instituto de Medicina Molecular, Faculdade de Medicina da Universidade de Lisboa, Avenida Professor Egas Moniz, 1649-028 Lisboa, Portugal.
E-mail: [email protected] The online version of this article has a Supplementary Appendix.
Background
Vγ9Vδ2 T lymphocytes are regarded as promising mediators of cancer immunotherapy due to their capacity to eliminate multiple experimental tumors, particularly within those of hematopoietic origin. However, Vγ9Vδ2 T-cell based lymphoma clinical trials have suffered from the lack of biomarkers that can be used as prognostic of therapeutic success.
Design and Methods
We have conducted a comprehensive study of gene expression in acute lymphoblastic leukemias and non-Hodgkin’s lymphomas, aimed at identifying markers of susceptibility ver-sus resistance to Vγ9Vδ2 T cell-mediated cytotoxicity. We employed cDNA microarrays and quantitative real-time PCR to screen 20 leukemia and lymphoma cell lines, and 23 primary hematopoietic tumor samples. These data were analyzed using state-of-the-art bioinformatics, and gene expression patterns were correlated with susceptibility to Vγ9Vδ2 T cell mediated cytolysis in vitro.
Results
We identified a panel of 10 genes encoding cell surface proteins that were statistically differen-tially expressed between “γδ-susceptible” and “γδ-resistant” hematopoietic tumors. Within this panel, 3 genes (ULBP1, TFR2 and IFITM1) were associated with increased susceptibility to Vγ9Vδ2 T-cell cytotoxicity, whereas the other 7 (CLEC2D, NRP2, SELL, PKD2, KCNK12, ITGA6 and SLAMF1) were enriched in resistant tumors. Furthermore, some of these candidates displayed a striking variance of expression among primary follicular lymphomas and T-cell acute lymphoblastic leukemias.
Conclusions
Our results suggest that hematopoietic tumors display a highly variable repertoire of surface proteins that can impact on Vγ9Vδ2 cell-mediated immunotargeting. The prognostic value of the proposed markers can now be evaluated in upcoming Vγ9Vδ2 T cell-based lymphoma/leukemia clinical trials.
Key words: biomarkers, Vγ9Vδ2 T-lymphocytes, hematopoietic tumors, lymphoma cell lines.
Citation: Gomes AQ, Correia DV, Grosso AR, Lança T, Ferreira C, Lacerda JF, Barata JT, Gomes da Silva M, and Silva-Santos B. Identification of a panel of ten cell surface protein antigens asso-ciated with immunotargeting of leukemias and lymphomas by peripheral blood γδ T cells.
Haematologica 2010;95(8):1397-1404. doi:10.3324/haematol.2009.020602 ©2010 Ferrata Storti Foundation. This is an open-access paper.
Identification of a panel of ten cell surface protein antigens associated with
immunotargeting of leukemias and lymphomas by peripheral blood
γδ T cells
Anita Q. Gomes,1,2,3Daniel V. Correia,1,2Ana R. Grosso,1Telma Lança,1Cristina Ferreira,4 João F. Lacerda,4João T. Barata,1 Maria Gomes da Silva,5and Bruno Silva-Santos1,2
1Instituto de Medicina Molecular, Faculdade de Medicina da Universidade de Lisboa; 2Instituto Gulbenkian de Ciência, Oeiras; 3Escola Superior de Tecnologia da Saúde de Lisboa, and 4Hospital de Santa Maria-CHLN, Lisboa, and 5Instituto Português de
Oncologia de Lisboa, Francisco Gentil, Portugal
Introduction
γδ T lymphocytes display potent innate anti-tumor activity in both humans1and mice.2,3For example, mice genetically devoid of γδ T cells displayed increased sus-ceptibility to skin tumor development induced experi-mentally by carcinogens,2,3and to transgenic adenocarci-noma of the mouse prostate model (TRAMP).4 More importantly, murine γδ T cells were shown to prevent (through perforin-mediated cytotoxicity) the develop-ment of spontaneous B-cell lymphomas.5
The major γδ T-cell subset in human peripheral blood, Vγ9Vδ2 T lymphocytes, exert potent cytotoxicity towards tumor cell lines upon activation with small non-peptidic prenyl pyrophosphate intermediates of iso-prenoid biosynthesis.6We and others have shown that, among such “phosphoantigens”, 4-hydroxy-3-methyl-but-2-enylpyrophosphate (HMB-PP), a metabolite found in Eubacteria and Protozoa, is a very potent agonist of the Vγ9Vδ2 T-cell receptor (TCR) that promotes cytotoxicity and the secretion of anti-tumor cytokines such as inter-feron-γ (IFN-γ) and tumor necrosis factor α (TNF-α).6,7
Phosphoantigen-activated Vγ9Vδ2 T cells can kill vari-ous solid tumor cell lines,1and a particularly large num-ber of hematopoietic cell-derived tumors,7-9 as well as freshly isolated tumor cells from patients with follicular B-cell lymphoma or chronic lymphocytic leukemia (CLL).10
The well-established anti-tumor activity of Vγ9Vδ2 T cells has been recently explored in clinical trials for solid/epithelial11-13 or liquid/hematopoietic tumors (14-16), which were collectively promising even though they showed limited success. The lack of response to therapy of some patients was attributed to deficient expansion of effector Vγ9Vδ2 T cells.11,13,14However, a large proportion of patients exhibiting significant and sustained in vivo activation and proliferation of Vγ9Vδ2 T cells also failed to respond to treatment. Thus, in both prostate carcino-ma11and non-Hodgkin’s lymphoma,14objective respons-es (partial remissions) were observed in just 33% of the patients who activated/expanded their Vγ9Vδ2 T cells. These data emphasize the need for tumor biomarkers with prognostic value for γδ peripheral blood lympho-cyte (γδ-PBL)-mediated immunotherapy.
Here we have conducted a comprehensive genome-wide expression study aimed at identifying lymphoma/leukemia markers of susceptibility or resist-ance to γδ-PBL cytotoxicity. We set up an experimental system consisting of lymphoma/leukemia cell lines with various degrees of susceptibility to γδ-PBL-mediated lysis, and performed comparative cDNA microarray analyses to characterize their gene expression profiles. These were validated through bioinformatics and quan-titative real-time PCR (RT-qPCR), allowing us to define a panel of 10 candidate biomarkers whose expression dis-played very marked variability among non-Hodgkin’s lymphoma and acute lymphoblastic leukemia patients.
Design and Methods
In vitro cultures of human
γδ-PBL and tumor cell lines
Peripheral blood was collected from healthy volunteers and peripheral blood mononuclear cells (PBMCs) were isolated as pre-viously described.7γδ−PBL were expanded from isolated PBMCs
for 12 days in RPMI 1640 complete media7 supplemented with
100 U/mL of rhIL-2 (Roche Applied Science) and 1 nM HMB-PP (4-hydroxy-3-methyl-but-2-enylpyrophosphate) (Sup-RPMI). The percentage of Vγ9+T cells in peripheral blood increased from
3-14% at day 0 to 90-98% at day 12 (Online Supplementary Figure S1). All tumor cell lines were cultured in complete 10% RPMI-1640 as previously described.7
Leukemia and lymphoma primary samples
Pediatric B- or T-cell acute lymphoblastic leukemia cells contain-ing high (> 80%) leukemia involvement were obtained from the peripheral blood and/or the bone marrow of patients at presenta-tion after informed consent and institupresenta-tional review board approval (Instituto Português de Oncologia, Lisbon, Portugal) had been obtained. Fresh leukemia samples were enriched by density centrifugation over Ficoll-Paque and then washed twice in 10% RPMI-1640 medium supplemented with 2 mM L-glutamine (Sup-RPMI). For lymphoma biopsies, lymph nodes were surgically removed, immediately frozen in liquid nitrogen and kept at -80ºC until further use (Department of Pathology, Hospital de Santa Maria, CHLN, Lisbon, Portugal). Upon diagnosis, we selected lymph nodes from lymphoma cases and reactive lymph nodes for our studies.
In vitro killing assays
For cytotoxicity assays, tumor cells (cell lines or primary sam-ples) were stained with DDAO-SE (Molecular Probes, Invitrogen) and incubated at a ratio of 1:10 with γδ T cells in Sup-RPMI. Typically, 3¥105HMB-PP-activated γδ-PBL (>90% Vγ9+) were
co-incubated with 3¥104tumor cells (pre-labeled with 1 μM
DDAO-SE) for 3-4h, then stained with Annexin V-FITC (BD Biosciences) and analyzed by flow cytometry.
RNA isolation, RT-qPCR and Affymetrix Microarrays
Total RNA from tumor cell lines was extracted using the RNeasy Mini Kit according to the manufacturer’s instructions (Qiagen, Hilden, Germany). RNA from leukemia cells and samples was extracted with TRIzol Reagent (Invitrogen) and purified with RNeasy Mini Kit according to the manufacturer’s instructions. Concentration and purity was determined by spectrophotometry and integrity was confirmed using an Agilent 2100 Bioanalyzer with an RNA 6000 Nano Assay (Agilent Technologies, Palo Alto, CA, USA). Total RNA was reverse-transcribed into cDNA as pre-viously described.7 qPCR was performed on Rotor-Gene 6000(Corbett) using SYBR Green detection system (PE Applied Biosystems). Glucoronidase beta (GUSB) and proteasome subunit beta type 6 (PSMB6) were used as endogenous controls in relative quantification using the standard curve method. Primers were designed using the Roche Design Centre (for sequences see Online Supplementary Table S1).
For genome-wide analyses, RNA from two independent cul-tures of each cell line (DAUDI, RAJI, RCH-ACV and 697) was processed for use on Affymetrix (Santa Clara, CA, USA) GeneChip HuGene 1.0 ST Arrays, according to the manufacturer’s Whole Transcript Sense Target Labeling Assay.
Microarray data analysis
All the microarray data analysis was performed with R and sev-eral packages available from CRAN17and Bioconductor.18The raw
data (CEL files) were normalized and summarized with the Robust MultiArray Average method from the “affy” package.19
Unsupervised clustering analysis of the gene expression profiles for entire probe set data was assessed through hierarchical cluster-ing (Euclidean distance and complete agglomeration method) and principal component analysis (prcomp function which calls a
sin-gular value decomposition method for non-symmetric matrices) as implemented in the statistical computing package.17
Differentially expressed genes for each comparison were selected using linear models and empirical Bayes methods20as
implement-ed in the Limma package,21verifying the P values corresponding to
moderated F-statistics, and selecting as differentially expressed genes those that had adjusted P values adjusted using the Benjamini and Hochberg method22lower than 0.05.
The enrichment of biological functions and pathways was ana-lyzed using Ingenuity Pathway Analysis software (Ingenuity Systems, Mountain View, CA, USA) and all genes present in the Affymetrix Human Gene 1.0 ST as control.
Results
Highly variable susceptibility of acute leukemias and
non-Hodgkin’s lymphomas to
γδ-PBL cytotoxicity
In our laboratory we have studied a collection of 23 samples of acute lymphoblastic leukemias and non-Hodgkin’s lymphomas, and a panel of 20 tumor cell lines of hematopoietic origin. The latter included acute lym-phoblastic leukemia (ALL) (JURKAT, MOLT4, RCH-ACV, 697, CEM, TOM-1, RS4-11, B15, REH, Bv173) and acute myelogenous leukemia (AML) (HL-60, HEL, THP-1) cell lines; and non-Hodgkin Burkitt’s (DAUDI, RAJI, RAMOS), follicular (DOHH2) and lymphoblastic (Oz) lymphoma cell lines (for detailed description of these cell lines see Online Supplementary Table S2). Although the capacity of peripheral blood γδ T cells to target multiple
tumor cell lines of hematopoietic origin is well docu-mented,7-9we observed that a substantial fraction of cell lines (Figure 1A and B) and patient samples (Figure 1A and data not shown) were strikingly resistant to γδ-PBL (obtained from healthy donors) pre-activated (as illus-trated by high CD69 levels) with HMB-PP, the most potent natural Vγ9Vδ2 T-cell activator known to date (6, 7) (Online Supplementary Figure S1). For example, the B-ALL cell lines Bv173, REH and 697 (Figure 1 A and B), and six primary samples obtained from B-ALL patients (Figure 1A and data not shown) remained mostly alive (Annexin V-) in co-cultures with fully-activated (100% CD69+; data not shown) γδ-PBL. Similar data were obtained with primary T-ALL samples and the cell line CEM (Figure 1A). This resistance to γδ-PBL cytotoxicity contrasted sharply with the extensive killing observed for the B-ALL line RCH-ACV and the T-ALL line MOLT-4 (Figure 1A), among various other hematopoietic tumors (Figure 1B).
For systematic analysis of our killing assay data, we considered tumor samples with over 70% lysis as sus-ceptible to γδ-PBL-mediated lysis (“γδ-sussus-ceptible”), and those under 30% lysed as “γδ-resistant”. Importantly, susceptibility was independent of the γδ-PBL donor, as the pattern of susceptible/resistant lines was equivalent for 3 independent healthy donors (Online Supplementary Figure S2A). Moreover, the differences in susceptibility to γδ T cells were maintained when tumor cell lines were incubated with γδ T cells activated for a shorter time (12h) (Online Supplementary Figure S2B), further support-ing the segregation between susceptible and resistant cell
Figure 1. Differential susceptibility of leukemia and lymphoma cells to γδ-PBL cytotoxicity. (A) Annexin V staining for apop-totic tumor cells after 4 h of co-incubation with HMB-PP-activated γδ-PBL. Tumors were B-ALL (left panels) or T-ALL (right panels) cells, either primary samples or the indicat-ed cell lines. (B) Summary of killing assays (as in A) with 20 leukemia or lymphoma cell lines (described in Online Supplementary Table S2). Error bars correspond to triplicate assays. (C) Effect of increasing concentra-tions of H2O2 on leukemia/lymphoma cell
apoptosis (% Annexin V+). A B C B-ALL T-ALL Primary biopsy Primary biopsy CEM MOLT-4 Annexin V - γδ + γδ MOL T-4 DOHH2 K562JURKA T
NALM-6HL-60 DAUDIRCH-ACV HEL THP-1 RAMOS B-15 HPB-ALL 697 BV173RS4-11 RAJI REH OZ CEM
MOLT-4 JURKAT RAJI REH
0 μM H202 8.7 μM H202 87 μM H202 % Annexin-V + % Annexin-V + 100 75 50 25 0 100 80 60 40 20 0 RCH-ACV 697
lines. As primary samples to reproduce and expand experiments aimed at dissecting the molecular mecha-nisms of tumor susceptibility to γδ-PBL cytotoxicity are difficult to obtain, we focused on our well-established panel of cell lines for the initial candidate searches and later extended our findings to patient samples.
We first considered that tumor resistance to γδ-PBL cytotoxicity could stem from intrinsic anti-apoptotic mechanisms developed by some leukemia/lymphoma cell lines. However, when we tested the effect of a pro-apoptotic stimulus (H2O2) we observed no association between resistance to apoptosis and to γδ-PBL cytotoxi-city. Namely, the cell lines Jurkat (γδ-susceptible) and REH (γδ-resistant) were more sensitive to non-saturating concentrations of H2O2 than the cell lines MOLT-4 (γδ-susceptible) and RAJI (γδ-resistant) (Figure 1C). This sug-gests that susceptibility to γδ-PBL cytotoxicity is not related to the response to other death stimuli and proba-bly involves a specific protein expression program (involved in tumor/γδ-PBL interactions) that we set out to characterize.
Genome-wide comparisons between
γδ-susceptible and
γδ-resistant hematopoietic tumors
The observed differences in susceptibility γδ-PBL cyto-toxicity among hematopoietic tumors emphasize the importance of defining gene signatures that may predict the effectiveness of γδ T-cell based immunotherapies in the clinic. We performed a genome-wide analysis aimed at comparing the mRNA expression profiles of γδ-sus-ceptible and γδ-resistant tumors. We employed cDNA microarrays to examine two pairs of hematopoietic tumor cell lines sharing the same cytogenetic alterations and cellular phenotypes (Online Supplementary Table S2): the Burkitt’s lymphomas DAUDI (susceptible) and RAJI (resistant), and the B-ALL lines RCH-ACV (susceptible) and 697 (resistant).
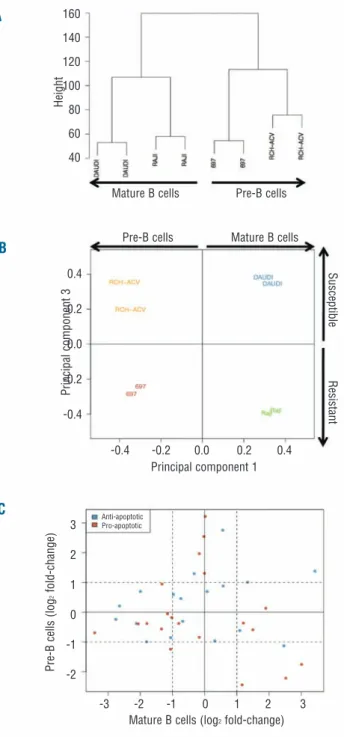
First, samples were grouped according to the similarity of gene expression patterns using unsupervised cluster-ing analysis (no group specification a priori). Based on the entire probe set data, two main groups could be defined which corresponded to the original cell type (Figure 2A): pre-B (697 and RCH-ACV) and mature B cells (DAUDI and RAJI). We next applied principal component analysis (PCA), which identifies new variables, to the principal components, which are linear combinations of the origi-nal variables (gene expression levels) and represent the largest variation found between samples.23Although the original cell type was the major source of variation between all samples (53.3% of total variation), PCA showed that component 3 was responsible for the segre-gation (16.4% of total variation) according to the suscep-tibility to γδ-PBL cytotoxicity (Figure 2B): susceptible (DAUDI and RCH-ACV) versus resistant (RAJI and 697).
To identify gene expression variations associated with susceptibility to γδ-PBL cytotoxicity, and to suppress the variations due to the transformed cell type (pre-B or mature B cells), we first compared tumors with identical origin, i.e. DAUDI versus RAJI, and RCH-ACV versus 697 (Online Supplementary Tables S3 and S4). We then used Bayesian linear models20and selected the common genes between both analyses: 340 genes (155 up- and 185 down-regulated in γδ-susceptible tumors) presented sim-ilar gene expression variations and were considered for
further analysis (Online Supplementary Table S5). Bioinformatics analysis revealed an enrichment for func-tions related to cell-to-cell signaling and interaction, hematologic system development and function, immune
Figure 2. Comparison of gene expression in tumor cell lines suscep-tible or resistant to γδ-PBL cytotoxicity. Bioinformatics analyses of cDNA microarray comparisons between the Burkitt’s lymphomas DAUDI and RAJI; and the B-ALL lines RCH-ACV and 697. (A) Unsupervised hierarchical clustering analysis. Samples with similar gene expression patterns are grouped together and connected with branches, producing a clustering tree (or dendrogram) on which the branch length inversely reflects the degree of similarity between samples. (B) Principal Component Analysis. The samples are plot-ted according to the first and third principal components (corre-sponding to the largest variation found between samples). (C) Variations in expression levels of anti- or pro-apoptotic genes in sus-ceptible versus resistant tumor cell lines. Dashed lines indicate 2 fold-changes (in logarithmic scale) in the expression ratio suscepti-ble/resistant.
A
B
C
Mature B cells Pre-B cells 160 140 120 100 80 60 40 0.4 0.2 0.0 -0.2 -0.4 3 2 1 0 -1 -2 Height Principal component 3 Pre-B cells (log 2 fold-change)
Pre-B cells Mature B cells
Susceptible
Resistant
Principal component 1
Mature B cells (log2fold-change) Anti-apoptotic
Pro-apoptotic
-0.4 -0.2 0.0 0.2 0.4
cell trafficking (P value < 0.05; Online Supplementary Table S6). Some of the top pathways affected were interferon signaling, crosstalk between dendritic cells and natural killer cells, and molecular mechanisms of cancer (P value < 0.05; Online Supplementary Table S7).
The gene expression variations observed also suggest-ed that, consistent with our previous experimental data (Figure 1C), the segregation between susceptible and resistant tumors is not associated with expression of anti- or pro-apoptotic genes (Figure 2C and Online Supplementary Table S8). Thus, up-/down-regulation of pro-/anti-apoptotic genes did not correlate with suscep-tibility to γδ-PBL cytotoxicity. Moreover, apoptotic relat-ed functions and pathways were not enrichrelat-ed in the panel of 340 genes (Online Supplementary Table S7). Based on these results, we favored the hypothesis that suscep-tibility or resistance to γδ-PBL cytotoxicity is conferred by signals presented at the tumor/γδ-PBL interface, i.e. on the surface of leukemia/lymphoma cells.
A set of cell surface proteins segregates between
γδ-susceptible and γδ-resistant leukemia/lymphoma
cell lines
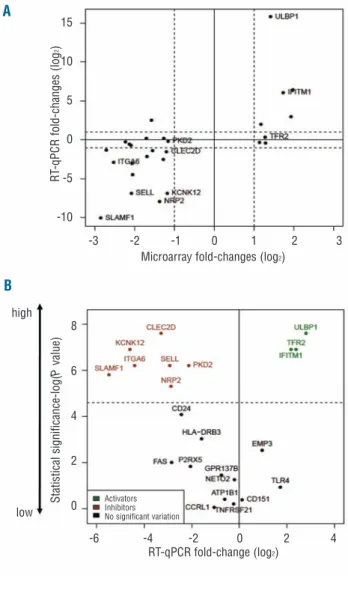
T cells recognize their targets through cell surface anti-gens. We, therefore, focused our analysis of the panel of 340 genes on those encoding plasma membrane proteins (with extracellular domains), using a fold change thresh-old of 2 (log FC >1). These consisted of 8 genes up-regu-lated and 19 genes down-reguup-regu-lated in γδ-susceptible tumors when compared to resistant tumors (Online Supplementary Table S9). The mRNA expression levels of the 27 candidates were assessed by RT-qPCR (in inde-pendent samples) to validate the microarray results. Upon statistical analysis of the data, 22 out of the 27 genes were confirmed as differentially expressed in the two pairs of cell lines used for microarray comparisons: of these, 6 genes were up-regulated and 16 genes were down-regulated in γδ-susceptible tumors (Figure 3A). In order to have more stringent selection criteria, we extended our expression studies to a broader panel of cell lines, including 6 susceptible and 4 resistant cell lines (Online Supplementary Figure S3). This showed 10 genes with significant expression variation between suscepti-ble and resistant tumors (P value < 0.05, Mann-Whitney test) (Figure 3B). Thus, our final panel of candidate mark-ers of susceptibility to γδ-PBL cytotoxicity consisted of 3 genes enriched in γδ-suceptible tumors (ULBP1, TFR2 and IFITM1), and 7 genes enriched in γδ-resistant leukemias/lymphomas (CLEC2D, NRP2, SELL, PKD2, KCNK12, ITGA6 and SLAMF1) (Table 1).
Heterogeneity of expression of candidate markers in
primary leukemia and lymphoma samples
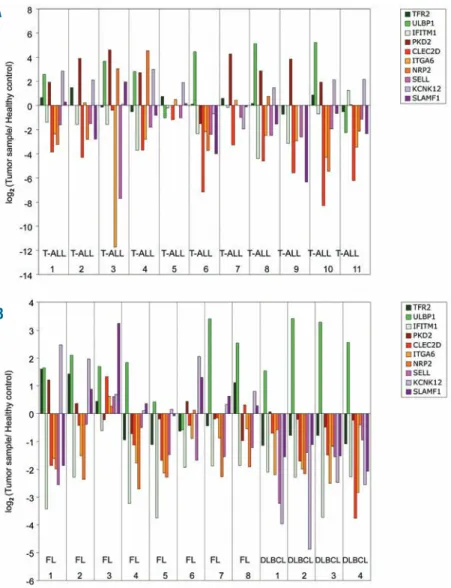
We next determined the expression levels of each candi-date marker in primary samples obtained from T-cell acute lymphoblastic leukemia (T-ALL) and non-Hodgkin’s lym-phoma (NHL) patients. Within the latter group, we sam-pled patients with common indolent (follicular) or aggres-sive (diffuse large B-cell - DLBCL) lymphomas. Gene expression levels in samples were compared with healthy PBMCs (for ALL) and reactive follicles (for NHL), taken as references (0 on log scale) in Figure 4A and B. Hence, a positive or negative (log scale) variation indicates higher or lower expression in tumors than in the control samples, respectively. Overall, the tumors exhibited very variable
gene expression profiles. For example, among susceptibil-ity-associated genes, ULBP1 was over-expressed in a large number of primary samples, while TFR2 was only enriched in three FL samples (FL 1, FL 2 and FL 8), and IFITM1 was strongly depleted in various tumors (Figure 4A and B). On the other hand, all resistance-associated genes were over-expressed in FL sample 3, in contrast to the majority of primary samples analyzed. Moreover, there was no essential difference in some markers, such as ITGA6 or SELL, between the various patients (Figure 4A and B). Collectively, these data revealed a striking hetero-geneity in the expression of particular candidate genes in primary tumors. When compared to our results with tumor cell lines (Online Supplementary Figure S3), these clin-ical data possibly reflect distinct selective pressures on the
Figure 3.Variations in expression of genes encoding cell surface proteins that segregate between γδ-susceptible and γδ-resistant leukemia/lymphoma cell lines. (A) RT-qPCR validation of microarray results for the comparisons of Figure 2. The mRNA expression lev-els were normalized to GUSB and PSMB6 for each cell line. Plotted are the averages of relative expression levels in DAUDI versus RAJI (DAUDI/ RAJI) and RCH-ACV versus 697 (RCH-ACV/ 697). Dashed lines indicate 2 fold-change values (in logarithmic scale). (B) Statistical analysis of RT-qPCR results (detailed in Figure 4) in 6 sus-ceptible and 4 resistant cell lines. Statistical significance was assessed by Mann-Whitney test (-log P value). Dashed line repre-sents the statistical threshold P=0.01.
A
B
Microarray fold-changes (log2)
RT-qPCR fold-change (log2) Activators Inhibitors No significant variation high low 15 10 5 0 -5 -10 8 6 4 2 0 R T -qPCR fold-changes (log 2) Statistical significance-log( P value) -3 -2 -1 0 1 2 3 -6 -4 -2 0 2 4
expression of the genes that compose the candidate panel, the consequence of which should now be evaluated in clinical trials.
Discussion
The success of immunotherapy to tackle tumors, in particular those that prevail after chemo- or radiothera-py, critically depends on two factors: the specific activa-tion of effector anti-tumor lymphocytes and the molecu-lar recognition of tumor cells by activated lymphocytes. Concerning γδ T cells, research over the last 15 years has identified very potent and specific phosphoantigens, most notably HMB-PP,6,7 that seem to fulfill the first requirement. There have been suggestions that phospho-antigens themselves,6,24,25or an F1-ATPase-related struc-ture complexed with delipidated apolipoprotein A-I,26or the non-classical MHC protein ULBP427could be respon-sible for tumor cell recognition by Vγ9Vδ2 PBL. However, despite this, the issue is still highly controver-sial. This naturally impacts on our ability to design effec-tive therapeutic protocols based on γδ-PBL immunotar-geting of tumors. Thus, only 33% of patients with prostate carcinoma11 or non-Hodgkin’s lymphoma14 showed objective responses despite large activation and expansion of their Vγ9Vδ2 T cells in vivo. These consider-ations stress the importance of identifying tumor molec-ular signatures that may predict the response to activat-ed γδ-PBL.
In this study, we set out to identify cell surface proteins involved in interactions between leukemia/lymphoma cells and γδ-PBL. Taking in vitro tumor cytolysis as func-tional readout, we screened a panel of 20 leukemia and lymphoma cell lines that faithfully reproduced the sus-ceptibility/resistance of primary tumors (Figure 1A). The use of cell lines permitted experimental reproducibility and hence statistical robustness for the gene expression undertaken. Upon the identification of candidate mark-ers, we analyzed their expression in 23 samples derived from T-ALL and NHL (FL and DLBCL) patients.
The choice of cDNA microarrays as screening tools
was based on a multiplicity of previous studies that demonstrated how powerful and reliable they are in defining cancer molecular signatures.28Our analyses led to the identification of a large panel of genes differential-ly expressed between “γδ-susceptible” and “γδ-resistant” tumors. Importantly, we verified that there was no cor-relation between intrinsic anti-apoptotic properties and resistance to γδ-PBL cytotoxicity, both in terms of gene expression and response to a death stimulus. Thus, sus-ceptibility or resistance to γδ-mediated lysis is more like-ly to be related to tumor recognition and immune eva-sion strategies, the molecular basis of which remains to be clarified. Of note, MHC class Ia expression did not consistently segregate between susceptible and γδ-resistant tumor cell lines (Online Supplementary Figure S4). For example, among susceptible lines, DAUDI and MOLT-4 expressed very low or undetectable levels, whereas JURKAT and RCH-ACV displayed high levels of surface MHC class I (Online Supplementary Figure S4). These data exclude a mechanism of “missing self” as the basis for γδ T-cell recognition of hematopoietic tumors.
Building upon stringent biological and statistical selec-tion criteria, we narrowed our microarray data down to 10 genes encoding cell surface proteins (with extracellu-lar domains), whose expression segregated with suscep-tibility versus resistance to γδ-PBL cytotoxicity. We believe it is important to make this gene profile available to the biomedical community. Thus, we propose the expression of each candidate gene to be evaluated during upcoming γδ T-cell based clinical trials. The genes with highest predictive value will constitute novel leukemia/lymphoma biomarkers, for which standard-ized quantification essays should be developed. This will provide clinicians with a key tool for the indication and monitoring of γδ T-cell based immunotherapies.
Furthermore, within the panel of 10 candidate mark-ers, some are likely to play non-redundant roles in leukemia/lymphoma cell recognition by γδ-PBL. Thus, proteins that are enriched in γδ-susceptible tumors may provide activation signals, whereas markers of resistance may convey inhibitory signals to γδ-PBL. Provocatively, 7
Table 1. Panel of cell surface proteins associated with the susceptibility or resistance of lymphomas/leukemias to γδ T-cell cytotoxicity. The
sta-tistical difference between the average gene expression in the 6 susceptible versus the 4 resistant tumors of Figure 4 was assessed by Mann-Whitney test (P<0.05).
Symbol Description Biological function P value
Enriched in γδ-susceptible tumors
ULBP1 UL16 binding protein Ligand for NKG2D on NK and T cells; 0
induces cytotoxicity, cytokine secretion
IFITM1 Interferon-induced transmembrane protein 1 Involved in cell proliferation and malignancy 0 (CD225)
TFR2 Transferrin receptor 2 Cellular uptake of transferrin-bound iron 0.004
Enriched in γδ-resistant tumors
CLEC2D C-type lectin 2, D Ligand for the NK inhibitory receptor CD161 0.002
SELL Selectin L Adhesion of T cells to endothelial cells 0.001
SLAMF1 Signaling lymphocytic activation molecule 1 Bidirectional T cell to B cell stimulation 0
KCNK12 Potassium channel K, 12 Potassium channel 0
ITGA6 Integrin alpha 6 Integrin; receptor for laminin 0.014
PKD2 Polycystic kidney disease 2 Calcium channel 0.017
NRP2 Neuropilin 2 Co-receptor for VEGF; implicated in tumor 0.018
of the candidates are known to intervene in immune responses: 4 of them (ULBP1, IFITM1, CLEC2D and SLAMF1) provide stimulatory (or inhibitory) signals through receptors expressed on lymphocytes, while 3 (NRP2, SELL and ITGA6) control lymphocyte adhesion. ULBP1 is a ligand for the NKG2D receptor expressed on all cytotoxic lymphocyte lineages, including 100% of Vγ9Vδ2 T cells, which has been clearly implicated in anti-tumor responses.29-32 IFITM1 was shown to modu-late NK cell responses and its expression corremodu-lated with improved survival of gastric cancer patients.33 By con-trast, the expression of CLEC2D, a ligand for the inhibitory receptor CD161, inhibits NK cell responses and was associated with increased malignancy grade of glioblastoma.34 NRP2 is another protein that can favor cancer progression by acting as a coreceptor for vascular endothelial growth factor (VEGF) and stimulating tumor growth (35). We will now proceed with individual knock-down (RNA interference) experiments in a func-tional (tumor killing) bioassay to dissect the role of each of the candidates in γδ-PBL targeting of leukemias and lymphomas. Given that some of these molecules can also provide costimulatory or inhibitory signals to NK cells, we also plan to address their role in NK cell targeting of hematopoietic malignancies.
In summary, this report establishes a panel of 10
puta-tive markers of leukemia/lymphoma susceptibility to γδ-PBL cytotoxicity. The expression data collected from pri-mary samples showed a striking heterogeneity for partic-ular candidate genes, most notably ULBP1, whereas other genes, such as IFITM1, ITGA6 or SELL, essentially did not vary among patients. It is, therefore, predictable that different components of the proposed panel will behave in very distinct ways when associated to thera-peutic outcome in clinical trials. It will also be interesting to evaluate to what extent immunoselection may have conditioned the expression of these markers in tumors evolving in a dynamic interaction with γδ T lympho-cytes. This will significantly add to our understanding of anti-tumor immunity and to our capacity to modulate it for cancer immunotherapy.
Authorship and Disclosures
BSS was the principal investigator and takes primary responsibility for the paper. AQG, DVC and TL formed the laboratory work for this study. ARG per-formed the bioinformatics analysis of the data. CF, JFL, JTB and MGS provided clinical samples and suggestions. AQG, DVC and BSS wrote the manuscript.
The authors reported no potential conflicts of interest. Figure 4. Quantification of mRNA expression levels of γδ-susceptibil-ity markers in acute lymphoblas-tic leukemia and non-Hodgkin’s lymphoma patients. (A) RT-qPCR analysis of mRNA expression in 11 T-cell acute lymphoblastic leukemia (T-ALL) samples, nor-malized to housekeeping genes (GUSB and PSMB6) and to refer-ence PBMCs from healthy individ-uals. Values were converted to logarithmic scale. (B) RT-qPCR analysis of mRNA expression in 8 follicular lymphoma (FL) and 4 dif-fuse large B cell lymphoma (DLBCL) samples, normalized to housekeeping genes (GUSB and PSMB6) and to a reference sam-ple - reactive follicles – obtained through the same procedure. Values were converted to logarith-mic scale.
B A
References
1. Kabelitz D, Wesch D, He W. Perspectives of gammadelta T cells in tumor immunolo-gy. Cancer Res. 2007;67(1):5-8.
2. Girardi M, Oppenheim DE, Steele CR, Lewis JM, Glusac E, Filler R, et al. Regulation of cutaneous malignancy by gammadelta T cells. Science. 2001;294 (5542):605-9.
3. Gao Y, Yang W, Pan M, Scully E, Girardi M, Augenlicht LH, et al. Gamma delta T cells provide an early source of interferon gamma in tumor immunity. J Exp Med. 2003;198(3):433-42.
4. Liu Z, Eltoum IE, Guo B, Beck BH, Cloud GA, Lopez RD. Protective immunosurveil-lance and therapeutic antitumor activity of gammadelta T cells demonstrated in a mouse model of prostate cancer. J Immunol. 2008;180(9):6044-53.
5. Street SE, Hayakawa Y, Zhan Y, Lew AM, MacGregor D, Jamieson AM, et al. Innate immune surveillance of spontaneous B cell lymphomas by natural killer cells and gam-madelta T cells. J Exp Med. 2004;199(6): 879-84.
6. Morita CT, Jin C, Sarikonda G, Wang H. Nonpeptide antigens, presentation mecha-nisms, and immunological memory of human Vgamma2Vdelta2 T cells: discrimi-nating friend from foe through the recogni-tion of prenyl pyrophosphate antigens. Immunol Rev. 2007;215:59-76.
7. Correia DV, d'Orey F, Cardoso BA, Lanca T, Grosso AR, deBarros A, et al. Highly active microbial phosphoantigen induces rapid yet sustained MEK/Erk- and PI-3K/Akt-mediated signal transduction in anti-tumor human gammadelta T-cells. PLoS One. 2009;4(5):e5657.
8. Sicard H, Al Saati T, Delsol G, Fournie JJ.
Synthetic phosphoantigens enhance
human Vgamma9Vdelta2 T lymphocytes killing of non-Hodgkin's B lymphoma. Mol Med. 2001;7(10):711-22.
9. Kunzmann V, Wilhelm M. Anti-lymphoma effect of gammadelta T cells. Leuk Lymphoma. 2005;46(5):671-80.
10. Tokuyama H, Hagi T, Mattarollo SR, Morley J, Wang Q, Fai-So H, et al. V gamma 9 V delta 2 T cell cytotoxicity against tumor cells is enhanced by monoclonal antibody drugs--rituximab and trastuzumab. Int J Cancer. 2008;122(11): 2526-34.
11. Dieli F, Vermijlen D, Fulfaro F, Caccamo N, Meraviglia S, Cicero G, et al. Targeting human {gamma}delta} T cells with zole-dronate and interleukin-2 for immunother-apy of hormone-refractory prostate cancer. Cancer Res. 2007;67(15):7450-7.
12. Kobayashi H, Tanaka Y, Yagi J, Osaka Y,
Nakazawa H, Uchiyama T, et al. Safety profile and anti-tumor effects of adoptive immunotherapy using gamma-delta T cells against advanced renal cell carcinoma: a pilot study. Cancer Immunol Immunother. 2007;56(4):469-76.
13. Bennouna J, Bompas E, Neidhardt EM, Rolland F, Philip I, Galea C, et al. Phase-I study of Innacell gammadelta, an autolo-gous cell-therapy product highly enriched in gamma9delta2 T lymphocytes, in com-bination with IL-2, in patients with metastatic renal cell carcinoma. Cancer Immunol Immunother. 2008;57(11):1599-609.
14. Wilhelm M, Kunzmann V, Eckstein S, Reimer P, Weissinger F, Ruediger T, et al. Gammadelta T cells for immune therapy of patients with lymphoid malignancies. Blood. 2003;102(1):200-6.
15. Gertner-Dardenne J, Bonnafous C,
Bezombes C, Capietto AH, Scaglione V, Ingoure S, et al. Bromohydrin pyrophos-phate enhances antibody-dependent cell-mediated cytotoxicity induced by thera-peutic antibodies. Blood. 2009;113(20): 4875-84.
16. Abe Y, Muto M, Nieda M, Nakagawa Y, Nicol A, Kaneko T, et al. Clinical and immunological evaluation of zoledronate-activated Vgamma9gammadelta T-cell-based immunotherapy for patients with multiple myeloma. Exp Hematol. 2009; 37(8):956-68.
17. Team RDC. R: A Language and Environment for Statistical Computing. In: Computing RFfS, ed. Vienna, Austria, 2009. 18. Gentleman RC, Carey VJ, Bates DM, Bolstad B, Dettling M, Dudoit S, et al. Bioconductor: open software development for computational biology and bioinfor-matics. Genome Biol. 2004;5(10):R80. 19. Gautier L, Cope L, Bolstad BM, Irizarry RA.
affy--analysis of Affymetrix GeneChip data at the probe level. Bioinformatics. 2004;20(3):307-15.
20. Smyth GK. Linear models and empirical bayes methods for assessing differential expression in microarray experiments. Stat Appl Genet Mol Biol. 2004;3:Article3. 21. Smyth GK. Limma: linear models for
microarray data. In: R. Gentleman and V. Carey and S. Dudoit and R. Irizarry WH, ed. Bioinformatics and Computational Biology Solutions using R and Bioconductor. New York: Springer, 2005: 397-420.
22. Benjamini YH, Hochberg Y. Controlling the false discovery rate: a practical and power-ful approach to multiple testing. Journal of the Royal Statistical Society Series B. 1995;57:289-300.
23. Ringner M. What is principal component analysis? Nat Biotechnol. 2008;26(3):303-4.
24. Li J, Herold MJ, Kimmel B, Muller I, Rincon-Orozco B, Kunzmann V, et al. Reduced expression of the mevalonate pathway enzyme farnesyl pyrophosphate synthase unveils recognition of tumor cells by Vgamma9Vdelta2 T cells. J Immunol. 2009;182(12):8118-24.
25. Vantourout P, Mookerjee-Basu J, Rolland C, Pont F, Martin H, Davrinche C, et al. Specific requirements for Vgamma9Vdelta2 T cell stimulation by a natural adenylated phosphoantigen. J Immunol. 2009;183(6): 3848-57.
26. Scotet E, Martinez LO, Grant E, Barbaras R, Jeno P, Guiraud M, et al. Tumor recognition following Vgamma9Vdelta2 T cell receptor interactions with a surface F1-ATPase-relat-ed structure and apolipoprotein A-I. Immunity. 2005;22(1):71-80.
27. Kong Y, Cao W, Xi X, Ma C, Cui L, He W. The NKG2D ligand ULBP4 binds to TCRgamma9/delta2 and induces cytotoxic-ity to tumor cells through both TCRgammadelta and NKG2D. Blood. 2009;114(2):310-7.
28. Sole X, Bonifaci N, Lopez-Bigas N, Berenguer A, Hernandez P, Reina O, et al. Biological convergence of cancer signa-tures. PLoS One. 2009;4(2):e4544. 29. Raulet DH. Roles of the NKG2D
immunoreceptor and its ligands. Nat Rev Immunol. 2003;3(10):781-90.
30. Gomes AQ, Correia DV, Silva-Santos B. Non-classical major histocompatibility complex proteins as determinants of tumour immunosurveillance. EMBO Rep. 2007;8(11):1024-30.
31. Guerra N, Tan YX, Joncker NT, Choy A, Gallardo F, Xiong N, et al. NKG2D-defi-cient mice are defective in tumor surveil-lance in models of spontaneous malignan-cy. Immunity. 2008;28(4):571-80. 32. Strid J, Roberts SJ, Filler RB, Lewis JM,
Kwong BY, Schpero W, et al. Acute upregu-lation of an NKG2D ligand promotes rapid reorganization of a local immune compart-ment with pleiotropic effects on carcino-genesis. Nat Immunol. 2008;9(2):146-54. 33. Yang Y, Lee JH, Kim KY, Song HK, Kim JK,
Yoon SR, et al. The interferon-inducible 9-27 gene modulates the susceptibility to nat-ural killer cells and the invasiveness of gas-tric cancer cells. Cancer Lett. 2005; 221(2): 191-200.
34. Roth P, Mittelbronn M, Wick W, Meyermann R, Tatagiba M, Weller M. Malignant glioma cells counteract antitu-mor immune responses through expression of lectin-like transcript-1. Cancer Res. 2007;67(8):3540-4.
35. Pellet-Many C, Frankel P, Jia H, Zachary I. Neuropilins: structure, function and role in disease. Biochem J. 2008;411(2):211-26.