Exploring Latin America’s Responses to the Great Recession
∗Daniela Campello Get´ulio Vargas Foundation
April 1, 2016
Abstract
Latin America’s strong performance following the Great Recession has surprised ana-lysts and the media alike. The region not only outperformed other economies in the same period, but displayed far better results than those obtained in past crises. With few notable exceptions, most academic work that followed attributed this success to good policymaking prior to the crisis, in particular the accumulation of international reserves and a reduction of external debt. This paper challenges this conventional wisdom by exploring the substan-tial role of luck—an international scenario marked by an unprecedented commodity boom coupled with very low international interest rates—in explaining this phenomenon. I do so in two ways; first, by showing that the outstanding performance of the region was largely confined to its low-savings commodity-exporting economies, which were the ones particu-larly favoured by international conditions. Second, by demonstrating that these countries’ excellent performance persevered only as long as favourable conditions persisted, but was reversed throughout the region with the end of the commodity supercycle and increased prospects of rising U.S. interest rates.
∗
Paper prepared for the Conference on “Financial Crisis Management and its Consequences in Comparative Perspective”, Berlin, Apr-2016. This is work-in-progress, please do not quote.
Latin America’s strong performance following the Great Recession has surprised analysts and the media alike. In October 2008, the incumbent Brazilian president Lula da Silva went as far as to refer to the crisis as a “ripple,” in contrast with the “tsunami” observed in the United States. The fast recovery of the region’s economies proved striking compared not only to other emerging and developed countries in the same period, but also to its own records during previous financial crises.
Truth is, in relative terms Latin America was hardly hit by the 2008 crisis. Between 2008-09, the region’s GDP grew by an average of 1%, compared to -1.7% of the OECD, and -0.3% of the world economy. Numbers are even more impressing during recovery; the average annual growth rate between 2010 and 2013 reached 4%, more than twice the OECD rate (1.8%) and substantially larger than that of the world (2.9%). This performance is in stark contrast with past crisis episodes. In the first two years of the debt crisis of the 1980s, Latin American economies shrank 1.8% versus a 1.5% growth of the OECD and world average, and during the late 1990s financial crises the region grew 1.5%, only half the rate of developed countries and the world.
Most of the work published in the last few years dedicated to explaining Latin America’s trajectory after the 2007-08 financial crisis has credited the success to governments’ responses to the crisis, which deviated in many ways from those pursued in the past. This time, instead of the harsh pro-cyclical measures enacted in the early 1980s or late 1990s, counter-cyclical policies were advanced throughout the region (Porzecanski 2009, Fern´andez-Arias & Montiel 2009, Didier & Schmukler 2012, Ceballos, Didier, Hevia & Schmukler 2013, Vegh & Vuletin 2013). Governments’ capacity to pursue these policies has been frequently attributed to the excellent conditions economies enjoyed when the 2008 crisis hit, such as relatively low public and foreign debt, exchange rate flexibility, and high international reserves (Porzecanski 2009, Fern´andez-Arias & Montiel 2009, Moghadam 2010, Gallego, Gard´o, Martin, Molina & Serena 2010, Vegh & Vuletin 2013). Finally, whereas a few authors called attention to the relevance of exogenous factors in explaining the conditions countries enjoyed when the crisis hit (Vladkova-Hollar & Zettelmeyer 2008, Izquierdo & Talvi 2008, Ocampo 2009) most of the literature has attributed these conditions to a long-term “learning” process occurred throughout the region; after decades economic mismanagement, governments finally adopted “sound economic policies” in the years that preceded the crisis (Porzecanski 2009, Jara, Moreno & Tovar 2009, Fern´ andez-Arias & Montiel 2009, De La Torre & Ize 2010, De Gregorio 2012, Cohen 2013).
This paper argues that the impact of favourable exogenous conditions, not only in widen-ing Latin American governments fiscal and monetary space prior to the crisis but, even more importantly, in sustaining economic performance in the years that followed, has been largely
understated, with important economic and political consequences for the region. The eupho-ria that followed from this misattribution, among analysts, the media and policymakers alike, contributed to legitimise and mask policy choices that might have been abbreviated had the centrality of these conditions been properly recognised (Ocampo 2011).
I propose to examine the role of “luck” on Latin America’s trajectory in two ways. First, I show that the low-savings-commodity-exporting countries of South America, which benefitted from an unprecedented rise in commodity prices and by inflows of foreign capital pushed by very low international interest rates, systematically outperformed Mexico and Central American neighbours which, for having a different mode of insertion into the world economy, were not exposed the same way to these favourable conditions. Second, I leverage on the reversal of the so-called commodity supercycle after 2011 to evidence how this event marked the reversal of South America’s economic performance observed in the past few years.
The paper is organised as follows; the next section briefly reviews the recent literature on Latin American responses to the great recession, and revisits the conventional wisdom that the region’s capacity to advance counter-cyclical policies derived from the quality of prior policy choices. It depicts the wide variation in countries’ policy agenda observed in the region in the years that preceded the crisis, and argues that the comfortable fiscal and external conditions they enjoyed when the crisis hit cannot hardly be distinguished along these choices. Section 3 evidences the very distinct levels of exposure to the commodity super cycle of the low-savings-commodity-exporting countries of South America, vis-`a-vis Central America and Mexico, and shows how this exposure largely explains the diverging performance of these two groups in the years before and immediately after 2008. Section 4 evidences the sharp decline in South America’s economic performance after the end of the commodity supercycle, in contrast to the quick recovery after 2008 as prices quickly rebounded, and the last section discusses implications of the findings presented.
The 2008 Crisis in Latin America
Even though signals of contagion had already been felt when the Bank of England had to offer emergency funding to Northern Rock in 2007, in the first bank run in the UK since 1866, the fall in British stock markets of January 2008—the largest since September 11, 2001—was considered to mark the international spread of the American crisis. By that time, the crash was interpreted as a result of U.S. President George W. Bush’s emergency US$145 billion package, considered by analysts to be “too little, too late.”1
A few months later, in September 2008, Fannie Mae and Freddie Mac, two American government-sponsored enterprises responsible for providing a secondary market in home mort-gages and owing US$ 5 trillion of mortgage-backed securities, were taken over by the U.S. government. In the same month, Lehman Brothers—the fourth largest investment bank in the United States—filed for bankruptcy protection after incurring billions of dollars in losses due to the mortgage crisis, and the U.S. government spent US$85 billion to bail out the multinational insurance corporation American International Group (AIG).
In response to these events, U.S. Treasury Secretary Henry Paulson proposed a rescue plan,2 which authorized the government to buy troubled assets at discounts from financial institutions. In October, Hungary, Ukraine, and Iceland suffered sudden banking and currency crises as foreign funds dried up. Hungary was the first to receive IMF help, followed by Ukraine a month later. In November, the Fund approved a loan to Iceland, at the same time that the euro area officially entered into recession.
It was also in the last quarter of 2008 that Latin American economies started to feel the impact of the crisis, through three main channels. First, recession in the OECD and a slowdown in Chinese economic growth caused trade revenues to plunge; fewer goods were sold and the price of commodities fell after a decade-long increase. Second, risk aversion and portfolio adjustments reduced the availability of international capital, leading to a steep rise in borrowing costs for governments and companies. At last, tourism and remittances dropped sharply, particularly in Central America (Fern´andez-Arias & Montiel 2009).
By the end of 2008, merchandising export growth had turned negative in all emerging regions, and the sudden stop of international credit resulted in a nearly US$ 310 billion drop (on a constant dollar basis) in cross-border bank loans outstanding to emerging and developing countries between October 2008 and March 2009, more than reversing the nearly US$ 270 billion increase in cross-border net bank lending that had taken place during January-June 2008 (Porzecanski 2009).
In this same period, corporations and governments in developing countries paid out almost US$ 24 billion as amortizations and redemptions of international debt securities fell due, while during the first half of 2008 new issuance on their part had exceeded redemptions by nearly US$ 22 billion. These results were comparable to those observed in the aftermath of the Russian crisis of 1998.
Yet recovery in Latin America turned out to be surprisingly fast. In contrast with previous crisis episodes, less than six months after the crisis hit financial markets had restarted to grow, and double digit gains were registered in stocks, currencies and commodities (Porzecanski 2009).
2
Currencies formerly devalued recovered their international prices and countries-risk, which in-creased dramatically in every single country in the last quarter of 2008, had resumed their decreasing trend.
Varied accounts of South America’s relative success during the great recession note that, con-trary to previous experiences, most countries responded to the crisis by adopting counter-cyclical fiscal and monetary policies. This was possible due to a dramatic widening of fiscal and mone-tary spaces in the years prior to the crisis (Ceballos et al. 2013, Vegh & Vuletin 2013), reflected in consistent current account surpluses, lower public and external debt, and an accumulation of international reserves. Most authors attributed the comfortable conditions countries enjoyed by the time the crisis started, and that allowed governments to advance counter-cyclical programs, to an increase in the quality of policymaking in the region (Porzecanski 2009, De La Torre & Ize 2010, Alvarez & De Gregorio 2014, Far´ıas 2014, Corbo & Schmidt-Hebbel 2013, Cohen 2013). In the words of De Gregorio (2012, p.1), success was a “reward for good macroeconomic and financial policies,” and Fern´andez-Arias & Montiel (2009, p.12) contend that “the shock would have been larger before the market-oriented reforms of the 1990s,” which left the region more exposed but at the same time more resilient to external shocks. Among the policies listed by these authors are sensible, cautions fiscal and monetary policies and flexible exchange rates.
Jara, Moreno & Tovar (2009) and Porzecanski (2009) emphasize the progress made in de-veloping domestic debt markets, such as the promotion of domestic institutional investors, the development of local bond markets, the removal of obstacles to the arrival of strongly capitalized foreign commercial banks, and the enhancement of prudential supervision in domestic financial markets. According to Porzecanski (2009, p.10), it was “because governments took these find-ings and policy recommendations to the heart, and implemented them in the years prior to the crisis,” that the region was able to cope with the adverse consequences of the downturn. Most of these authors acknowledge the favourable conditions the region had experienced in the years prior to the crisis, but very few have recognised the centrality of these conditions in ex-plaining the regions’ astounding performance (Vladkova-Hollar & Zettelmeyer 2008, Izquierdo & Talvi 2008, Ocampo 2009).
Interestingly, authors that focus on the impact of policymaking frequently overlook the het-erogeneity of policy choices governments of the region pursued in the years before and in the aftermath of the crisis, or manage to connect the very favorable pre-crisis conditions countries shared in the region to these choices. When one takes a closer look at economic policymaking in South America, the region that concentrated most of the exceptional performance often at-tributed to Latin America as a whole, it becomes evident that whereas very favorable conditions were pervasive in the region by 2008, policies had diverged remarkably in the years preceding
the crisis.
Policymaking in the Years Preceding the Crisis: 2003-2008
Following the neoliberal wave of the 1990s, in which irrespective of their declared ideology most presidents ended up embracing an orthodox economic agenda, the 2000s brought about about wide variation in policy choices in South America.
In the years that preceded the Great Recession, residents identified with the Left ruled in Venezuela (Hugo Ch´avez), Brazil (Lula da Silva), Bolivia (Evo Morales), Chile (Ricardo Lagos and Michelle Bachelet), Uruguay (Tabar´e Vazquez), Ecuador (Rafael Correa) and Ar-gentina (N´estor Kirchner and Cristina Fern´andez), while right-leaning governments prevailed in Colombia ( ´Alvaro Uribe), Peru (Alan Garc´ıa) and Paraguay (Nicanor Duarte). Reason-ably consistent with partisan theories, governments of distinct ideologies established different economic priorities and advanced alternative economic policies in the region. State-oriented governments, or what has been referred to as the radical, populist or contentious Left (Levitsky & Roberts 2011, Flores-Mac´ıas 2010, Casta˜neda & Morales 2008, Edwards 2010) adopted eco-nomic policies that diverged from their market-oriented counterparts, be them the so-called moderate or liberal democratic Left, or governments identified with the economic Right.
The Justicialistas N´estor Kirchner and Cristina Fern´andez de Kirchner in Argentina are examples of the state-oriented Left that resurged in Latin America during the 2000s. In the macroeconomic realm, they controlled the exchange rate, restricted cross border capital flows, and adopted protectionist measures. Kirchner and Fern´andez also intervened in the Central Bank and maintained an expansive monetary policy, accepting high levels of inflation in an effort to boost growth and employment. In the micro level, both governments pursued nationalizations (including the formerly privatized pension system), subsidized energy prices, and fought hard to conclude and sustain a default on the country’s public debt.
Rafael Correa advanced similar policies in Ecuador. After losing access to international financial markets following a default on its Brady debt in 1999, most administrations in the country devoted major efforts towards regaining investors’ confidence. This strategy was com-pletely reverted by the leftist Correa since 2006. Under his leadership, Ecuador renegotiated concessions for explorations of utilities and oil and re-regulated labor markets. Correa also stripped the Central Bank of autonomy, advanced a de facto nationalization of the banking system, and announced a partial default on the country’s public debt in December 2008. In the macroeconomic realm, the government converted an average primary surplus of 2.6 percent of GDP between 1999 and 2006 into a an average deficit of 0.7 percent between 2007 and 2011, despite an 11 percent increase in public revenues in the period. Social expenditure increased
from 5.4 percent of GDP in 2006 to 8.3 percent in 2008 (Conaghan 2011). Bolivia followed the same path, with the nationalization of the gas industry, a doubling of public investment as share of GDP, and a strong redistributive agenda advanced by president Evo Morales.
President Hugo Ch´avez went even further in Venezuela. He secured fiscal surpluses in all but two out of his eleven years in office, despite an unprecedented boom in oil prices. In 2003, the president imposed capital controls that severely limited outflows of foreign currency from Venezuelan citizens and business, and maintained the highest rates of inflation in the region. Ch´avez also renegotiated oil contracts, and nationalized a broad range of industries, including steel, cement, and food distribution, becoming the most conspicuous representative of Latin America’s radical Left.
The so-called moderate, or market-oriented left followed remarkably different strategies, some times barely distinct from its neoliberal counterparts. Governments in Brazil, Chile and Uruguay advanced redistributive policies, but only within the limits imposed by an orthodox macroeconomic agenda. Brazil maintained consistently high primary balances that sharply reduced the country’s indebtedness between 2005 and 2008, a floating exchange rate regime, and a monetary policy oriented towards inflation targets. In the microeconomic realm, though, and particularly after the second Lula administration, the government increased social expenditures, raised the minimum wage and initiated a credit policy that boosted consumption in the country. Through the National Development Bank (BNDES), the government compensated industrialists dissatisfied with high interest rates with subsidized loans, and promoted industrial policies. Uruguay’s performance resembles that of Brazil; steady primary balances reduced the country’s fiscal deficit, the government allowed the currency to free float, and inflation was kept remarkably low. In the microeconomic realm, the government prioritized the extension of universal rights on education, health and social security, yet Uruguay was the only emerging economy in Latin America in which inequality slightly increased in the 2000s.
Chile represents the other extreme of the left-leaning spectrum. Even though the Socialist administrations of Ricardo Lagos, and specially that of Michele Bachelet advanced the coun-try’s social agenda compared to previous governments, the Chilean Left was characterized by a technocratic approach to governance. Efforts to reassure the country’s dynamic and powerful business community ended up leading the government to abandon commitments with a more far-reaching change (Roberts 2011). Both socialist governments continued the Christian Demo-cratic orthodox macroeconomic agenda, maintaining high primary and fiscal surpluses through most of the decade, as well as a free floating exchange rate system and an independent central bank.
Paraguay, macroeconomic orthodoxy went in parallel with timid redistributive efforts. Colombia and Peru, in particular, were the countries with the smallest government transfers to the poor in the region (Lustig & McLeod 2011). Yet despite the variety of different priorities and strategies in South America’s largest economies, all these countries shared very similar initial conditions by the time the 2008 crisis hit. As I will show below, in the years prior to the crisis the low-savings-commodity-exporting countries of the region experienced a boost in trade revenues, a substantial accumulation of international reserves and reduction in foreign debt, and an acceleration of economic growth compared both to the years prior to the boom and to Central America and Mexico. The next section discusses how very particular features of the world economy help explain these conditions.
International Conditions and Economic Performance
The behaviour of commodity prices has been at the center of Latin American economic think-ing for decades. Dependency theorists were primarily concerned with the—then seemingly secular—declining terms of trade, for which they believed the natural remedy consisted of in-ward growth policies that reduced countries’ exposure to the “unequal exchange” conditions facing commodity-exporting nations (Prebisch 1949, Singer 1950). Even non-dependencistas, however, shared the perception that international fluctuations of these prices were key to eco-nomic performance in the region. Malan & Bonelli (1977), for instance, argued that the Brazilian “economic miracle” of the early 1970s had depended heavily on “an exceptional and elusively temporary international situation” (p. 21) that had been channeled through “two dimensions, one related to commodity trade and the other to net inflows of foreign capital” (p. 24).3 As the authors note, in addition to commodity prices, historically low levels of domestic savings imply that Latin American economic performance is also highly affected by inflows of foreign capital, which ultimately respond to fluctuations of U.S. interest rates. In periods of relatively low rates, world liquidity increases, and capital tends to flow to emerging economies in search of better returns. Higher rates, conversely, prompt international capital to flee to safer havens (Calvo, Leiderman & Reinhart 1996, Santiso 2003).
Not surprisingly, economists have shown that Latin American countries perform exception-ally well when international interest rates are low and commodity prices are high, and are hurt when the opposite happens (Maxfield 1998, Gavin, Hausmann & Leiderman 1995). Izquierdo, Romero & Talvi (2008), in particular, demonstrate that both capital flows and economic growth
3
At the time such flows were mostly foreign direct investment, but since then portfolio flows have increased considerably and become much more relevant to countries’ balance of payments, particularly in the short term.
in Latin America’s largest economies are fundamentally determined by changes in the interna-tional interest rates and in commodity prices. More recently, Campello & Zucco (2016) combined commodity prices and U.S. interest rates into a one-dimensional summary—“Good Economic Times” (GET) index—that attempts to capture how favorable the international economy is to Latin American countries.4 The GET index is measured in a unit-less normalized scale, with higher values represent “good times” and lower values represent “bad times,” and has been shown to predict political as much as economic success in the region.
It is worth noting, however, that commodity prices and international interest rates are not equally important for all Latin American economies, their effects being contingent on a country’s modes of insertion into the world economy. Countries where commodities make up a large share of total exports are more exposed to variations in international commodity prices.5 Those that rely on foreign private capital—measured as the ratio of foreign debt service obligations to export earnings—are more exposed to shifts international interest rates.6 Figure 1 shows the values of both indicators for all Latin American countries.
Countries in the lower-left quadrant should not theoretically be influenced by GET; this influence should be larger the further up and to the right in the graph that a country is located. Almost all South American countries clearly fall in the latter situation, while most Central American countries as well as Mexico lie in the former.7 Paraguay, Honduras, and, to a lesser degree, Guatemala, occupy a more ambiguous intermediate position. The first is extremely dependent on commodities, but not exposed to international private capital flows. The last two are slightly more subject to international financial flows, but less dependent on commodities.
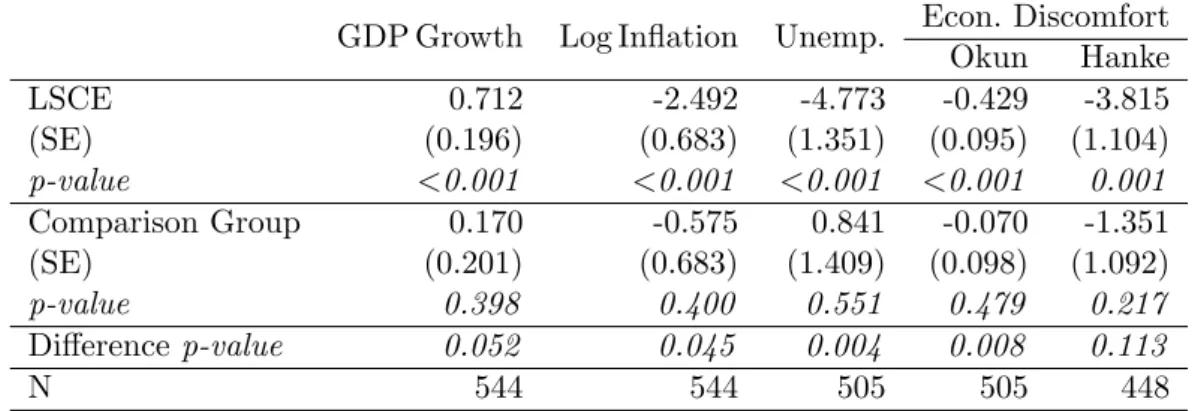
Table 1 strengthens the case for distinguishing the exposure of these two groups to com-modity prices and international interest rates by showing that GET affects domestic economic indicators, but only in the low-savings-commodity-exporting (LSCE) countries of the region.8 The table reports estimates of how GET impacts economic growth, unemployment, inflation, and combinations thereof such as the “economic discomfort” or “misery” index proposed by 4GET is produced by performing a principal components decomposition of the U.S. 10 Year Treasury Constant
Maturity Rate—provided by the Federal Research Bank of Saint Louis (FRED)—and UNCTAD’s aggregate “free market commodity prices” index.
5
Reliance on commodities is the simply the value of commodity exports divided by the sum of merchandise and service exports for each country. Data are from the World Trade Organization.
6
Exposure to international interest rates is yearly debt service obligations divided by the total value of exports for each country, which is an often used “solvency indicator”. Data are from the World Bank and the Central Bank of Chile.
7
These two “core” groups remain unaltered using alternative ways by which to split the Latin American countries into two groups.
8
It is important to reaffirm that I am not claiming that the comparison group does not depend on any international condition. My argument is simply that these countries do not depend on commodity prices and U.S. interest rates in the same way as LSCE countries. In principle, it should be possible to construct equivalent GET indices for other groups of countries, according to how they are inserted into the global economy. We leave this exercise for future research.
0.10 0.15 0.20 0.25 0.30 0.35 0.40 0.45 0.2 0.3 0.4 0.5 0.6 0.7 0.8 Debt Service/Exports
(Exposure to International Interest Rates)
Commodities/T otal Expor ts (Exposure to Commodity Pr ices) ARG BOL BRA CHI COL CRI DOM ECU ELS GUA HON MEX NIC PAN PAR PER URU VEN
Figure 1: Exposure to Commodity Prices and International Interest Rates
Horizontal axis is debt service as a share of total exports. Vertical axis is share of commodity exports. Both indi-cators are averages for the period between 1980 (or the first democratic election thereafter) and 2012. Countries in shaded area compose the “low-savings commodity-exporting” group, and all others are in the “comparison’ group. See text for sources.
Okun (1971), and a modified version as proposed by Hanke (2014).9 For each of these domes-tic economic indicators, OLS regressions were estimated on a pooled set of all country/year observations, including country-fixed effects, the lagged dependent variable, and an interaction between GET and an indicator for whether the country is in the LSCE sample. The effect of GET is always statistically significant and in the expected direction in the LSCE sample, no such effect is ever found in the comparison group. The difference between the effects of GET in each group of countries is statistically significant for all but one of the indicators examined.
After establishing the different impacts of fluctuations in commodity prices and international interest rates have on the performance of the low-savings-commodity-exporting economies of South America vis-`a-vis their Central and North American counterparts, the next step is to observe how the very particular international scenario that prevailed in the 2000s help explain the remarkable performance of one group, compared to the other, in the years prior to the 2008 crisis.
9The Okun index is simply a sums the unemployment and inflation rate for the year. The Hanke index ads
domestic interest rates and subtracts growth from the original index. It is a version of Barro’s (1996) misery index, modified to allow for easy cross-national computation.
Table 1: Effects of GET on Selected Domestic Indicators for LSCE and Comparison Group GDP Growth Log Inflation Unemp. Econ. Discomfort
Okun Hanke LSCE 0.712 -2.492 -4.773 -0.429 -3.815 (SE) (0.196) (0.683) (1.351) (0.095) (1.104) p-value <0.001 <0.001 <0.001 <0.001 0.001 Comparison Group 0.170 -0.575 0.841 -0.070 -1.351 (SE) (0.201) (0.683) (1.409) (0.098) (1.092) p-value 0.398 0.400 0.551 0.479 0.217 Difference p-value 0.052 0.045 0.004 0.008 0.113 N 544 544 505 505 448
Table reports OLS estimates on pooled data for all country years in the period 1980-2012 following the onset of democracy in each country, standard errors in parenthesis, and p-values in italics. Dependent variables are listed in the column headers, and all models include country fixed-effects and a lag of the dependent variable. LSCE countries are defined per Figure 1. N varies due to missing data for unemployment and domestic interest rates. P-value of the difference is measured between the coefficients of GET for each group. Inflation values were logged, and inflation and unemployment were transformed so that the 1980=100. The Okun economic discomfort index is the sum of inflation and unemployment, while the Hanke index adds domestic interest and subtracts the growth rate. Data are from the World Bank.
The Commodity Supercycle and Economic Performance in Latin
America
Figure 2 displays the behaviour of the “Good Economic Times” (GET) index in the past 30 years, when it varied from -1.7 in 1982 to just over 3 in 2011. This figure offers a particularly cogent summary of the economic conditions facing the low-saving-commodity-exporting countries of Latin America. It reflects the rise in U.S. interest rates in 1979, which precipitated the debt crisis that ravaged the region and that, combined with extremely low commodity prices in the 1980s, produced a “lost decade.” It also captures the sharp decline of U.S. interests rates that in the early 1990s prompted a boom of private capital inflows to the region, which allowed for the implementation of stabilization plans that put an end to hyper-inflation in most countries. Most importantly for the purposes of this analysis, the GET index captures the exception-ality of the scenario started in the early 2000s. Very low international interest rates combined with sky-high commodity prices fuelled a period of unprecedented wealth creation. The index also reveals the limited damage the 2008 crisis has imposed on South American economies; whereas it declined between the last quarter of 2008 and the first quarter of 2009, this drop was nonetheless followed by a quick recovery, as commodity prices resumed their growth following the rebound of the Chinese economy and international interest rates were further lowered in response to recession in the developed world. Finally, as much as the behavior of the GET
1980 1985 1990 1995 2000 2005 2010 2015 2 4 6 8 10 12 14 % (Nominal Rates) 100 150 200 250 300 Inde x P oints (y ear 2000=100)
US Int. Rates Commodities GET Index
Figure 2: Good Economic Times Index (GET)
Figure shows the evolution of the good economic times index between 1980 and 2012.
suggests that former president Lula was correct in picturing the Great Recession as no more than a ripple in 2008, it also evidences that a crisis effectively reached the region after 2011, through a sharp drop in commodity prices coupled with the increase of U.S. interest rates. The next two sections explore first how the boom and later its end have impacted the performance of South American low-savings-commodity-exporting countries, using Central American countries and Mexico as an out-of-sample comparison.
The Commodity Supercycle and Economic Performance in South America
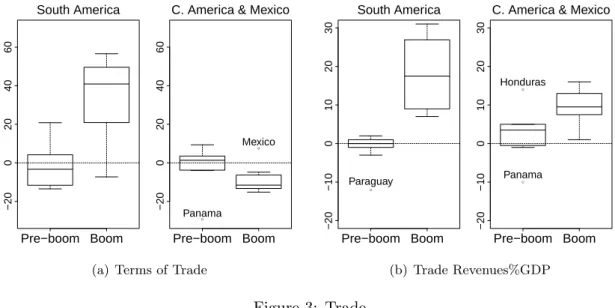
The first evidence of the favorable impact an international scenario marked by skyrocketing commodity prices had on South America is observable in the region’s terms of trade (Figure 3(a)). With the exception of Uruguay, they improved remarkably between 2002 and 2008, in a clear contrast with Central America and Mexico and with the previous years. These changes are reflected in the behavior of trade revenues in each group (Figure 3(b)). Between 2002 and 2008, trade revenues as a share of GDP increased dramatically in all South American countries (from 12% to 30%), compared to modest improvements in Mexico and Central America (from 25% to 35%). Even in Argentina, where this effect was smaller, the share of trade revenues on GDP doubled. In Bolivia, at the other extreme, it quadrupled.
Current account surpluses in most countries (exceptions being Uruguay and Colombia), coupled with strong capital inflows, led to and to an accumulation of international reserves that
−20 0 20 40 60 South America Pre−boom Boom ● ● −20 0 20 40 60
C. America & Mexico
Pre−boom Boom
Panama
Mexico
(a) Terms of Trade
● −20 −10 0 10 20 30 South America Pre−boom Boom Paraguay ● ● −20 −10 0 10 20 30
C. America & Mexico
Pre−boom Boom
Panama Honduras
(b) Trade Revenues%GDP
Figure 3: Trade
The figure shows (a) the change in terms of trade prior to the boom (1996-2002) and during the boom (2002 and 2008), and (b) changes in trade revenues as a percentage of GDP between 2002 and 2008 for South America and Central America and Mexico. Source: CEPALstat.
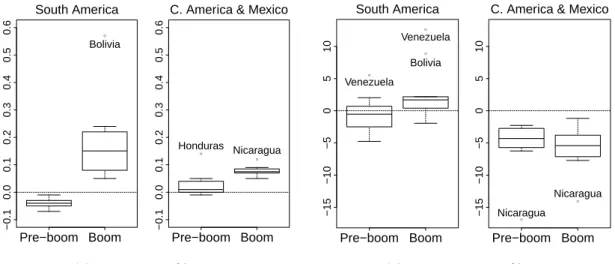
encompassed all countries in the region, widening monetary space in the years prior to the crisis (Figure 4). An average current account balance of 2.6% in South America contrasted, in the years that preceded the crisis, with an average deficit of 6% in Central America and Mexico, where all countries incurred in deficits between 2003 and 2008. International reserves as a share of GDP rose 18 percentage points in South America, more than twice the rate in Central America an Mexico (8pp). These numbers are even more remarkable if one considers that in the former international reserves as a share of GDP had actually fallen 4pp. in the years prior to the boom, compared to a 3pp. rise in Central America and Mexico.
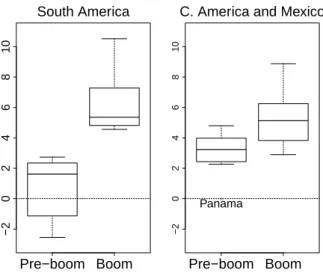
Moreover, every single South American country improved its total foreign debt position during the boom, reverting the negative trend observed between 1998 and 2002, and remained improving in 2008 (Figure 4(a)). Foreign debt as a percentage of GDP decreased an average of 24 pp even disregarding the extreme case of Argentina (- 90pp due to a debt default), compared to 2.8pp in Central America and Mexico (in this case, omitting Nicaragua, with -76pp). Lower foreign debt, coupled with increased fiscal revenues that facilitated consistent primary surpluses maintained throughout the region (averaging 2% in South America, compared to 0.3% in the years that preceded the boom and 0.6% in Central America) contributed to widen countries’ fiscal space prior to the crisis (Figure 5). Outliers were Colombia, which incurred in primary deficits during the whole period, and at the other extreme Chile, which reached a surplus close to 8% of the GDP in 2007. The acceleration of GDP growth occurred in South America during the boom completes the picture (Figure 6).
● −0.1 0.0 0.1 0.2 0.3 0.4 0.5 0.6 South America Pre−boom Boom Bolivia ● ● −0.1 0.0 0.1 0.2 0.3 0.4 0.5 0.6
C. America & Mexico
Pre−boom Boom
Honduras Nicaragua
(a) Int. Reserves%GDP
● ● ● −15 −10 −5 0 5 10 South America Pre−boom Boom Venezuela Bolivia Venezuela ● ● −15 −10 −5 0 5 10
C. America & Mexico
Pre−boom Boom
Nicaragua
Nicaragua
(b) Current Account%GDP
Figure 4: Monetary Space
The figure shows (a) the average current account balance prior (1996-2002) and during the boom (2002-2008), and (b) the change in international reserves as a percentage of GDP prior to the boom (1996-2002) and during the boom (2002 and 2008), for South America and Central America and Mexico. Source: CEPALstat, author’s calculations. ● ● −2 0 2 4 South America Pre−boom Boom Chile Colombia −2 0 2 4
C.America & Mexico
Pre−boom Boom (a) Primary Balance%GDP
● ● −100 −50 0 50 100 South America Pre−boom Boom Argentina Argentina ● −100 −50 0 50 100
C. America & Mexico
Pre−boom Boom
Nicaragua
(b) External Debt%GDP
Figure 5: Fiscal Space
The figure shows (a) the average primary result as a percentage of GDP before (1996-2002) and during the boom (2002-2008), and (b) changes in total foreign debt as a percentage of GDP before (1996-2002) and during the boom (2002-2008), for South America, and Central America and Mexico. Source: CEPALstat.
Conditions as the crisis hit
Under such favourable conditions, it is not surprising that Latin American countries displayed higher leves of fiscal and monetary readiness than Mexico and Central America by the time the crisis hit. Figure 7 displays all South American countries, with the exception of Uruguay, in the
−2 0 2 4 6 8 10 South America Pre−boom Boom ● −2 0 2 4 6 8 10
C. America and Mexico
Pre−boom Boom Panama
Figure 6: GDP growth: Annual Average Before and During the Boom
The figure shows the difference, in percentage points, between annual growth rates in the period 1996-2002 (pre-boom) and 2002-2008 (boom). Source: CEPALstat.
top right half of the space.10
● ● ● ● ● ● ● ● ● ● ● ● ● ● 4 6 8 10 12 14 16 18 5 10 15 arg bra chl col cri dom gua hond mex per par nic uru ven Fiscal Readiness Monetar y Readiness Figure 7: Readiness in 2008
The figure shows fiscal and monetary readiness indexed for South American countries in 2008. Source: authors’ calculation based on data from CEPALstat.
10
Readiness is calculated based on the sum of current account surplus and international reserves (monetary readiness), as well as and external debt and primary result (fiscal readiness), normalised between 0 and 10 among countries in the region—each index ranging from 0 to 20, and total readiness from 0 to 40. I use the same calculation as in See Vegh & Vuletin (2013)), except for international reserves, which are measured in months of imports, instead of as share of GDP.
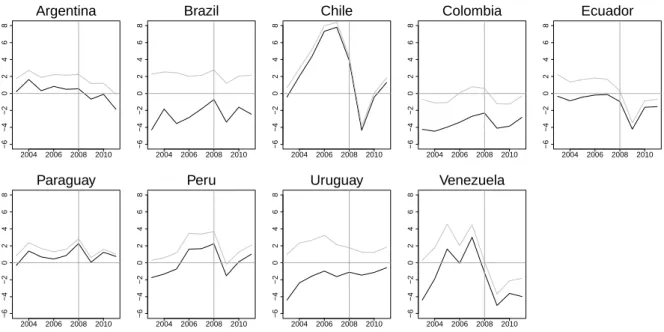
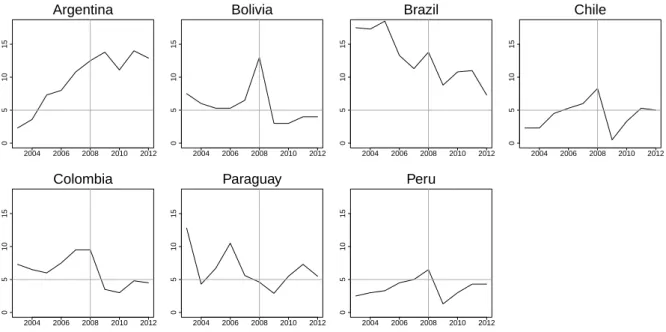
The tremendous increase in fiscal and monetary spaces observed in South America allowed governments to losen fiscal and monetary policies during the 2008 crisis (Figures 8 and 9), yet these responses varied widely. At one extreme, both Brazil and Uruguay incurred in slightly lower surpluses in 2009 (from 2.1% of GDP in 2007 to 1.2% in 2009 in both cases), increasing surpluses once again already in 2010. At the other, Chile and Venezuela went from surpluses of 8.4% and 4.5% of GDP in 2007 to deficits of -4% in 2009. In the monetary side, with the exception of Argentina, all countries lowered interest rates immediately after the crisis, but whereas this drop was substantial in Bolivia and Chile (10% and 8%, respectively), it was just 1.7% in Paraguay. 2004 2006 2008 2010 −6 −4 −2 0 2 4 6 8 Argentina 2004 2006 2008 2010 −6 −4 −2 0 2 4 6 8 Brazil 2004 2006 2008 2010 −6 −4 −2 0 2 4 6 8 Chile 2004 2006 2008 2010 −6 −4 −2 0 2 4 6 8 Colombia 2004 2006 2008 2010 −6 −4 −2 0 2 4 6 8 Ecuador 2004 2006 2008 2010 −6 −4 −2 0 2 4 6 8 Paraguay 2004 2006 2008 2010 −6 −4 −2 0 2 4 6 8 Peru 2004 2006 2008 2010 −6 −4 −2 0 2 4 6 8 Uruguay 2004 2006 2008 2010 −6 −4 −2 0 2 4 6 8 Venezuela
Figure 8: Fiscal Responses
The figure shows primary (light grey) and fiscal (dark grey) results for South American countries before and after the 2008 crisis. Source: CEPALstat.
Nevertheless, it is interesting to observe that despite such variations, all the economies of the region rebounded after 2009. It was only when the international scenario suddenly reversed course—after a sharp drop in commodity prices coupled with prospects of rising U.S. interest rates—that South America’s performance started to deteriorate. The next section examines the scenario post 2008 and compares how the financial crisis vis-`a-vis the end of the commodity supercycle impacted the region.
2004 2006 2008 2010 2012 0 5 10 15 Argentina 2004 2006 2008 2010 2012 0 5 10 15 Bolivia 2004 2006 2008 2010 2012 0 5 10 15 Brazil 2004 2006 2008 2010 2012 0 5 10 15 Chile 2004 2006 2008 2010 2012 0 5 10 15 Colombia 2004 2006 2008 2010 2012 0 5 10 15 Paraguay 2004 2006 2008 2010 2012 0 5 10 15 Peru
Figure 9: Monetary Responses
The figure shows monetary policy rates for South American countries before and after the 2008 crisis. Source: CEPALstat.
Post-Boom Period: Recovery and Crisis
The last section has shown that improvements in terms of trade, increases in trade revenues, the accumulation of foreign reserves, the lowering of external debt were conditions experienced by all the low-savings-commodity-exporting countries of South America. It has also highlighted that, even though these features are frequently generalized to “Latin America,” most of them were not present in Central America and Mexico, which in the same period experienced a decline in terms of trade, marginal increases in trade revenues and international reserves, and no change whatsoever in external indebtedness. The acceleration of growth rates that marked the period in South America was also not observed in the rest of the region.
The evidence presented so far is compatible with the claim that these conditions, common to all countries despite very heterogeneous policymaking in the years that preceded the cri-sis, were closely associated to a particular international scenario that prevailed in these years, in which high commodity prices and low interest rates favored the low-savings-commodity-exporting economies, most of them located in South America.
Another strategy to examine the relations between the commodity super cycle and the performance of South American countries is to observe how the end of the cycle affected such performance, in particular in comparison with the effects of the 2008 crisis. The figures below
show the behavior of the same variables discussed in the previous section during the three periods of interest: the pre-2008 boom, the post-boom (period from the crisis to 2011, when GET starts to decline) and crisis (period since the reversal). They reveal that the end of the commodity super cycle marks the real turning point after which the international crisis effectively reached the region.
Figure 10 depicts the trajectory of terms of trade and trade revenues. While both indicators continued to improve (at a slower rate) after 2008, after the end of the commodity supercycle both entered in negative areas. Bolivia is the only outlier, with exceptional growth of trade revenues throughout the period, possibly reflecting the delay in the decline of natural gas prices expected to occur in the near future.
−20
0
20
40
60
Boom Post−boom Crisis
(a) Terms of Trade
● −10 0 10 20 30 Bolivia
Boom Post−boom Crisis
(b) Trade Revenues%GDP
Figure 10: Trade
The figure shows (a) the change in terms of trade and (b) trade revenues as a share of GDP for South American countries in the three periods of interest: during the boom (2003-2008), the post-boom period (2008-2012) and during crisis (2012-2014). Source: CEPALstat.
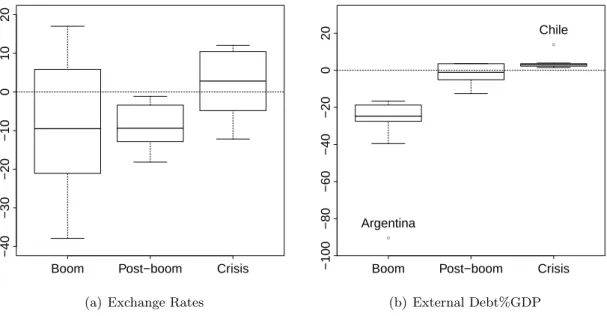
Figure 11(a) reveals, once again, a major structural change that goes on after the end of the commodity supercycle. South American currencies, most of which had experienced strong appreciation during the boom, remained appreciating in the pos-2008 years; depreciation only happens after 2012, in all countries but Bolivia, Uruguay and to a minor extent Ecuador. External debt reveals a similar path, declining during the boom, stabilizing after 2008 and resuming an upward trend in recent years, and the same applies to current account surpluses and international reserves (Figure 12).
world, revealing prospects of negative economic growth in the region at the same time that growth rates start to recover in the rest of the world. As the international scenario changes for Latin America, with lower commodity prices and higher U.S. interest rates, the advantaged position it enjoyed relative to the rest of the world is expected to revert.11
−40 −30 −20 −10 0 10 20
Boom Post−boom Crisis
(a) Exchange Rates
● ● −100 −80 −60 −40 −20 0 20
Boom Post−boom Crisis
Argentina
Chile
(b) External Debt%GDP
Figure 11: Exchange Rates Reserves and External Debt
The figure shows (a) the effective exchange rate and (b) external debt as a share of GDP for South American countries in the three periods of interest: during the boom (2003-2008), the post-boom period (2008-2012) and during crisis (2014-2012). Source: CEPALstat, author’s calculations.
● −4 −2 0 2 4 6 8
Boom Post−boom Crisis
Bolivia
(a) Current Account %GDP
● ● ● ● ● −0.2 0.0 0.2 0.4 0.6
Boom Post−boom Crisis
Bolivia Venezuela Paraguay Peru Venezuela (b) International Reserves%GDP
Figure 12: International Reserves and External Debt
The figure shows (a) current account balance and (b) international reserves as shares of GDP for South American countries in the three periods of interest: during the boom (2003-2008), the post-boom period (2008-2012) and during crisis (2014-2012). Source: CEPALstat, author’s calculations.
−1 0 1 2 3 4 5 6 2012−2014
Lat.Am. OECD World −1
0 1 2 3 4 5 6 2015 est.*
Lat.Am. OECD World −1
0 1 2 3 4 5 6 2016 est.*
Lat.Am. OECD World
Figure 13: GDP growth: Annual Average Before and During the Boom
The figure shows actual GDP growth rates in 2012-14, and estimated rates for 2015 and 2016 for Latin America, the OECD and the world economy. Source: IMF World Economic Outlook, Jan 2016.
Conclusion: Merit vs. Luck
This paper attempted to suggest that luck, reflected in a very favorable international scenario, largely explains the good economic performance South American countries displayed both in
the years prior to the great recession and immediately after. Moreover, I have argued that the reversal of such “luck,” occurred after a sharp decline in commodity prices coupled with prospects of rising U.S. interest rates, has also had a fundamental impact on the generalised deterioration of economic performance after 2012 (Reinhart, Reinhart & Trebesch 2016, Powell 2015, Ocampo 2011).
The analysis pursued here by no means implies that policymaking is irrelevant, but it cer-tainly suggests that the effect of exogenous conditions, be them favourable or unfavourable, should not be overlooked in South America. If, on one side, the evidence presented suggests that governments’ responsibility for economic results in the short term might be more limited than it is usually apprehended, it points to the necessity of questioning the modes of insertion of the region into the world economy, and their long term consequences. During the economic boom started in the early 2000s, and that lasted close to a decade, economic growth accelerated, a significant share of South Americans emerged from below poverty lines, and inequality was reduced. Strong consumption improved the well-being of the poorest extracts of the population and raised expectations about the future that were certainly not realistic. No boom lasts forever, and understanding how much of the good times were related to factors exogenous to policy-making could have possibly prevented the generalised sense of failure that currently permeates most of the region. Moreover, the recognition of the consequences of unprecedentedly favorable exogenous conditions could potentially have a “humbling effect” on policymakers, who could have looked at their choices with a grain of salt rather that taking full credit for the outstanding performance countries demonstrated. Eventually, bad policies masked behind good conditions could have been more easily detected.
Besides avoiding the alternation of euphoria and frustration, citizens’ capacity to distinguish “merit from luck,” which could have been increased if analysts and the media themselves were not failing to make such distinction, has consistently implied punishing presidents in the region who happen to be in office in “bad times,” or rewarding those who were lucky enough to rule during “good times,” even though good and bad times are largely exogenous to policymaking. In previous work, my co-author and I have shown that this is exactly how voters behave in Latin America, with very serious implications for democracy (Campello & Zucco 2016). As Figure 14 below shows, following scholars, pundits and the media that largely praised South American governments for the successful performance during the boom, voters demonstrated strong support for these same governments, and for the same reasons. The figure reveals that the chances of reelection (or election of successors) closely track the conditions of the international scenario, and increased dramatically in South America (but not in Central America and Mexico for reasons exhaustively discussed in the paper) during the recent boom.
The same dynamic explains why confidence in the economy and government popularity have experienced dramatic drops in the region, irrespective of the quality of policymaking during the boom or in response to the crisis. From the economic collapse of Venezuela to the relatively good standing of Bolivia, voters who attribute the whole responsibility for economic performance to policymakers are punishing incumbents throughout the region. Analysts should know better.
(a) The Trajectory of the GET
LSCE Countries Comparison Group
0.0 0.2 0.4 0.6 0.8 Reelection Rates 1980s 1990s 2000s (b) Reelections (%)
Figure 14: Good Economic Times and Reelections in Latin America
The figure shows (a) current account balance and (b) international reserves as shares of GDP for South American countries in the three periods of interest: during the boom (2003-2008), the post-boom period (2008-2012) and during crisis (2014-2012). Source: CEPALstat, author’s calculations.
References
Alvarez, Roberto & Jos´e De Gregorio. 2014. “Understanding Differences in Growth Performance in Latin America and Developing Countries between the Asian and the Global Financial Crises.” IMF Economic Review 62(4):494–525.
Barro, Robert J. 1996. Getting it right: markets and choices in a free society. Cambridge, MA: Mit Press.
Calvo, Guillermo, Leonardo Leiderman & Carmen M. Reinhart. 1996. “Inflows of Capital to Developing Countries in the 1990s.” Journal of Economic Perspectives 10(2):123–39.
Campello, Daniela & Cesar Zucco. 2016. “Presidential Success and the World Economy.” The Journal of Politics 78(2):589–602.
URL: http://dx.doi.org/10.1086/684749
Casta˜neda, Jorge & Marco A. Morales, eds. 2008. Left Overs: Tales of the Latin American Left. New York: Routledge.
Ceballos, Francisco, Tatiana Didier, Constantino Hevia & Sergio Schmukler. 2013. “Policy Responses to the Global Financial Crisis: What Did Emerging Economies Do Differently?” Peruvian Central Bank Working Paper Series.
Cohen, Michael. 2013. “Austerity and the Global Crisis: Lessons from Latin America.” Social Research 80(3).
Conaghan, Catherine. 2011. Rafael Correa and the Citizen’s Revolution. In The Resurgence of the Latin American Left. Johns Hopkins University Press pp. 260–282.
Corbo, Vittorio & Schmidt-Hebbel. 2013. “The International Crisis in Latin America.” Monetaria . De Gregorio, Jos´e. 2012. “Resilience in Latin America: Lessons from Macroeconomic Management and
Financial Policies.” Universidad de Chile.
De La Torre, Augusto & Augusto Ize. 2010. Finance in Crisis: Causes, Lessons, Consequences and an Application to Latin America. In The Day After Tomorrow: A Handbook on the Future of Economic Policy in the Developing World, ed. Otaviano Canuto & Marcelo Giugale. The World Bank. Didier, Tatiana, Hevia Constantino & Sergio L. Schmukler. 2012. “How Resilient and Countercyclical
Were Emerging Economiesto the Global Financial Crisis.” Journal of International Money and Finance pp. 1–29.
Edwards, Sebastian. 2010. Left Behind: Latin America and the False Promise of Populism. Chicago: University of Chicago Press.
Far´ıas, Maria Elisa. 2014. “Financial Crises in Latin America.” Georgetown University - Center for Latin American Studies Working Papers Series .
Fern´andez-Arias, Eduardo & Peter J. Montiel. 2009. “Crisis Response in Latin America: Is The “Rainy Day” at Hand?” IADB Working Paper (686).
Flores-Mac´ıas, Gustavo. 2010. “Statist vs. Pro-Market: Explaining Leftist Governments’Economic Poli-cies in Latin America.” Comparative Politics 42(4):413–433.
Gallego, Sonsoles, S´andor Gard´o, Reiner Martin, Luis Molina & Jos´e Maria Serena. 2010. The Impact of the Global Economic and Financial Crisis on Central, Eastern and Southestern Europe (CESEE) and Latin America. Technical report Banco de Espa˜na.
Gavin, Michael, Ricardo Hausmann & Leonardo Leiderman. 1995. “Macroeconomics of Capital Flows to Latin America: Experience and Policy Issues.” RES Working Papers, Inter-American Development Bank 4012(3):389–431.
Hanke, Steve H. 2014. “Measuring Misery around the World.” Commentary.
URL: http://www.cato.org/publications/commentary/measuring-misery-around-world
Izquierdo, Alejandro & Ernesto Talvi. 2008. “All that glitters may not be gold: assessing Latin Amer-ica’s recent macroeconomic All that Glitters May Not Be Gold: Assessing Latin AmerAmer-ica’s recent macroeconomic performance.”.
Izquierdo, Alejandro, Randall Romero & Ernesto Talvi. 2008. “Booms and Busts in Latin America: The Role of External Factors.” IADB Working Paper 89(631):2–31.
Jara, Alejandro, Ramon Moreno & Camilo E. Tovar. 2009. “The Global Crisis and Latin America: Financial Impact and Policy Responses.” BIS Quarterly Review pp. 53–68.
Levitsky, Steven & Kenneth Roberts, eds. 2011. The Resurgence of the Latin American Left. Baltimore: Johns Hopkins University Press.
Lustig, Nora & Darryl McLeod. 2011. Tulane University Economics Working Paper Series Working Paper 1117.
Malan, Pedro S & Regis Bonelli. 1977. “The Brazilian economy in the seventies: old and new develop-ments.” World Development 5(1):19–45.
Maxfield, Sylvia. 1998. Effects of International Portfolio Flows on Government Policy Choice. In Capital Flows and Financial Crises, ed. Miles Kahler. New Jersey: Council of Foreign Relations pp. 69–92. Moghadam, Reza. 2010. “How Did Emerging Markets Cope in the Crisis?”.
Ocampo, Jos´e A. 2009. “Latni America and the Global Financial Crisis.” Cambridge Journal of Ecoco-nomics 33.
Ocampo, Jos´e Antonio. 2011. “How Well Has Latin America Fared During the Global Financial Crisis? How Well Has Latin America Fared During the Global Financial Crisis? How Well Has Latin America Fared During the Global Financial Crisis?” Ensaios Econ´omicos (61/62).
Okun, Arthur M. 1971. “The mirage of steady inflation.” Brookings Papers on Economic Activity pp. 485– 498.
Porzecanski, Arturo C. 2009. “Latin America: The Missing Financial Crisis.” Munich Personal RePEcArchive.
the Global Economy.” IDB - Latin American and Caribbean Macroeconomic Report .
Prebisch, Ra´ul. 1949. “El Desarrollo Econ´omico de la Am´erica Latina Y Algunos de sus Principales Problemas.” El Trimestre Econ´omico 16(63(3)):347–43.
Reinhart, Carmen M., Vincent Reinhart & Chirstoph Trebesch. 2016. “Global Cycles: Capital Flows, Commodities, and Sovereign Defaults, 1815-2015.” American Economic Review Papers and Pro-ceedings .
Roberts, Kenneth M. 2011. The Left after Neoliberalism. In The Resurgence of the Latin American Left. Johns Hopkins University Press pp. 260–282.
Santiso, Javier. 2003. The Political Economy of Emerging Markets - Actors, Institutions and Financial Crises in Latin America. New York: Pallgrave McMillan.
Singer, Hans. W. 1950. “The Distribution of Gains between Investing and Borrowing Countries.” The American Economic Review 40(2):pp. 473–485.
URL: http://www.jstor.org/stable/1818065
Vegh, Carlos A. & Guillermo Vuletin. 2013. “The Road to Redemption: Policy Response to Crises in Latin America.”.
Vladkova-Hollar & Jeromin Zettelmeyer. 2008. “Fiscal Positions in Latin America: Have They Really Improved?” IMF WP 08/137.
1
Appendix
ven par bra chi col ecu bol arg uru per
−6 −4 −2 0 2 4 6 World GDP Growth (2009−2012)
ven bra arg ecu chi uru per col bol par
−6 −4 −2 0 2 4 6 GDP Growth (2013−2015) World
ven bra arg per uru ecu chi col bol par
−6 −4 −2 0 2 4 6
Change in GDP Growth Between the Two Periods
World
Figure 15: Winners & Losers
The figure shows average GDP growth in South America, in two periods of interest: the years that followed the 2008 crisis (2008-2012), and after the end of the commodity supercycle. It also shows the drop in economic growth occurred between the two periods. The horizontal line is the world average growth in both periods, and the world average drop in growth rates between one and the other.