Braz. J. of Develop.,Curitiba, v. 6, n.6, p.35783-35802 jun. 2020. ISSN 2525-8761
Simulation of liquid-liquid extraction to recover citric acid using 1-Butanol
as solvent
Simulação da extração líquido-líquido para recuperar ácido cítrico usando
1-Butanol como solvente
DOI:10.34117/bjdv6n6-225
Recebimento dos originais:09/05/2020 Aceitação para publicação:09/06/2020
Cláudia Bezerra Silva
Mestranda em Engenharia Química pela Universidade Federal do Rio Grande do Norte Instituição: Universidade Federal do Rio Grande do Norte
Endereço: Av. Senador Salgado Filho, 3000 – Lagoa Nova, Natal – RN, Brasil E-mail: [email protected]
Beatriz de Azevedo
Mestranda em Engenharia Química pela Universidade Federal do Rio Grande do Norte Instituição: Universidade Federal do Rio Grande do Norte
Endereço: Av. Senador Salgado Filho, 3000 – Lagoa Nova, Natal – RN, Brasil E-mail: [email protected]
Talita Kênya Oliveira Costa
Mestranda em Engenharia Química pela Universidade Federal do Rio Grande do Norte Instituição: Universidade Federal do Rio Grande do Norte
Endereço: Av. Senador Salgado Filho, 3000 – Lagoa Nova, Natal – RN, Brasil E-mail: [email protected]
Leonete Cristina de Araújo Ferreira Medeiros Silva
Doutoranda em Engenharia Química pela Universidade Federal do Rio Grande do Norte Instituição: Universidade Federal do Rio Grande do Norte
Endereço: Av. Senador Salgado Filho, 3000 – Lagoa Nova, Natal – RN, Brasil E-mail: [email protected]
Talison Kennedy Oliveira Costa
Graduando em Engenharia da Computação pelo Instituto Federal da Paraíba Instituição: Instituto Federal da Paraíba
Endereço: R. Tranqüilino Coelho Lemos, 671 – Dinamérica, Campina Grande – PB, Brasil E-mail: [email protected]
Raquel Revoredo Pinheiro de Souza
Mestranda em Engenharia Química pela Universidade Federal do Rio Grande do Norte Instituição: Universidade Federal do Rio Grande do Norte
Endereço: Av. Senador Salgado Filho, 3000 – Lagoa Nova, Natal – RN, Brasil E-mail: [email protected]
Braz. J. of Develop.,Curitiba, v. 6, n.6, p.35783-35802 jun. 2020. ISSN 2525-8761
RESUMO
O ácido cítrico é um ácido orgânico fraco que pode ser encontrado nos citrinos, com diversas aplicações industriais. O processo de separação por extração líquido-líquido pode ser usado para a recuperação do ácido cítrico, a partir de seu caldo de fermentação. O objetivo desse trabalho foi simular no software Aspen Plus o processo de recuperação do ácido cítrico usando como solvente o 1-butanol. Foram coletados da literatura dados experimentais de equilíbrio líquido-líquido para o sistema água + 1-butanol + ácido cítrico, nas temperaturas de 5,5 °C, 15 °C e 25 ºC, e posteriormente à aplicação das correlações de Othmer-Tobias e Hand foi possível assegurar a consistência termodinâmica desse conjunto de dados. O modelo termodinâmico NRTL foi utilizado, e seus parâmetros foram ajustados pelo código do TML. Com os resultados obtidos, pôde-se afirmar que houve recuperação do ácido cítrico, e a quantidade de solvente utilizado dependerá da concentração de ácido cítrico o qual é alimentado ao processo.
Palavras-chave: Equilíbrio líquido-líquido, consistência termodinâmica, ácido cítrico.
ABSTRACT
The citric acid is a weak organic acid that can be found in citrus, with several industrial applications. The aim of this paper was to simulate in the Aspen Plus the recuperation of citric acid using the 1-butanol as solvent. The experimental data of liquid-liquid equilibrium for the system water + 1-butanol + citric acid was collected under the 5,5 °C, 15 °C e 25 ºC temperatures from the literature. After Othmer-Tobias e Hand correlations appliance was possible to affirm the thermodynamic consistence of this data set. The NRTL thermodynamic model was used, and your parameters was adjusted with the TML code. The results points to recuperation of the citric acid, and the quantity of solvent used depends of the citric acid concentration that was alimented in the process.
Key words: Liquid-liquid equilibrium, thermodynamic consistency, citric acid.
1 INTRODUCTION
Citric acid, also known as hydrogen citrate, with its official name 2-hydroxy-1,2,3-propanotricarboxylic acid, is a weak organic acid that can be found in citrus fruits. The acidity of citric acid is due to the three carboxyl groups -COOH that can lose a proton in solutions. Therefore, a citrate ion is formed. Citrates are good pH controllers for acidic solutions (FIB, 2014).
Citric acid can be used to provide a pleasant and sour taste to food and drinks. It can also be applied in additive detergents, pharmaceuticals, cosmetics, and personal care products (Soccol et al., 2006).
The manufacture of citric acid can be performed through three processes: Koji, in which substrate is solid, using a specific strain of Aspergillus niger; surface fermentation, where the
Braz. J. of Develop.,Curitiba, v. 6, n.6, p.35783-35802 jun. 2020. ISSN 2525-8761 fungus mycelium (Aspergillus niger) grows on the surface of the static culture, where the fermentation product is collected; and fermentation by submerged culture, where the fungus develops entirely submerged in the liquid culture under agitation (FIB, 2014).
Citric acid can be separated by liquid-liquid extraction from its fermentation broth (Wennersten, 1983). Liquid-liquid extraction involves the mass transfer of components between two immiscible or partially immiscible liquid phases, the simplest form involving the transfer of a component (solute) between the liquid phases. The transfer of a dissolved component (solute) between the phases can be favored by the addition of agents that favor the separation of phases and/or also by the use of chemical reactions between solute and solvent (Perry et al., 1984).
Liquid-liquid equilibrium data founded in the literature show that simple solvents do not provide high partition coefficients (Mitchell et al., 1987). Only the work presented by Grinberg et al. (1991) reported the use of a simple solvent, 2-butanol, as effective for separating citric acid. The authors reported that, for 2-butanol as a solvent, the partition coefficient of citric acid is approximately 1. The main disadvantage of the system formed by water + citric acid + 2-butanol is that 2-butanol is partially soluble in water in presence of citric acid and, therefore, the region between the two phases is extremely narrow. Lintomen (1999) studied the ternary system water + 1-butanol + citric acid. It was found that this system has a two-phase region and greater selectivity when compared to the ternary system composed of 2-butanol.
Therefore, the aim of this work is to make an evaluation of the liquid-liquid extraction process for the recovery of citric acid, by collecting experimental equilibrium data from the water + 1-butanol + citric acid system, thermodynamic modeling and process simulation.
2 METHODOLOGY
2.1 EXPERIMENTAL DATA
The experimental data of liquid-liquid extraction with mass fractions in the aqueous and organic phases for the water + 1-butanol + citric acid system at temperatures of 5.5ºC, 15ºC were taken from Pinto's work (2003), and are presented in Tables 1 and 2, respectively.
Braz. J. of Develop.,Curitiba, v. 6, n.6, p.35783-35802 jun. 2020. ISSN 2525-8761
Table 1. Mass fraction for the water (1) + 1-butanol (2) + citric acid (3) system at 5.5ºC.
Aqueous Phase Mixing Point Organic Phase
w1 w2 w3 w1 w2 w3 w1 w2 w3 0,9181 0,0819 0 0,5002 0,4998 0 0,1823 0,8177 0 0,838 0,0843 0,0777 0,4766 0,4694 0,054 0,2005 0,7643 0,0353 0,8142 0,0843 0,1015 0,473 0,4554 0,0716 0,2095 0,7417 0,0489 0,7747 0,0821 0,1431 0,4418 0,4635 0,0947 0,2191 0,7224 0,0584 0,7216 0,0859 0,1925 0,4358 0,4251 0,1391 0,2628 0,9339 0,1033 0,6393 0,1126 0,2481 0,4128 0,3979 0,1892 0,3292 0,5061 0,1647
Table 2. Mass fraction for the water (1) + 1-butanol (2) + citric acid (3) system at 15ºC.
Aqueous Phase Mixing Point Organic Phase
w1 w2 w3 w1 w2 w3 w1 w2 w3 0,922 0,078 0 0,495 0,506 0 0,191 0,809 0 0,848 0,083 0,069 0,478 0,476 0,046 0,208 0,762 0,03 0,787 0,076 0,137 0,459 0,446 0,095 0,235 0,7 0,066 0,72 0,087 0,194 0,439 0,423 0,139 0,266 0,631 0,103 0,645 0,107 0,249 0,419 0,395 0,186 0,323 0,525 0,152
The data at 25ºC, on the other hand, were taken from the work of Lintomen et al. (2001) and are presented in Table 3.
Table 3. Mass fraction for the water (1) + 1-butanol (2) + citric acid (3) system at 25ºC.
Aqueous Phase Mixing Point Organic Phase
w1 w2 w3 w1 w2 w3 w1 w2 w3 0,5354 0,4646 0 0,9334 0,0666 0 0,2019 0,7981 0 0,5281 0,4464 0,0255 0,8967 0,0663 0,037 0,2143 0,7719 0,0138 0,5308 0,4259 0,0433 0,8722 0,0661 0,0617 0,2186 0,7588 0,0226 0,5227 0,4256 0,0517 0,8609 0,0653 0,0738 0,2163 0,7585 0,0252 0,5867 0,339 0,0743 0,8297 0,0651 0,1052 0,2161 0,7421 0,0418 0,4323 0,4122 0,1555 0,7124 0,0699 0,2177 0,2263 0,6812 0,0925 2.2 NRTL THERMODYNAMIC MODEL
The Non-Random Two-Liquid (NRTL) thermodynamic model correlates the activity coefficients (γ) of a compound with its molar fractions in the liquid phase (xi) and is also based
on Gibbs free energy, as shown in Equation (1) (Smith & Van Ness, 1959).
𝑔𝐸 𝑅𝑇 = 𝑥1𝑥2 ( τ21 G21 x1+x2 G21+ τ12 G12 x2+x1 G12) (1)
Braz. J. of Develop.,Curitiba, v. 6, n.6, p.35783-35802 jun. 2020. ISSN 2525-8761 Where 𝐺𝑗𝑖 and 𝜏𝑗𝑖 are given by Equations (2) and (3), respectively.
𝐺𝑗𝑖 = 𝑒 −𝛼𝑗𝑖𝜏𝑗𝑖 (2) 𝜏𝑗𝑖 = Aji/RT (3)
For a multicomponent system, with several components, the activity coefficient (γ) is given by Equation (4).
ln γi= ∑nj=1tji Gji xj ∑nl=1Gli xl + ∑ xj Gij ∑nl=1Glj xl n j=1 (tij-∑nr=1tri Gri xr ∑nl=1Gli xl ) (4) Where 𝛼𝑗𝑖 = 𝛼𝑖𝑗, where:
𝛼𝑗𝑖, 𝜏𝑗𝑖 and 𝜏𝑖𝑗 - model parameters; 𝑥𝑗 - composition of a component j. 𝛾𝑖 - the activity coefficient.
In this model, the parameters that were adjusted to the experimental data in Tables 1, 2 and 3, were the binary parameters Aij, Aji and 𝛼𝑗𝑖, and the results are shown in Table 4.
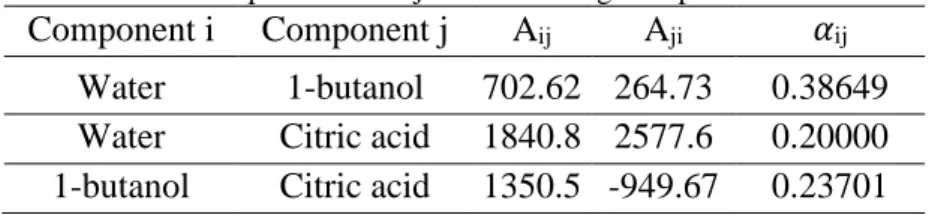
Table 4. NRTL parameters adjusted according to experimental data.
Component i Component j Aij Aji 𝛼ij
Water 1-butanol 702.62 264.73 0.38649 Water Citric acid 1840.8 2577.6 0.20000 1-butanol Citric acid 1350.5 -949.67 0.23701
2.3 THERMODYNAMIC CONSISTENCY OF EXPERIMENTAL DATA
The thermodynamic consistency of the data on the mooring lines was verified through the Othmer-Tobias (Equation (5)) and Hand (Equation (6)) correlations.
ln (1-w33 w33 ) =a + bln ( 1-w11 w11 ) (5) ln (w23 w33) = a + bln ( w21 w11) (6)
Braz. J. of Develop.,Curitiba, v. 6, n.6, p.35783-35802 jun. 2020. ISSN 2525-8761 Where w33, w23, w11 and w21 correspond to:
w33: mass fraction of 1-butanol in the organic phase; w23: mass fraction of citric acid in the organic phase; w11: mass fraction of water in the aqueous phase; w21: mass fraction of citric acid in the aqueous phase.
With Equations (5) and (6), the graphs of ln(1-ww 33
33 ) versus ln ( 1-w11 w11 ) (Othmer-Tobias) and ln (w23 w33) versus ln ( w21
w11) (Hand) were plotted on the Origin v.8 software. A linear trend
line was inserted and evaluated how close to 1 was the value of the correlation coefficient (R2).
For the thermodynamic data to be considered consistent, the adjustment of these graphs must be as close as possible to a line.
2.4 TERNARY GRAPHICS
The ternary graphs were plotted in ORIGIN v.8 and the results obtained from mass fraction calculated using the NRTL thermodynamic model, using the TML program, were compared to the experimental data.
The deviations for each tie line were calculated according to Equation (10):
Deviation% =𝐸𝑥𝑝𝑒𝑟𝑖𝑚𝑒𝑛𝑡𝑎𝑙−𝐶𝑎𝑙𝑐𝑢𝑙𝑎𝑡𝑒𝑑
𝐸𝑥𝑝𝑒𝑟𝑖𝑚𝑒𝑛𝑡𝑎𝑙 ∗ 100 (10)
Relative and average deviations were also calculated, Equations (11) and (12), respectively. Relative deviation%= (𝜎𝑚 𝑋̅ ⁄ ) *100 (11) Average deviation % =∑𝑛𝑖=1|𝑑𝑖| 𝑛 (12) Where: 𝜎𝑚= Standard deviation;
𝑋̅= Average of the individual deviations; 𝑑𝑖= Individual deviation;
Braz. J. of Develop.,Curitiba, v. 6, n.6, p.35783-35802 jun. 2020. ISSN 2525-8761 n = Number of data.
2.5 PROCESS SIMULATION
The simulation of liquid-liquid extraction was carried out in the Aspen Plus V8.8 simulator. Figure 1 corresponds to the simulated flowchart.
Figure 1. Flowchart simulated in Aspen Plus.
Where:
FEED: diluted stream of citric acid; SOLVENT: stream with pure solvent;
EXTRACT: extract stream, concentrated citric acid, mixed with the solvent; RAFFINAT: stream of raffinate, containing the water that was separated.
The EXTRACT block was used to simulate a liquid-liquid extraction column.
The NRTL thermodynamic model was used, and the parameters Aij and Aji calculated from the mathematical code program contained in the TML were inserted.
The operating specifications of the EXTRACT block were taken from Pinto (2003) according to Table 6.
Table 6. Operational data for the simulation of the liquid-liquid extraction column.
Feed (12% water + 88% citric acid, mass
fractions) 100 kg/h Solvent (1-butanol) 100 kg/h
Stages 5
Temperature 25ºC Pressure 1 atm
Braz. J. of Develop.,Curitiba, v. 6, n.6, p.35783-35802 jun. 2020. ISSN 2525-8761 Sensitivity analysis was performed by varying the amount of solvent in the feed from 100 kg/h to 1800 kg/h, with a response to the flow of citric acid in the extract stream for each of these variations, in order to find the amount of 1-butanol that extracts the highest percentage of citric acid from the feed stream.
Two analyzes were performed, one for a 12% water + 88% citric acid feed and the other for a 50% water + 50% citric acid feed.
The economic analysis was performed to verify the maximum profit of the process, according to Equations (7) - (9).
Profit ($/year)= (Receipt- Costs)*8760 (7) Receipt = 𝑉𝑒𝑥𝑡𝑟𝑎𝑐𝑡Citric acid(𝑘𝑔/ℎ𝑟)*𝑃
Citric acid($/𝑘𝑔) (8)
Costs = 𝑉𝑓𝑒𝑒𝑑𝑒𝑑1−𝑏𝑢𝑡𝑎𝑛𝑜𝑙(𝑘𝑔/ℎ𝑟)*𝑃
1−butanol*($/𝑘𝑔) (9)
The multiplication factor in Equation (7) corresponds to the number of hours that a year contains.
The prices of the components used are shown in Table 7:
Table 7. Prices of components used in the economic analysis.
Component Price ($/kg) 1-Butanol 0,02751
Citric acid 4,492
Source: Chemical book1; Fisher Scientific2.
A graph of the amount of solvent in kg/h versus the annual value of the receipt, costs and profit was plotted and it was evaluated for which solvent flow the profit was maximum.
3 RESULTS AND DISCUSSION
3.1 EXPERIMENTAL DATA CONSISTENCY TEST
The consistency test was performed with both models, Othmer-Tobias and Hand, the graphs were plotted for the experimental data for three temperature ranges. Linearized the
Braz. J. of Develop.,Curitiba, v. 6, n.6, p.35783-35802 jun. 2020. ISSN 2525-8761 experimental data according to Equations (5) and (6) and the graphs were plotted to evaluate the experimental consistency.
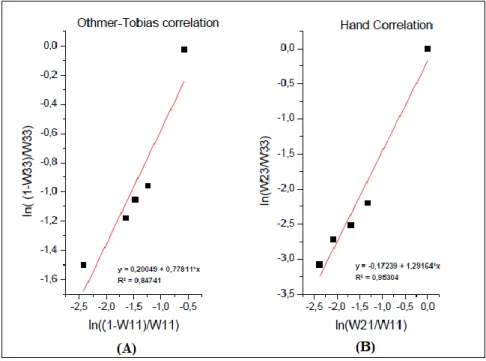
The Othmer-Tobias and Hand graphs for temperatures of 5.5ºC, 15ºC and 25ºC are shown in Figures 2 to 4.
Figure 2. Graphs of linearization of experimental data using the (A) Othmer-Tobias and (B) Hand model at 5.5ºC.
Figure 3. Graphs of linearization of experimental data using the (A) Othmer-Tobias and (B) Hand model at 15ºC.
Braz. J. of Develop.,Curitiba, v. 6, n.6, p.35783-35802 jun. 2020. ISSN 2525-8761
Figure 3. Graphs of linearization of experimental data using the (A) Othmer-Tobias and (B) Hand model at 25ºC.
Table 8 has the angular (a) and linear (b) coefficients and the value of R2 generated by the linearization calculated by the ORIGIN v.8 for each of the lines in Figures 2 to 4.
Table 8. Linearization data obtained in the graphs of the Othmer-Tobias and Hand models for three temperature ranges.
Correlation Othmer-Tobias Hand
Temperature (ºC) a B R2 a b R2 5,5 0,77811 0,20049 0,84741 1,29164 -0,17239 0,95304
15 0,70513 0,17377 0,92396 1,29967 -0,03293 0,996262 25 0,57372 -1,01875 0,34229 1,36807 -0,05044 0,99097
According to the results presented in Table 8, we observed that the Hand model was the best fitted the three temperatures, with an R2 close to 1, indicating a good thermodynamic consistency of the experimental data.
The fact that one model performed better than the other is due to the limitations of each correlation, having an influence on factors such as system miscibility, the number of components, operating temperature, among others.
Braz. J. of Develop.,Curitiba, v. 6, n.6, p.35783-35802 jun. 2020. ISSN 2525-8761 3.2 TERNARY GRAPHICS AND TIE LINES
The results obtained by TML using the NRTL thermodynamic model for the water (1) + 1-butanol (2) + citric acid (3) system, in the three temperatures, are shown in Tables I, II and III in Appendix, together with the their individual deviation from experimental and calculated data on molar fractions.
The symbols XiExp and XiCalc correspond to the experimental and calculated molar
fraction of the component, respectively.
Results related to the calculations of the relative deviations and the average absolute are presented in Tables 9, 10 and 11.
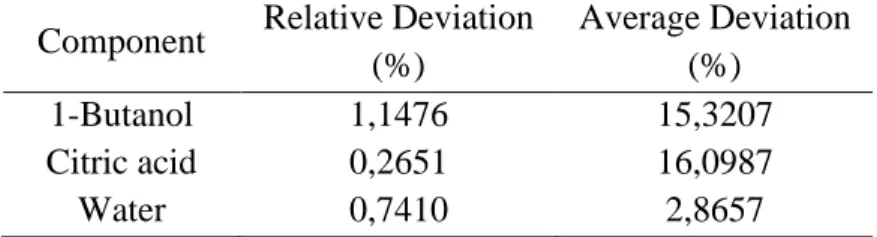
Table 9. Relative and average absolute deviation for the water (1) + 1-butanol (2) + citric acid (3) system data at 5.5° C.
Component Relative Deviation (%) Average Deviation (%) 1-Butanol 1,1476 15,3207 Citric acid 0,2651 16,0987 Water 0,7410 2,8657
Table 10. Relative and average absolute deviation for the water (1) + 1-butanol (2) + citric acid (3) system data at 15° C.
Component Relative Deviation (%) Average Deviation (%) 1-Butanol 1,2322 13,6760 Citric acid 0,2949 19,0169 Water 0,8231 2,4000
Table 11. Relative and average absolute deviation for the water (1) + 1-butanol (2) + citric acid (3) system data at 25° C.
Component Relative Deviation (%) Average Deviation (%) 1-Butanol 0,9065 14,9617 Citric acid 0,1389 7,2247 Water 0,6023 2,3601
Evaluating the relative deviations and the average absolute deviations, was noted that the data set at 25ºC present the smallest deviations and thus, a greater precision.
The average absolute deviations of the data at 5.5ºC and 15ºC were higher than expected, which is justified by the fact that this type of deviation corresponds to the average of the
Braz. J. of Develop.,Curitiba, v. 6, n.6, p.35783-35802 jun. 2020. ISSN 2525-8761 distances between each data, which gives us a notion of the variability in a data set. Therefore, the farther one data is from the other, the greater its deviation.
With the results of the experimental and calculated mass fractions, ternary graphs were plotted for the system studied at temperatures of 5.5ºC, 15ºC and 25ºC, as shown in Figure 5.
Figure 5. Ternary graph for the water system (1) + 1-butanol (2) + citric acid (3) at (A) 5.5 ºC (B) 15 ºC and (C) 25 ºC
(A) (B) (C)
Evaluating the ternary graphs and Tables 9, 10 and 11, it was concluded that the system at 25ºC, presented the least difference between the experimental and the calculated data, therefore, this temperature was established for operating the simulation of the liquid-liquid extraction process in Aspen Plus.
In all graphs of the Figure 5 and in Tables 8, 10 and 12, it was noted that the smallest errors are in the organic phase, because it is the region that has the largest mass fractions, decreasing the experimental error and, consequently, the variability of the data sets , approaching them.
3.3 PROCESS SIMULATION
The results obtained for a preliminary simulation with an input stream containing 12% Citric Acid and 100 kg/h solvent are shown in Table 12.
Braz. J. of Develop.,Curitiba, v. 6, n.6, p.35783-35802 jun. 2020. ISSN 2525-8761
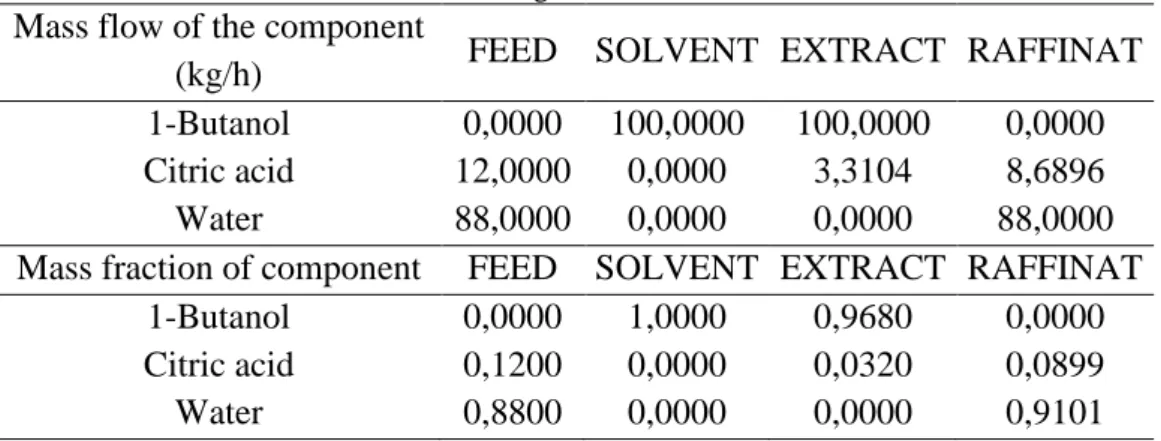
Table 12. Results of the simulation for 100 kg/h of 1-butanol and 12% citric acid in feed stream.
Mass flow of the component
(kg/h) FEED SOLVENT EXTRACT RAFFINAT 1-Butanol 0,0000 100,0000 100,0000 0,0000 Citric acid 12,0000 0,0000 3,3104 8,6896 Water 88,0000 0,0000 0,0000 88,0000 Mass fraction of component FEED SOLVENT EXTRACT RAFFINAT
1-Butanol 0,0000 1,0000 0,9680 0,0000 Citric acid 0,1200 0,0000 0,0320 0,0899 Water 0,8800 0,0000 0,0000 0,9101
Table 12 shows that practically all citric acid is found in the raffinate stream, that is, the extraction was not carried out efficiently, can be explained by the small flow of solvent feed into the process.
Figure 6 corresponds to the sensitivity analysis of the variation in the flow rate of 1-butanol in the process feed as a function of the amount of citric acid extracted.
Figure 6. Variation of 1-butanol (kg/h) in the SOLVENT stream as a function of the amount of Citric Acid (kg/h) in the EXTRACT stream, feed containing 12% acid.
In Figure 6, there is a tendency for the greater the amount of solvent, the greater the amount of citric acid extracted. It is noticed that with 900 kg/h of 1-butanol it is possible to extract all the citric acid that was feed, in other words, above this solvent flow we would only be increasing the costs of the process, without having any increase in receipt. This fact shows
Braz. J. of Develop.,Curitiba, v. 6, n.6, p.35783-35802 jun. 2020. ISSN 2525-8761 the importance of the simulation process, with a simple sensitivity analysis it is possible to see which operational point is more suitable for the extraction.
Even though these results are interesting about the process, we cannot fail to notice that a very large variation in solvent flow, such as from 450 to 900 kg/h, shows a small variation in the amount of citric acid extracted. Which leads us to question whether it is really feasible to spend 900 kg/h of 1-butanol to obtain such a small increase in the amount of acid extracted when compared to 450 kg/h of 1-butanol.
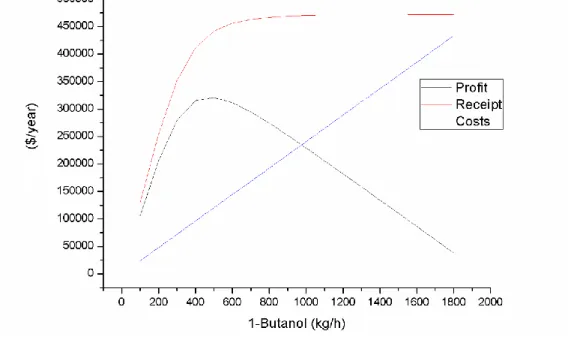
The answer for this question can only be obtained from the economic analysis of the process, presented in Figure 7, where there is a variation of 1-butanol according to the profit, receipt, and annual costs of the process.
Figure 7. Variation of 1-butanol (kg/h) in the SOLVENT stream as a function of profit, receipt, and process costs ($/year), for a feed stream with 12% acid.
In Figure 7, it can be seen that at 500 kg/h of 1-butanol, the profit is maximum, 321000 $/year, that is, it is economically more viable to use this amount of solvent to extract 11.23 kg/h of acid, than using 900 kg/h and extracting 12 kg/h.
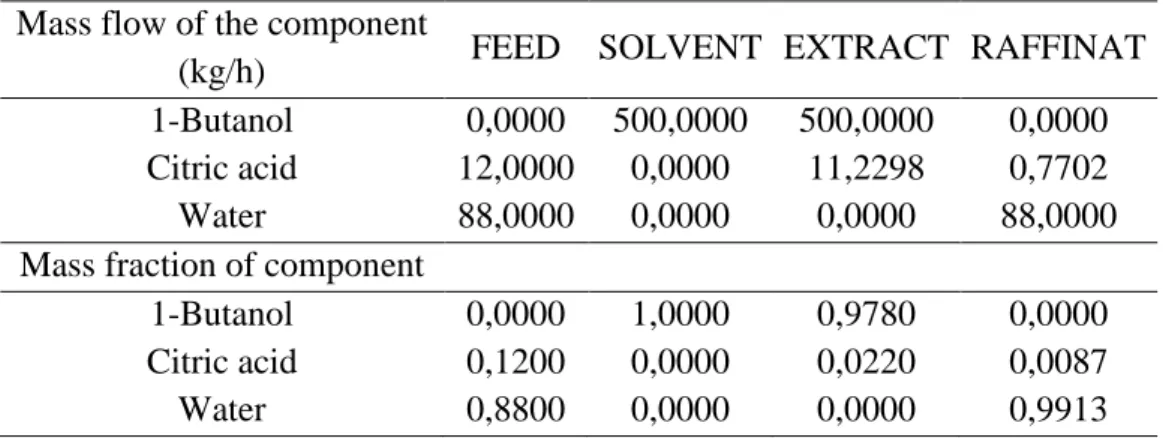
Thus, the amount of solvent used to simulate the process was 500 kg/h, and the results of the simulation for this solvent flow are shown in Table 13.
Braz. J. of Develop.,Curitiba, v. 6, n.6, p.35783-35802 jun. 2020. ISSN 2525-8761
Table 13. Simulation results for 500 kg/h of 1-butanol and 12% citric acid in feed stream.
Mass flow of the component
(kg/h) FEED SOLVENT EXTRACT RAFFINAT 1-Butanol 0,0000 500,0000 500,0000 0,0000 Citric acid 12,0000 0,0000 11,2298 0,7702 Water 88,0000 0,0000 0,0000 88,0000 Mass fraction of component
1-Butanol 0,0000 1,0000 0,9780 0,0000 Citric acid 0,1200 0,0000 0,0220 0,0087 Water 0,8800 0,0000 0,0000 0,9913
The same simulated procedures for feeding with 12% acid were performed for the case in which this current corresponded to 50% acid. Therefore, Figure 8 corresponds to the sensitivity analysis of the variation in the flow rate of 1-butanol in the process feed as a function of the amount of citric acid extracted.
Figure 8. Variation of 1-butanol (kg/h) in the SOLVENT stream as a function of the amount of citric acid (kg/h) in the EXTRACT stream, 50% acid in feed stream.
The same behavior of Figure 6 was observed in Figure 8, the increase in the amount of solvent increases the amount of acid extracted, reaching the maximum extraction in 600 kg/h of 1-butanol.
To evaluate the amount of optimum solvent from an economic point of view, in Figure 9, there is the variation of 1-butanol according to the profit, receipt and annual costs of the process.
Braz. J. of Develop.,Curitiba, v. 6, n.6, p.35783-35802 jun. 2020. ISSN 2525-8761
Figure 9. Variation of 1-butanol (kg/h) in the SOLVENT stream as a function of profit, receipt and process costs ($/year), 50% acid in feed stream.
In Figure 9 can be seen that at 400 kg/h of 1-butanol, the profit is maximum, 1.835.241,25 $/year, that is, it is economically more viable to use this amount of solvent to extract 49,11 kg/h of acid, than using 600 kg/h and extracting 50 kg/h.
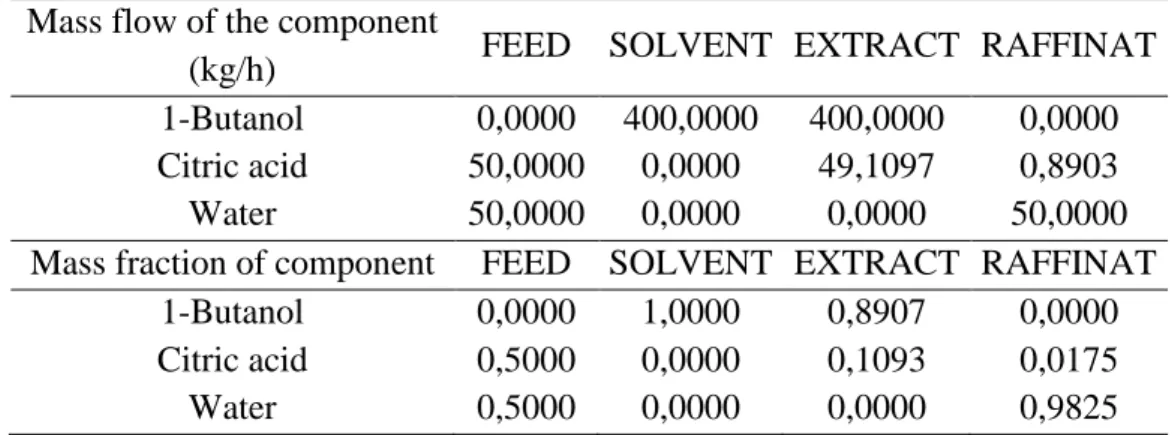
Therefore, the amount of solvent used to simulate the process was 400 kg/h, and the results of the simulation for this solvent flow are shown in Table 14.
Table 14. Simulation results for 400 kg/h of 1-butanol and 50% citric acid in the feed stream.
Mass flow of the component
(kg/h) FEED SOLVENT EXTRACT RAFFINAT 1-Butanol 0,0000 400,0000 400,0000 0,0000 Citric acid 50,0000 0,0000 49,1097 0,8903 Water 50,0000 0,0000 0,0000 50,0000 Mass fraction of component FEED SOLVENT EXTRACT RAFFINAT
1-Butanol 0,0000 1,0000 0,8907 0,0000 Citric acid 0,5000 0,0000 0,1093 0,0175 Water 0,5000 0,0000 0,0000 0,9825
Comparing the amounts of solvent needed for the two simulated cases, it was already expected that the feed stream containing 50% acid would require less solvent to have an economically viable extraction. This is because a greater amount of citric acid is being fed, making the wort more concentrated and less difficult to extract.
Braz. J. of Develop.,Curitiba, v. 6, n.6, p.35783-35802 jun. 2020. ISSN 2525-8761 Comparing the profits for both cases, 321000 $/year for 12% acid in the feed stream and 1.835.241,25 $/year for 50% of acid, it is visible that the profit for the second case is much higher, since uses less solvent to carry out the process.
However, it is worth noting that the evaluation of the costs of this process is a prior estimate, since the simulated extraction is part of a larger process, which did not encompass the route behind obtaining the citric acid supply stream, that is, we do not know whether the costs involved in obtaining a 50% acid stream are worth it compared to the 12% stream.
This shows that the work to obtain the operating points of a process, where not only one variable is taken into account, but a set of many others, which sometimes constitute a trade-off, that is, an economic action that aims to solve one problem but entails another, forcing a choice on the part of the engineer.
4 CONCLUSIONS
The parameters of the NRTL thermodynamic model were adjusted to the experimental liquid-liquid data, representing the studied system well. The interpretation of the ternary graphs referring to the three temperatures for the studied system, showed the existence of a small heterogeneous region with low mass fractions, which resulted in some high percentages of average deviations, since a small difference in decimal places, already considerably increases the experimental error. The Aspen Plus simulation allowed an overview of the extraction column, making it possible to evaluate some operating variables and their importance in the process. Even with this simulation an economically viable process has been obtained, it is still necessary to evaluate other parameters, to reach more accurate conclusions regarding the process.
REFERENCES
Chemicalbook.Disponívelem:<https://www.chemicalbook.com/ProductDetail_EN_446607.h tm>
FIB. Aplicações do Ácido Cítrico na indústria de alimentos. FOOD INGREDIENTS BRASIL Nº30,2014.<https://revistafi.com.br/upload_arquivos/201606/2016060501597001464892932 .pdf>
FISHER SCIENTIFIC. Disponível em: <https://www.fishersci.ca/shop/products/citric-acid-10-w-v-aqueous-solution-ricca-chemical-3/p-3251505>.
Braz. J. of Develop.,Curitiba, v. 6, n.6, p.35783-35802 jun. 2020. ISSN 2525-8761 GRINBERG, A.; POVIMONSKI, D.; APELBLAT, A. Liquid- Liquid Distribution Equilibrium in the Ternary system: Citric Acid - 2-Butanol - Water at 298.15 K. Solvent Extraction and Ion Exchange. 9, 1 (1991) 127-135.
LINTOMEN, L. Evaluation of the Liquid-Liquid Extraction for Recovery and Purification of Citric Acid (in Portuguese). M.Sc. Thesis, Chemical Engineering Faculty, State University of Campinas, 1999.
LINTOMEN, L., PINTO, R. T. P., BATISTA, E., MEIRELLES, A. J. A., MACIEL, M. R. W. Liquid-Liquid Equilibrium of the Water + Citric Acid + Short Chain Alcohols + Tricaprylin System at 298.15 K. Journal of Chemical and Engineering Data, v.46, p.546 - 550, 2001.
MITCHELL, R. J.; ARROWSMITH, A.; ASHTON, N. Mixed Solvent Systems for Recovery of Ethanol from Dilute Aqueous Solution by Liquid-Liquid Extraction Biotechnology and Bioengineering, 30 (1987) 348-351.
PERRY, R. H.; GREEN, D. W.; MALONEY, J. O. Chemical engineers' handbook. McGraw-Hill, New York, 1984.
PINTO, R.T. P. Extração Salina para Concentração de Ácido Cítrico: Dados de Equilíbrio e Simulação do Processo. Tese de Doutorado, Universidade Estadual de Campinas, Campinas, 2003.
SMITH, J. M., AND H. C. VAN NESS. Introduction to Chemical Engineering Thermodynamics. New York: McGraw-Hill, 1959.
SOCCOL, C. R.; VANDENBERGHE, L. P. S.; RODRIGUES, C.; PANDEY, A. New Perspectives for Citric Acid Production and Application. Food Technol. Biotechnol. 44 (2) 141–149 (2006).
WENNERSTEN, R. The Extraction of Citric Acid from Fermentation Broth Using a Solution of a Tertiary Amine. J. Chem. Tech. Biotechnol. 1983,33B, 85-94.
Braz. J. of Develop.,Curitiba, v. 6, n.6, p.35783-35802 jun. 2020. ISSN 2525-8761
APPENDIX
Table I. Experimental and calculated data of the mass fractions and individual deviations for the water (1) + 1-butanol (2) + citric acid (3) system at 5.5 ° C.
X1Exp X1Calc D (%) X2Exp X2Calc D (%) X3Exp X3Calc D (%)
0,9788 0,8779 10,3108 0,0212 0,1221 475,58907 0,0000 0,0000 0,0000 0,9679 0,8955 7,483056 0,0237 0,1029 334,64301 0,0084 0,0016 80,6183 0,9645 0,9000 6,681459 0,0243 0,0975 301,81294 0,0113 0,0025 78,1721 0,9587 0,9041 5,692083 0,0247 0,0922 273,59255 0,0166 0,0036 78,1457 0,9488 0,9072 4,384439 0,0275 0,0875 218,72495 0,0237 0,0053 77,6748 0,9266 0,8954 3,371429 0,0397 0,0854 115,37686 0,0337 0,0192 43,0902 0,4784 0,4806 0,455667 0,5216 0,5194 0,4179608 0,0000 0,0000 0,0000 0,5147 0,5238 1,783702 0,4768 0,4581 3,9300394 0,0085 0,0181 112,4706 0,5312 0,5391 1,47391 0,4571 0,4372 4,3707479 0,0116 0,0238 104,4712 0,5475 0,5574 1,798988 0,4388 0,4125 5,9824969 0,0137 0,0301 119,7955 0,5262 0,5793 10,09598 0,4545 0,3840 15,502255 0,0194 0,0367 89,3299 0,7039 0,6910 1,833963 0,2630 0,2536 3,5889442 0,0330 0,0554 67,6658
Table II. Experimental and calculated data of the mass fractions and individual deviations for the water (1) + 1-butanol (2) + citric acid (3) system at 15° C.
X1Exp X1Calc D (%) X2Exp X2Calc D (%) X3Exp X3Calc D (%)
0,9798 0,8787 10,3108 0,0202 0,1213 499,65398 0,0000 0,0000 0,0000 0,9696 0,8954 7,483056 0,0231 0,1033 347,2932 0,0073 0,0013 81,6327 0,9616 0,9070 6,681459 0,0227 0,0891 293,20688 0,0157 0,0039 75,4297 0,9484 0,9106 5,692083 0,0277 0,0816 194,51065 0,0239 0,0079 67,0293 0,9291 0,9012 4,384439 0,0373 0,0820 119,55532 0,0336 0,0169 49,7170 0,4926 0,4848 3,371429 0,5074 0,5152 1,5253636 0,0000 0,0000 0,0000 0,5248 0,5206 0,455667 0,4681 0,4632 1,0446932 0,0071 0,0163 128,0505 0,5716 0,5635 1,783702 0,4135 0,4046 2,1571947 0,0149 0,0319 113,5877 0,6205 0,6100 1,47391 0,3570 0,3456 3,2041228 0,0225 0,0444 97,3310 0,6944 0,6803 1,798988 0,2749 0,2651 3,5473895 0,0307 0,0546 77,6260
Braz. J. of Develop.,Curitiba, v. 6, n.6, p.35783-35802 jun. 2020. ISSN 2525-8761
Table III. Experimental and calculated data of the mass fractions and individual deviations for the water (1) + 1-butanol (2) + citric acid (3) system at 25°C.
X1Exp X1Calc D (%) X2Exp X2Calc D (%) X3Exp X3Calc D (%)
0,8258 0,8795 6,4978 0,1742 0,1205 30,8072 0,0000 0,0000 0,0000 0,8265 0,8863 7,2454 0,1698 0,1133 33,2921 0,0037 0,0004 89,5722 0,8315 0,8907 7,1210 0,1622 0,1086 33,0229 0,0064 0,0007 88,9937 0,8284 0,8922 7,6994 0,1639 0,1070 34,7261 0,0077 0,0008 89,1927 0,8678 0,8982 3,5042 0,1219 0,1003 17,6992 0,0103 0,0015 85,7420 0,7902 0,9096 15,1023 0,1831 0,0864 52,8313 0,0267 0,0041 84,7337 0,5100 0,4890 4,1176 0,4900 0,5110 4,2857 0,0000 0,0000 0,0000 0,5315 0,5005 5,8383 0,4653 0,4934 6,0391 0,0032 0,0061 91,2773 0,5396 0,5088 5,6972 0,4552 0,4810 5,6633 0,0052 0,0102 94,8375 0,5367 0,5119 4,6190 0,4574 0,4765 4,1623 0,0059 0,0116 98,1229 0,5397 0,5264 2,4772 0,4505 0,4558 1,1721 0,0098 0,0179 82,7198 0,5650 0,5700 0,8938 0,4134 0,3965 4,0812 0,0217 0,0335 54,5958