www.scielo.br/rbg
CHARACTERIZATION OF THE AGRICULTURE OCCUPATION
IN THE CERRADO BIOME USING MODIS TIME-SERIES
Antonio Felipe Couto Junior
1, Osmar Ab´ılio de Carvalho J´unior
2,
´Eder de Souza Martins
3and Vin´ıcius Vasconcelos
3ABSTRACT.This paper aims to characterize the agriculture expansion in the Cerrado biome using time-series data of Moderate Resolution Imaging Spectroradiometer (MODIS) sensor. The study area is the municipality of Lu´ıs Eduardo Magalh˜aes (Bahia State, Brazil), with recent growth of agribusiness. The methodology can be subdivided into the following steps: 1) noise reduction, 2) endmembers identification, and 3) mixing linear analysis. In the noise reduction was applied the following procedures: 1) moving median filter; 2) Minimum Noise Fraction (MNF) transformation, and 3) Inverse MNF transformation. The results provided a significant noise reduction, besides eliminating the atmospheric interferences. Three endmembers were identified: 1) Natural Vegetation; 2) Agriculture; 3) Change Areas (conversion). We used the linear mixture analysis with the selected endmembers to generate fraction images. These images evidenced the agriculture expansion from west to east. These methods overcame the spatial resolution restrictions and evidenced the potential for discriminating the phenology of growing agricultural crops.
Keywords: agriculture expansion, cerrado, time-series, MODIS, change detection.
RESUMO.O artigo objetiva caracterizar a expans˜ao agr´ıcola no bioma Cerrado utilizando dados de s´eries temporais do sensorModerate Resolution Imaging Spectro-radiometer(MODIS). A ´area de estudo ´e o munic´ıpio de Lu´ıs Eduardo Magalh˜aes (Bahia), com recente crescimento do agroneg´ocio. A metodologia pode ser subdividida nas seguintes etapas: (a) reduc¸˜ao do ru´ıdo, (b) identificac¸˜ao dos membros finais, e (c) an´alise linear de mistura. Na reduc¸˜ao do ru´ıdo foram aplicados os seguintes procedimentos: (a) filtro de mediana, (b) transformac¸˜aoMinimum Noise Fraction(MNF), e (c) transformac¸˜ao inversa MNF. Os resultados proporcionaram uma reduc¸˜ao significativa dos ru´ıdos, al´em da eliminac¸˜ao de interferˆencias atmosf´ericas. Trˆes membros finais foram identificados: 1) Vegetac¸˜ao Natural; 2) Agricultura; 3) ´Area de Mudanc¸a (Convers˜ao). Foi usada a an´alise de mistura linear com os membros finais selecionados para gerar as imagens de frac¸˜ao. Estas imagens evidenciaram a expans˜ao agr´ıcola partindo de oeste para leste. Os m´etodos apresentados proporcionaram a superac¸˜ao da limitac¸˜ao da resoluc¸˜ao espacial e evidenciaram um potencial de discriminac¸˜ao da fenologia de cultivos agr´ıcolas.
Palavras-chave: expans˜ao agr´ıcola, cerrado, s´eries temporais, MODIS, detecc¸˜ao de mudanc¸a.
1Universidade de Bras´ılia, Campus Planaltina, 70910-900 Planaltina, DF, Brazil. Phone: +55(61) 3107-8002 – E-mail: [email protected]
2Universidade de Bras´ılia, Departamento de Geografia, Campus Universit´ario Darcy Ribeiro, Asa Norte, 70910-900 Bras´ılia, DF, Brazil. Phone: +55(61) 3307-1559; Fax: +55(61) 3272-1909 – E-mail: [email protected]
3Embrapa – Centro de Pesquisa Agropecu´aria dos Cerrados, 73301-970 Planaltina, DF, Brazil. Phone: +55(61) 3388-9803 / 3388-9862 – E-mails: [email protected]; [email protected]
i i
“main” — 2014/3/22 — 12:42 — page 394 — #2
i i
394
CHARACTERIZATION OF THE AGRICULTURE OCCUPATION IN THE CERRADO BIOME USING MODIS TIME-SERIES INTRODUCTIONThe modern society depends on natural resources and crop areas for food production (Ramankutty & Foley, 1998). Approx-imately half of the terrestrial ecosystems without ice cover have already been converted or significantly modified by human activi-ties (Ramankutty & Foley, 1998; Lambin et al., 2003). These land-cover changes were intensified by the global population growth over the past 300 years (Goldewijk & Ramankutty, 2004), affect-ing the biogeochemical cycles (Ramankutty & Foley, 1998), bio-diversity (Lambin et al., 2003) and soil conservation (Trimble & Crosson, 2000).
Land-cover monitoring has been developed to understand the biologic system capacity to support human needs (Vitousek et al., 1997). Thus, the development of orbital sensors with high temporal-resolution (such as Moderate Resolution Imaging Spec-troradiometer – MODIS sensor) allows a continuous monitoring of the earth’s surface. (Huete et al., 2002; Latorre et al., 2007; Car-valho J´unior et al., 2008, 2009). These sensors obtain accurate measurements of the land-cover dynamics at regional to global scale, favoring the phenological studies of crops and natural ar-eas (Kang et al., 2003; Zhang et al., 2003; Sakamoto et al., 2005). In this approach, vegetation indices are most widely used for tem-poral analysis and change detection (Huete, 1988; Prince, 1991 a,b; Tucker et al., 1991; Defries & Townshend, 1994; Running et al., 1995; Wessels et al., 2004).
Thus, the digital image processing considering temporal pat-terns leads to a conceptual change in the remote sensing tech-niques. This paper aims to characterize the agriculture occupa-tion in the Cerrado biome using MODIS time-series vegetaoccupa-tion index data.
STUDY AREA
The study area is the Lu´ıs Eduardo Magalh˜aes (LEM) municipal-ity, mesoregion of Western Bahia State, entirely inside the Cer-rado Biome (Fig. 1). Its area is around 4,000 km2and its popula-tion is nearly 60,000 habitants (IBGE, 2010).
The climate of the study area is divided in two well-defined seasons: a dry and cold season (from May to September) and a rainy and hot season (from October to April). The annual aver-age precipitation is around 1,500 mm, varing from east to west. Annual average maximum and minimum temperature varies be-tween 21◦and 27◦C, respectively (Batistella et al., 2002).
In the geologic context, the area is over Late Cretaceous sed-iments of the Urucuia Group, constituted almost exclusively by eolian sandstone (Campos & Dardenne, 1997). Alluvial deposits
present in the large rivers are composed by sand and gravel (Silva, 2008).
LEM has a flat topography and average altitude of 900 me-ters (Castro et al., 2010). The soils are predominantly deep, well-weathered, nutrient-poor and acid, standing out Latosoil and Neosoil (Batistella et al., 2002). The altitude and the soil are the main determinant attributes of the floristic composition and vegetation structure in Cerrado physiognomies (Felfili & Silva J´unior, 2001). Agriculture and livestock activities occupied around 50%, in which the main products are: soya, corn, cotton and coffee (Batistella et al., 2002; Menke et al., 2009).
MATERIAL AND METHODS MODIS sensor data
The MODIS data aim to support the earth’s surface change as-sessment, providing a broader understanding of the global system functioning (Justice et al., 2002). These high temporal-resolution data are freely available at National Aeronautics Space Adiminis-tration (NASA), being georeferenced and corrected for the atmo-spheric effects, like clouds and aerosols, among others (Wolfe et al., 1998; Justice et al., 2002).
In this work was used the Normalized Difference Vegetation Index (NDVI), from the MOD13 product (16-days composite and 250 meters). This product is generated from the daily surface re-flectance (MOD09 – level 2) and is corrected for molecular scat-tering, ozone and aerosol absorption (Vermote et al., 2002). The vegetation index algorithm uses the surface reflectance data at level 2G (reprojected) and makes a 16 day temporal composition of these data (level 3).
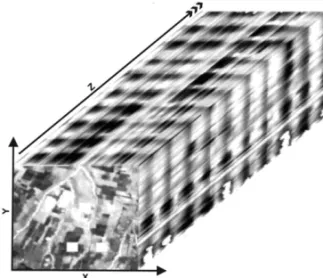
The temporal series was generated with these co-registered data, producing a temporal cube, whereX refers to longitude; Y , to latitude; and Z, to the Vegetation Index values (Fig. 2). In this context, theZ profile represents the target behavior along the time, and it is called temporal signature, similarly to the spec-tral signature related to hyperspecspec-tral data.
Noise treatment
The temporal series has limitations caused by atmospheric inter-ferences, cloud covers, radiometric variation (sensor oscillation, solar illumination, among others) or reveals the presence of other noises which are common features in the remote sensing (Du et al., 2001; Furby & Campbell, 2001). In this study, noise reduc-tion was achieved using the following methods (Carvalho J´unior et al., 2008, 2009): (a) moving filter; (b) Minimum Noise Fraction (MNF) transformation; and (c) Inverse MNF transformation.
Figure 1 – The Cerrado Biome and the study areas (in black) [left side image]; Lu´ıs Eduardo Magalh˜aes limit [right side image].
Figure 2 – 3D-temporal cube generated from co-registered images in an
increasing sequence corresponding to 10 years.
The median filter is a particular case of the ithorder statistic
of a real number series, using a moving window over the tem-poral signature and generating median values. Organizing the ob-servations in an increasing order, the median generates the central value of the window, requiring simple nonlinear operation.
The Minimum Noise Fraction (MNF) was originally developed to the hyperspectral image processing (Green et al., 1988) and it is also adequate for noise reduction of aerial gamma-ray survey (Dickson & Taylor, 1998). MNF is a linear transformation similar to the Principal Component Analysis (PCA), which maximizes the signal/noise ratio to order the images according to their quality (Green et al., 1988).
The separation of signal and noise components was obtained from visual inspection of the image quality and eigenvalue plot analysis. Considering only the signal components, the inverse
MNF transformation is performed in order to reset the values re-lated to the time-series vegetation indices, in which the white noise is eliminated (non-correlated noises with low variance).
In the noise reduction, the use of MNF alone (Carvalho J´unior et al., 2006; Couto J´unior et al., 2011) or combined with the median filter (Carvalho J´unior et al., 2008, 2009, 2012; Santana et al., 2010) has produced positive results to identify and charac-terize the Cerrado physiognomies.
Endmember Detection and Linear Mixture Analysis of Temporal Series
The convex geometry (simplex model) is intensely used to detect endmembers, as it establishes a spatial arrangement for image pixels that describes the material mixture relations (Tompkins et al., 1997; Winter, 1999; Batenson et al., 2000; Berman et al., 2004; Carvalho J´unior et al., 2005). This geom-etry is visualized in a n-dimensional space, where the axes are non-correlated and describe the inherent dimensionality, such as the Principal Component Analysis – PCA and MNF com-ponents (Smith et al., 1985, 1990; Bateson & Curtiss, 1993, 1996; Boardman, 1993). The vertices of this simplex are the pure
pixels, while the otherpixels inside the convex polygon are the results of their mixtures (Carvalho J´unior et al. 2003).
Carvalho J´unior et al. (2008) used this analysis with tempo-ral series considering natutempo-ral area. In this work, this procedure is used in natural and in agricultural areas. This approach allows a new conception for the convex geometry, in which we can notice vertices that represent time-invariant elements (same annual cy-cle) and other vertices that present strong changes of the land-use.
i i
“main” — 2014/3/22 — 12:42 — page 396 — #4
i i
396
CHARACTERIZATION OF THE AGRICULTURE OCCUPATION IN THE CERRADO BIOME USING MODIS TIME-SERIESFigure 3 – Original NDVI temporal profiles (dotted line) with noises. Temporal profiles smoothed
through median filter and Minimum Noise Fraction (MNF) association (black line).
The presence of two invariant points related to agriculture and nat-ural areas establishes an invariant axis, while the opposite vertex represents areas that present changes related to the conversion, i.e. that vary in the annual cycle.
The linear mixture analysis was applied to the temporal se-ries (Adams et al., 1995). Differently from the traditional spec-tral mixture analysis, in this approach we used temporal profiles with constant and variable annual cycles. This procedure allows us to describe the intensity of change, which opposes the initial proposal of quantifying the percentage of pure elements inside the pixel.
RESULTS
Noise treatment results
The combination of median filter and MNF transformation is very simple and fast. This combination also improved the data quality; reducing significantly impulse-type noises and eliminating areas with cloud cover or shade (Fig. 3).
This work used a median filter with window size equal to seven, eliminating impulse-type noises. Despite this elimination procedure, some degrees may be generated due to the value repetition.
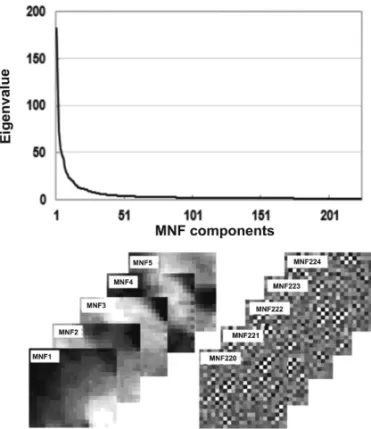
MNF transformation ordered the data according to the sig-nal/noise ratio, where the signal fractions are in the first com-ponents. In this study, the 20 first components were consid-ered as signal fraction, according to the eigenvalue plot and im-age visual quality (Fig. 4). MNF inverse transformation gener-ated a smoothed curve without white noises (non-correlgener-ated and low variance) and eventual small degrees (repeated value succes-sion) produced after the median filtering (Fig. 3).
Figure 4 – Eigenvalue plot (superior) and image decreasing quality (inferior).
Endmember results and Multiple Linear Regression of the Temporal Profiles
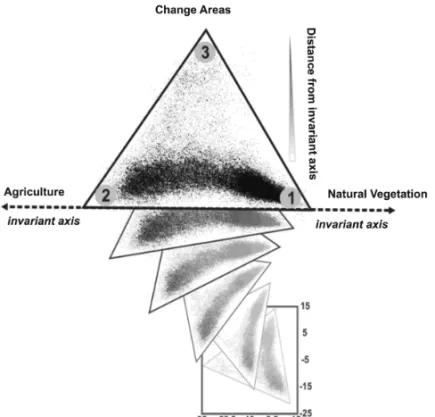
The scatter plot of the two first MNF components evidenced a triangular distribution of the data (Fig. 5). This triangle is rotated in order to place the invariant axis at its base, containing in its extremes the endmembers related to Natural Vegetation (1) and Agriculture (2). The third vertex corresponds to Change Area, i.e. area converted from natural to agricultural patterns. Thus, the dis-tance from the Cerrado-Agriculture invariant axis represents areas with larger inter-annual changes (Fig. 5).
Figure 5 – Scatter plot between 1stand 2ndMNF component; the numbers correspond to endmembers.
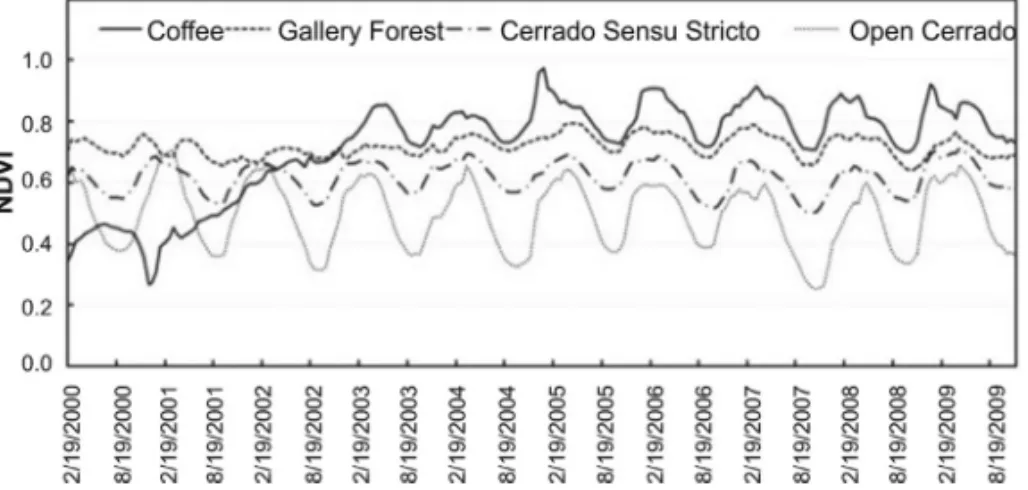
Figure 6 – Average temporal signatures of the endmembers.
The Cerrado endmember contains the phytophysiognomy in its natural state, presenting floristic wealth similar to other areas inside the biome (Felifili & Silva J´unior, 2001) (Fig. 5). The tem-poral profiles of preserved natural vegetation showed an average NDVI value of 0.6 with variations between 0.5 and 0.7 correspond to phenological behavior during the seasons, dry and rainy, re-spectively (Fig. 6).
The agriculture is represented by managements employed for more than 10 years. This cover presents a seasonal variation over 60% (Fig. 6), according to the management step (for example,
planting, canopy closure and harvesting). The greatest NDVI val-ues (∼0.8) evidence the maximum vigor of the crops and, on the other hand, the minimum ones (∼0.25) correspond to the low vegetal cover. The minor photosynthetic activity variations were observed in the areas that used the direct drilling system.
In this context, areas converted from natural vegetation to agriculture represent a fit to one of two patterns (Fig. 6). The most significant changes began in 2004. Before this period, there was a gradual increase of the NDVI values, representing the land-cover change transition.
i i
“main” — 2014/3/22 — 12:42 — page 398 — #6
i i
398
CHARACTERIZATION OF THE AGRICULTURE OCCUPATION IN THE CERRADO BIOME USING MODIS TIME-SERIESLinear mixture analysis was applied considering the tempo-ral endmembers. The fraction images of Cerrado and Agriculture indicated an farming increase from west to east, confirming the scenario observed in the last decade in this municipality (Menke et al., 2009) (Fig. 7).
Figure 7 – Cerrado fraction image (a) and Agriculture fraction image (b).
The lighter pixels in the natural vegetation fraction image usually represent the Gallery Forest. This is due to the associ-ation to water courses, which provides conditions to keep the photosynthetic activity, even during the dry period; reducing the seasonal variations. The savannic formations showed greater seasonal variations, according the arboreous density (Fig. 8). The temporal profile of coffee crop showed a similar behavior to the natural vegetation (mainly from 2003).
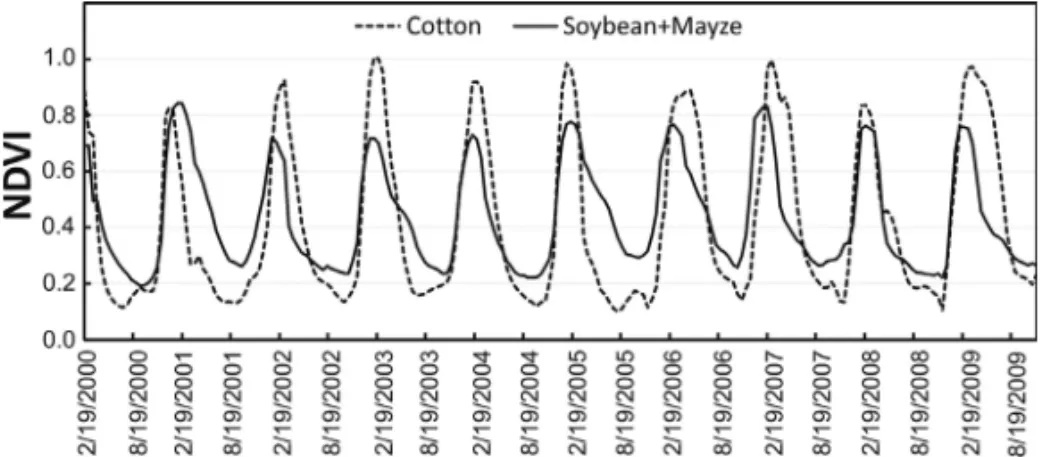
Agriculture is concentrated in the western part (Fig. 7), where the flat topography and the well-distributed rainfalls occurs, pro-vide favorable conditions for agricultural mechanization. In this region, rainfed agriculture stands out and it can be conventional (cotton) or direct drilling (soya and corn). The main difference
between these two managements resides in the cover between crops, which practically does not exist in the conventional plant-ing. This absence causes greater variation (amplitude) among the cotton management phases due to the soil exposition after harvesting (Fig. 9). In this way, the direct drilling employment, soya and corn in succession, for example, keeps the soil covered after harvesting.
The color composition (RGB) using fraction images (Agri-culture, Cerrado and Change Areas) show the different spatial-temporal patterns (Fig. 10). This result converges to the work carried out by Menke et al. (2009), which used more refined spa-tial resolution sensors: 1) Panchromatic Remote sensing Instru-ment for Stereo Mapping (2.5 m); 2) LANDSAT (30 m).
CONCLUSION
The use of temporal series is an important information source for land-use monitoring in the Cerrado biome. This earth’s surface monitoring has been carried out through the relation between or-bital data and biophysical factors, mainly the vegetation. With the improvement of MODIS sensor, the knowledgement of land cover changes has been expanded. This sensor aims to carry out sys-temic and regional studies, providing a large spectrum and tem-poral data volume. An important characteristic of this sensor is its daily temporal resolution.
In this work, MODIS data were obtained with a 16 day interval. However, these temporal-series are influenced by noises caused by atmospheric interferences, restricting the full employment. The noise elimination method of temporal signatures combining the Median Filter and Minimum Noise Fraction (MNF) techniques (Carvalho J´unior et al., 2012) allowed generating smoothed temporal profiles, indicating the main cover and management characteristics, highlighting three endmembers, related to this dynamics.
Figure 9 – Temporal profiles related to the planting of Cotton and of the Soya-Corn succession.
Figure 10 – Colored composition of the Temporal Linear Mixture Analysis
(TLMA) fractions, in which the RGB channels correspond to Agriculture, Natu-ral Vegetation and Change Area, respectively.
The first member is the Cerrado, that comprises the original phytophysiognomies with marked seasonality and the variation of its NDVI values associated to the photosynthetic activity and arboreous density. The second endmember corresponds to agri-culture patterns, in which there is no more natural vegetation for more than one decade. Also, it is characterized by the intense NDVI amplitude, which results from the planting and havesting periods. The last endmember, called Change Area, highlights the fit to the two previous members and represents cover changes only in the last 10 years.
The methodological procedures surpassed the spatial res-olution limitation through its temporal high-resres-olution. In this way, this work presents a potential to discriminate the landscape changes.
ACKNOWLEDGMENTS
This article has been developed in the scope of the estimated ac-tivities of the following projects: (a) “Desenvolvimento de meto-dologias de processamento digital de imagens de sat´elite mul-tisensores para o monitoramento do uso da terra e an´alise am-biental dos fragmentos florestais da bacia do Rio S˜ao Francisco” which refers to the announcement 35/2006 of the CT-Hidro fi-nanced by Conselho Nacional de Desenvolvimento Cient´ıfico e Tecnol´ogico (CNPq); and (b) “Evoluc¸˜ao e an´alise ambiental na regi˜ao do Cerrado da Bacia do Rio S˜ao Francisco” related to the process 193.000.49/2008 financed by FAP-DF. Also, the authors would like to thank CAPES for conceding the doctorate scholar-ship to the researcher Antonio Felipe Couto Junior; and CNPq for financial support from fellowship the researchers: Osmar Ab´ılio de Carvalho J´unior and ´Eder de Souza Martins.
REFERENCES
ADAMS JB, SABOL DE, KAPOS V, ALMEIDA FILHO R, ROBERTS DA, SMITH MO & GILLESPIE AR. 1995. Classification of multispectral images based on fractions of endmembers: application to land-cover change in the Brazilian Amazon. Remote sensing of Environment, 52: 137–154.
BATESON CA, ASNER GP & WESSMAN CA. 2000. Endmember bun-dles: a new approach to incorporating endmember variability into spectral mixture analysis. IEEE Transactions on Geoscienceand Remote Sensing, 38(2): 1083–1094.
BATESON CA & CURTISS B. 1993. A tool for manual endmember selec-tion and spectral unmixing. In: Annual JPL Airborne Geosciences Work-shop, 4, Pasadena, CA. Summaries, JPL Publication 93-26, p. 3–6. BATESON CA & CURTISS B. 1996. A method for manual endmember selection and spectral unmixing. Remote Sensing of Environment, 55: 229–243.
i i
“main” — 2014/3/22 — 12:42 — page 400 — #8
i i
400
CHARACTERIZATION OF THE AGRICULTURE OCCUPATION IN THE CERRADO BIOME USING MODIS TIME-SERIES BATISTELLA M, GUIMAR˜AES M, MIRANDA EE, VIEIRA HR,VALLA-DARES GS & MANGABEIRA JAC. 2002. Monitoramento da expans˜ao agropecu´aria na Regi˜ao Oeste da Bahia. Campinas: Embrapa Monitora-mento por Sat´elite. DocuMonitora-mentos, 20, 39 pp.
BERMAN M, KIIVERI H, RYAN L, ERNST A, DUNNE R & HUNTINGTON JF. 2004. ICE: A statistical approach to identifying endmembers in hyper-spectral images. IEEE Transactions on Geoscience and Remote Sensing, 42(10): 1–11.
BOARDMAN JW. 1993. Automated spectral unmixing of AVIRIS data using convex geometry concepts: In: Annual JPL Airborne Geosciences Workshop, 4, Pasadena, CA. Summaries, JPL Publication 93-26, p. 11–14.
CAMPOS JEG & DARDENNE MA. 1997. Estratigrafia e sedimentac¸˜ao da Bacia Sanfranciscana: uma revis˜ao. Revista Brasileira de Geociˆencias, 27: 269–282.
CARVALHO J ´UNIOR OA, CARVALHO APF, GUIMAR˜AES RF, MENESES PR & SHIMABUKURO Y. 2003. Mistura espectral: (I) detecc¸˜ao dos mem-bros finais utilizando a geometria do Simplex. Espac¸o Geografia, 6(1): 147–173.
CARVALHO J ´UNIOR OA, GUIMAR˜AES RF, MARTINS ES, CARVALHO APF & GOMES RAT. 2005. Aplicac¸˜ao do m´etodo de identificac¸˜ao es-pectral para imagens do sensor ASTER em ambiente de cerrado. Revista Brasileira de Geof´ısica, 23(2): 159–172.
CARVALHO J ´UNIOR OA, HERMUCHE PM & GUIMAR˜AES RF. 2006. Identificac¸˜ao regional da floresta estacional decidual na bacia do rio Paran´a a partir da an´alise multitemporal de imagens MODIS. Revista Brasileira de Geof´ısica, 24(3): 319–332.
CARVALHO J ´UNIOR OA, SAMPAIO CS, SILVA NC, COUTO JUNIOR AF, GOMES RAT, CARVALHO APF & SHIMABUKURO YE. 2008. Clas-sificac¸˜ao de padr˜oes de savana usando assinaturas temporais NDVI do sensor MODIS no Parque Nacional da Chapada dos Veadeiros. Revista Brasileira de Geof´ısica, 26(4): 505–517.
CARVALHO J ´UNIOR OA, COUTO JUNIOR AF, SILVA NC, MARTINS ES, CARVALHO APF & GOMES RAT. 2009. Avaliac¸˜ao dos classifica-dores espectrais de M´ınima Distˆancia Euclidiana e Spectral Correlation Mapper em s´eries temporais NDVI-MODIS no campo de instruc¸˜ao militar de Formosa (GO). Revista Brasileira de Cartografia, 61: 399–412. CARVALHO J ´UNIOR OA, DA SILVA NC, DE CARVALHO APF, COUTO J ´UNIOR AF, SILVA CR, SHIMABUKURO YE, GUIMAR˜AES RF & GOMES RAT. 2012. Combining noise-adjusted principal components transform and median filter techniques for denoising modis temporal signatures. Revista Brasileira de Geof´ısica, 30(2): 47–157.
CASTRO KB, MARTINS ES, GOMES MP, REATTO A, LOPES CA, PASSO DP, LIMA LAS, CARDOSO WS, CARVALHO J ´UNIOR OA & GOMES RAT. 2010. Caracterizac¸˜ao Geomorfol´ogica do munic´ıpio de Lu´ıs Eduardo
Magalh˜aes, BA escala 1:100.000. Boletim de Pesquisa e Desenvolvi-mento 288, Embrapa – CPAC, Planaltina, DF, 33 pp.
COUTO J ´UNIOR AF, CARVALHO J ´UNIOR OA, MARTINS ES, SANTANA OA, SOUZA VV & ENCINA JI. 2011. Tratamento de ru´ıdos e caracterizac¸˜ao de fisionomias do Cerrado utilizando s´eries temporais do sensor MODIS. Revista ´Arvore, 35: 699–705.
DEFRIES R & TOWNSHEND JRG. 1994. NDVI derived land cover clas-sification at global scales. International Journal of Remote Sensing, 15: 3567–3586.
DICKSON B & TAYLOR G. 1998. Noise reduction of aerial gamma-ray survey. Exploration Geophysics, 29: 324–329.
DU Y, CIHLAR J, BEAUBIEN J & LATIFOVIC R. 2001. Radiometric nor-malization, composition, and quality control for satellite high resolution image mosaics over large areas. IEEE Transactions on Geoscience and Remote Sensing, 39: 623–634.
FELFILI JM & SILVA JUNIOR MC. 2001. Biogeografia do bioma Cer-rado: estudo fitofisionˆomico da Chapada do Espig˜ao Mestre do S˜ao Francisco. Bras´ılia, Universidade de Bras´ılia, Departamento de Enge-nharia Florestal, 152 pp.
FURBY SL & CAMPBELL NA. 2001. Calibrating images from different dates to like-value digital counts. Remote Sensing of Environment, 77: 186–196.
GOLDEWIJK K & RAMANKUTTY N. 2004. Land cover changes over the last three centuries due to human activities: the availability of new global data set. GeoJournal, 61: 335–344.
GREEN AA, BERMAN M, SWITZER P & CRAIG MD. 1988. A transfor-mation for ordering multispectral data in terms of images quality with implications for noise removal. IEEE Transactions on Geoscience and Remote Sensing, 26: 65–74.
HUETE AR. 1988. A soil-adjusted vegetation index (SAVI). Remote Sensing of Environment, 25: 295–309.
HUETE AR, DIDAN K, MIURA T, RODRIGUEZ P, GAO X & FERREIRA LG. 2002. Overview of the radiometric and biophysical performance of the MODIS vegetation indices. Remote Sensing of Environment, 83: 195–213.
IBGE. 2010. Instituto Brasileiro de Geografia e Estat´ıstica. Censo Demo-gr´afico. Available on: www.ibge.gov.br. Access on Jan 30, 2012. JUSTICE CO, TOWNSHEND JRG, VERMOTE EF, MASUOKA E, WOLFE RE, SALEOUS N, ROY DP & MORISETTE JT. 2002. An overview of MODIS Land data processing and product status. Remote Sensing of Environment, 83: 3–15.
KANG S, RUNNING SW, LIM J, ZHAO M, PARK C & LOEHMAN R. 2003. A regional phenology model for detecting onset of greenness in temperate mixed forests, Korea: An application of MODIS leaf area index. Remote Sensing of Environment, 86: 232–242.
LAMBIN E, GEIST H & LEPERS E. 2003. Dynamics of use and land-cover changes in tropical regions. Annual Review of Environment Re-sources, 28: 205–241.
LATORRE ML, CARVALHO J ´UNIOR OA, SANTOS JR & SHIMABUKURO YE. 2007. Integrac¸˜ao de dados de sensoriamento remoto multi-reso-luc¸˜oes para a representac¸˜ao da cobertura da terra utilizando campos cont´ınuos de vegetac¸˜ao e classificac¸˜ao por ´arvores de decis˜ao. Revista Brasileira de Geof´ısica, 25(1): 63–74.
MENKE AB, CARVALHO J ´UNIOR OA, GOMES RAT, MARTINS ES & OLIVEIRA SN. 2009. An´alise das mudanc¸as do uso agr´ıcola da terra a partir de dados de sensoriamento remoto multitemporal no munic´ıpio de Luis Eduardo Magalh˜aes (BA – Brasil). Sociedade e Natureza, 21: 315– 326.
PRINCE SD. 1991a. A model of regional primary production for use with coarse-resolutionsatellite data. International Journal of Remote Sensing, 12: 1313–1330.
PRINCE SD. 1991b. Satellite remote sensing of primary production: Comparison of results for Sahelian grasslands 1981-1988. International Journal of Remote Sensing, 12: 1301–1313.
RAMANKUTTY N & FOLEY J. 1998. Characterizing patterns of global land use: an analysis of global cropland data. Global Biogeochemistry Cycles, 12: 667–685.
RUNNING SW, LOVELAND TR, PIERCE LL, NEMANI RR & HUNT ERJ. 1995. A remote sensing based vegetation classification logic for global land cover analysis. Remote Sensing of Environment, 51: 39–48. SAKAMOTO T, YOKOZAWA M, TORITANI H, SHIBAYAMA M, ISHITSUKA N & OHNO HA. 2005. Crop detection method using time-series MODIS data. Remote Sensing of Environment, 96: 366–374.
SANTANA OA, CARVALHO J ´UNIOR OA, PIMENTEL CMM, GOMES RAT & OLIVEIRA SN. 2010. Modelagem de espectros temporais NDVI-MODIS, no per´ıodo de 2000 a 2008, na Bacia do Rio Paracatu, Brasil. Revista Brasileira de Geof´ısica, 28(1): 47–60.
SILVA CR. 2008. Geodiversidade do Brasil: conhecer o passado, para entender o presente e prever o futuro. Rio de Janeiro, CPRM, 264 pp.
SMITH MO, JOHNSON PE & ADAMS JB. 1985. Quantitative determi-nation of mineral types and abundances from reflectance spectra using principal components analysis. Proc. 15thLunar Planet. Sci. Conf. Part 2. J. Geophys. Res., 90, Suppl., p. C797–C804.
SMITH MO, USTIN SL, ADAMS, JB & GILLESPIE AR. 1990. Vegetation in deserts: I. a regional measure of abundance from multispectral images: Remote Sensing of the Environment, 31: 1–26.
TOMPKINS S, MUSTARD JF, PIETERS CM & FORSYTH DW. 1997. Optimization of endmembersfor spectral mixture analysis. Remote Sens-ing of Environment, 59: 472–489.
TRIMBLE S & CROSSON P. 2000. US soil erosion rates: myth and reality. Science, 289: 248–250.
TUCKER CJ, NEWCOMB WW, LOS SO & PRICE SD. 1991. Mean an inter-year variation of growing season normalized difference vegetation index for the Sahel 1981-1989. International Journal of Remote Sensing, 12: 1133–1135.
VERMOTE E, EL SALEOUS N & JUSTICE C. 2002. Atmospheric correc-tion of the MODIS data in the visible to middle infrared: First results. Remote Sensing of Environment, 83(1-2): 97–111.
VITOUSEK PM, MOONEY HA, LUBCHENCO J & MELILLO JM. 1997. Human domination of Earth’s ecosystems. Science, 277: 494–499. WESSELS KJ, PRINCE SD, FROST PE & VAN ZYL D. 2004. Assessing the effects of human-induced land degradation in the former homelands of northern South Africa with a 1 km AVHRR NDVI time-series. Remote Sensing of Environment, 91: 47–67.
WINTER M. 1999. Fast autonomous spectral endmember determination in hyperspectral data. In: Int. Conf. Applied Geologic Remote Sensing, 13, Vancouver, BC, Canada, v. 2, p. 337–344.
WOLFE RE, ROY DP & VERMOTE E. 1998. MODIS land data storage gridding and compositing methodology: level 2 grid. IEEE Transactions on Geoscience and Remote Sensing, 36: 1324–1338.
ZHANG X, FRIEDL MA, STRAHLER AH, HODGES JCF, GAO F, REED BC & HUETE A. 2003. Monitoring vegetation phenology using MODIS. Remote Sensing of Environment, 84: 471–475.
Recebido em 2 abril, 2012 / Aceito em 28 junho, 2012 Received on April 2, 2012 / Accepted on June 28, 2012
i i
“main” — 2014/3/22 — 12:42 — page 402 — #10
i i
402
CHARACTERIZATION OF THE AGRICULTURE OCCUPATION IN THE CERRADO BIOME USING MODIS TIME-SERIES NOTES ABOUT THE AUTHORSAntonio Felipe Couto Junior. Undergraduate degree in Forestry Engineering by Universidade de Bras´ılia in 2003 and master degree in Forestry Science by the same
institution in 2007. Is studying to obtain a doctor degree in Applied Geoscience at Instituto de Geociˆencias of Universidade de Bras´ılia. Presently is a professor at Universidade de Bras´ılia, campus Planaltina. Carries out researches on temporal series analyses, cover changes, relations among relief, soil and vegetation.
Osmar Ab´ılio de Carvalho J ´unior. Undergraduate degree in Geology by Universidade de Bras´ılia in 1990. Master and doctor degree in Mineral Prospecting by
Universidade de Bras´ılia in 1995 and 2000, respectively. Worked as a researcher of Instituto Nacional de Pesquisas Espaciais (INPE) between 2002 and 2004. Presently is a professor at Universidade de Bras´ılia and got a research productivity scholarship from CNPq. Carries out researches on digital processing of multispectral and hyperspectral images.
´Eder de Souza Martins. Undergraduate degree in Geology by Universidade de Bras´ılia, UNB, in 1987. Master (1987) and doctor (1999) degree in Geology by the
same university. Presently works at Empresa Brasileira de Pesquisa Agropecu´aria, Centro de Pesquisa Agropecu´aria dos Cerrados, CPAC, coordinating the pedology laboratory. Carries out researches on methodologies for the cartographic mapping and generalization of pedologic information.
Vin´ıcius Vasconcelos. Undergraduate degree in Geography by Universidade de Bras´ılia (2006). Master degree by the post-graduate program in the Geoprocessing
for Territorial and Environmental Management area of the Departamento de Geografia. Experience in Geoscience area with emphasis in geomorphology, pedology and geoprocessing applied to pedogeomorphologic mapping.