7
Laser-Light Scattering Approach
to Peptide–Membrane
Interaction
Marco M. Domingues and Nuno C. Santos
7.1. Introduction . . . 147
7.2. Static Light Scattering . . . 148
7.2.1. Sample Preparation . . . 151
7.3. Dynamic Light Scattering . . . 151
7.3.1. Sample Preparation . . . 154
7.4.
ζ-Potential. . . 155
7.4.1. Sample Preparation . . . 157
7.5. Applications . . . 158
7.6. Other Practical Aspects . . . 164
7.7. Conclusion . . . 165
Acknowledgments . . . 166
Abstract
Membrane-active peptides are becoming widely used, mainly due to their high therapeutic potential. Although the therapeutic action is characterized, the mechanisms of interaction are often unclear or controversial. In biophysical studies, non-invasive techniques are overlooked when studying the effect of peptides on membranes. Light scattering techniques, such as dynamic light scat-tering and static light scatscat-tering, can be used as tools to determine whether pro-motion of membrane aggregation in the presence of peptides and of self-peptide aggregation in solution occurs. More recently, light scattering has been used for evaluating the alteration on membrane surface charge (ζ-potential) promoted by membrane–peptide interactions. The data obtained by these techniques (either by themselves or combined with complementary experimental approaches) therefore yield valuable elucidations of membrane-active peptides’ mechanisms of action at the molecular level.
7
Laser-Light Scattering Approach to
Peptide–Membrane Interaction
Marco M. Domingues and Nuno C. Santos
Instituto de Medicina Molecular, Faculdade de Medicina,
Universidade de Lisboa, Lisboa, Portugal*
7.1. Introduction
The basis of the light-scattering theory was developed by John William Strutt (Lord Rayleigh) in the final decades of the 19th century.1 In the first half of the 20th century Debye and Gans2developed the theory, as
*Institute of Molecular Medicine, School of Medicine, University of Lisbon, Lisbon, Portugal
well as methods based on it. Because of the noninvasive properties of light-scattering-based techniques, they can be useful tools for studying the action of membrane-active peptides. These techniques have been used to determine the weight-average molecular weight (Mw), size (given
by the value of the intensity-weighted mean hydrodynamic radius, RH),
and aggregation behavior of peptide in solution, either alone or interact-ing with more complex systems such as lipid membranes. The most fre-quently used techniques based on light scattering are the so-called intensity or static light scattering (SLS) and dynamic light scattering (DLS). SLS was first developed by Debye and Zimm in the 1940s for the determination of Mw and intermolecular interactions.3–5 It is
advanta-geous for studies of proteins or peptide aggregation in solution.6–8 Peptide aggregation monitored by SLS can yield stoichiometry data by direct relation to the calculated Mw. DLS began to be applied as an
ana-lytical tool only in the 1960s, after lasers were developed and used as monochromatic and intense light sources. It is used to measure particle hydrodynamic diameter and size distribution of molecules or supramol-ecular aggregates.9–15Another technique associated with light-scattering phenomena arose later: the ζ-potential determination. The parameter quantifies the charge of the molecule or supramolecular aggregate at its surface, in contact with the aqueous environment. Thus, light-scattering spectroscopy is of potential applicability in membrane-active-peptide work: (1) as DLS and SLS techniques are very sensitive to changes in shape and size, peptide aggregation or peptide-induced aggregation of lipid membranes can be easily detected, and (2) charged peptides inter-act with charged vesicles, altering the electrophoretic mobility of the resulting supramolecular entities and enabling ζ-potential measurements to be used to study the membrane events involved in the process.
7.2. Static Light Scattering
SLS uses the time-averaged intensity of the sample in a long time scale relative to molecular diffusion (seconds to minutes) instead of fluctua-tions of the signal because of molecular dynamics in the scattering vol-ume (microsecond time range). This technique enables the determination
of Mw (typically ranging from 1 kDa to 20 MDa) and the second virial
coefficient (A2) through the Zimm method:4,5
(7.1) where (7.2) (7.3) and (7.4) In the preceding equations, C is the concentration of the scattering particles, K—the optical constant, A2—the second virial coefficient,
NA—Avogadro’s number, Rθ—the Rayleigh ratio, IR—the reference
scat-tering intensity (pure toluene and benzene are the more commonly used reference samples), IA—the residual intensity of the solute (i.e., the
scat-tering intensity of the sample after subtracting the scatscat-tering intensity of the solvent), n0—the solvent refractive index, nR—the reference
refractive index, λ0—the vacuum wavelength of the incident light, dn/dC
the—refractive index increment (relates to how much the refractive index of a solution changes with the concentration of the solute), RR—
the Rayleigh ratio of the reference, P(θ)—the intraparticle structure factor (accounts for the interference of light scattered from different points of the same particle), θ—the angle at which the intensity is being measured relative to the transmitted beam, Rg—the radius of gyration
(shape-independent parameter related to the dimension of the scattering particle), and q is the scattering vector:
(7.5) q= n ⎛ ⎝⎜ ⎞ ⎠⎟ 4 2 0 π λ θ sin . P( )θ − = +⎛ q Rg . ⎝ ⎜ ⎞ ⎠ ⎟ 1 2 2 1 3 R I n I n R A R R R θ= 0 2 2 , K N n dn dC A = ⎛ ⎝⎜ ⎞ ⎠⎟ 2 2 0 4 0 2 π λ , KC Rθ M PW θ A C = 1 +2 2 ( ) ,
In the Zimm method (Fig. 7.1), Mw is calculated by extrapolation of
the scattered intensity both to zero angle (Eq. 7.6) and infinite dilution
(Eq. 7.7). A2describes the interparticle interactions: positive values
indi-cate a tendency toward stable scattering particles (monomers) in solu-tion, while negative values reveal a tendency for aggregation (i.e., solute–solute interactions superimpose to solute–solvent interactions). It is calculated by the slope of Eq. 7.6.
(7.6)
(7.7)
In the simpler Debye method, intensity measurements are conducted at different concentrations but not at different scattering angles, therefore allowing the determination of Mwand A2, but not of Rg.16,17This method
applies to very dilute solutions to avoid multiple scattering. KC Rθ MW P θ = 1 ( ) .−1 KC Rθ MW A C = 1 +2 2 ,
Figure 7.1. Representation of the Zimm plot method and the parameters A2, Mwand Rg,
obtained from the slopes and intercept of the lines obtained from the extrapolations of the experimental data to zero scattering angle and zero concentration.
The scattered intensity depends on the shape and dimension of the particle and is proportional to the sixth power of the particle radius (i.e., squared volume). Thus, particles with higher Rg values result in
increased light scattering. Rgis also related to particle shape, although it
can be calculated with no prior assumption on shape. Particles with the same Mwbut with different shapes differentially scatter the incident
light (e.g., light scattering by a globular particle is more intense than scattering by an equivalent particle with a cylindrical shape). For a more detailed description, please refer to refs. 16 through 19. There is no stan-dard solution for calibrating the system. However, using protein solu-tions of known molecular weight is a good way to calibrate it.
7.2.1. Samples Preparation
Heed the following when preparing samples: • Minimize dust in the sample.
• Filter all solvents using units with a pore diameter of around 0.02 µm to 0.2 µm.
• Allow prepared solutions to stand for a period that ensures ade-quate solvation; the period depends on the sample, it may be more than 24 hours or even up to several days.
• Rigorously clean all glassware and apparatus, and ensure they are free from scratches.
• Prepare samples and storage apparatus in a laminar flow cabinet to minimize dust contamination.
• Very small particles, such as proteins, in aqueous solutions often require filtering (the recommended filter is one with small pores) and centrifuging to eliminate residual particles and microscopic bubbles (e.g., 1500 g for 30 min).
7.3. Dynamic Light Scattering
DLS is based on scattering fluctuation in a small volume on the time scale of the molecular diffusion (typically microseconds), due to Brownian motion of the particles (arising from the random collision of
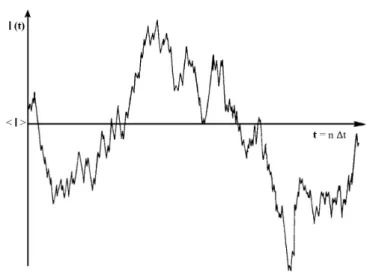
molecules). This motion allows the light scattered by particles to be shifted according to the Doppler effect. However, for large molecules the velocity is very low and, as a consequence, frequency shifts from Doppler effect are negligible. Hence, it is not possible to obtain the dif-fusion coefficient from frequency shift analysis. As the molecules diffuse randomly in the illuminated volume of the sample, they tend to randomly cluster and separate. This causes a variation of the scattered light in the local illuminated volume (Fig. 7.2). Thus, the diffusion coefficient of the particles can be obtained from an intensity autocorre-lation function (Fig. 7.3). The decay rate (Γ) of the intensity autocorrelation function is given by the following relation:2
(7.8) Therefore, the correlation kinetics depend on the intensity-weighted diffusion coefficient (D), which can be calculated using several methods, such as cumulants20,21 or CONTIN.22,23 The cumulant method uses a monoexponential correlogram fit to get information about an average D, while CONTIN uses a multiexponential correlogram fit to assess D dis-tribution in a solution (Fig. 7.4). Using the Stokes–Einstein equation,
Γ =Dq2.
Figure 7.2. Representation of light scattering fluctuations from a small detection volume
Figure 7.3. Schematic representation of the autocorrelation function. This represents the
correlation between scattering intensities with a t interval between them, averaged and rep-resented as a function of t. τ represents the relaxation time at which the correlation func-tion decays to 1/e of its initial value.
Figure 7.4. Size distribution of phosphatidylcholine (POPC) large unilamellar vesicles in
pH 7.4 Tris-HCl buffer, at 37°C, obtained on a Malvern Nano ZS equipment using the CONTIN method.
the value of the hydrodynamic radius (RH) can be determined from D
(for a detailed description see ref. 2):
(7.9)
where η is the dispersant viscosity, κ the Boltzmann constant, and T the absolute temperature. Depending on equipment and quality of sam-ple preparation, the range of detection of RHvaries from 0.6 nm to 6 µm.
To ensure accuracy in measuring particle size, latex beads of different sizes can be used to calibrate the system.
7.3.1. Samples Preparation
Sample contamination by “dust” (a general designation in light-scattering experiments for almost any kind of macrostructure contaminant) can affect measurements and bias results. As the scattered intensity is pro-portional to the sixth power of the size, only a few macrostructures can prevent study of a sample. Samples should be prepared directly in a clean measurement cell made of plastic, glass, or quartz. When the cells are not disposable, or even when using new cells, the washing process must eliminate dust or other scattering particles that could affect measure-ments. Remove traces of detergents, lipids, and dust particles from glass or quartz cell inner surfaces by washing for approximately 30 min in dilute chromosulfuric solution (orange colored; made from a concentrate of 40 g sodium or potassium dichromate dissolved in 100 mL water to which 1 to 2 L concentrated sulfuric acid has been added until solution turns brown) or with commercially available Hellmanex®II solution from Hellma. After washing with chromosulfuric solution, cuvettes should be extensively rinsed with ethylenediaminetetraacetic acid (EDTA; 1% weight per volume [w/v], pH 9.5) to remove chromium ions and then with distilled water previously filtered with a 0.2 µm pore filter device. To remove lipid content, rinse cells several times with dichloromethane, ethanol, and distilled water previously filtered with a 0.2-µm-pore filter device. Since most plastic cells cannot with stand organic solvents, they can be used only once and never cleaned. However, filter devices can and should be used to minimize dust
D T
RH = κ
πη
contamination of plastic cells. The samples can be prepared directly in a syringe and filtered though filter devices of different pore sizes. The best filters to use for peptide filtration are those that ensure low pro-tein binding and a minimal loss of peptidic concentration in the sample (e.g., cellulose acetate, polyethersulfone, and polyvinylidene fluoride fil-ters). Sometimes filtration is not sufficient or appropriate to remove dust particles. When this happens use centrifugation to remove larger parti-cles and retain only the supernatant to measure the molecular properties, or even make measurements with the dust particles pelleted at the bot-tom of the measurement cell. Ultrasonication can also be used to break up some agglomerates in solution. However, depending on the power of the sonication used, this process may contaminate the sample (e.g., with titanium particles) or change its native properties.
7.4.
ζ-Potential
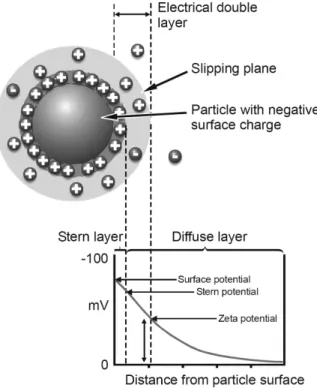
Charged particles, such as proteins and peptides, suspended in a solution attract ions of opposite charge to their surface. These ions are strongly bound, forming a layer covering particle surfaces, commonly called the Stern layer (Fig. 7.5). Another layer outside the Stern layer also forms where ions diffuse more freely. When particles travel through the solution, the strongly attached ions move with it. In the diffuse boundary the ions do not move with the molecule. The potential that exists at this boundary is called the ζ-potential. This potential is calculated by the electrophoretic mobility of the particles in solution, in the presence of an electric field, to the electrode of opposite charge. Viscous forces oppose movement of the particles until equilibrium, when a constant velocity is reached. Electrophoretic mobility can be calculated by laser Doppler velocimetry in Zetasizer devices, in which particle velocity is related to frequency, measured by intensity fluctuation of the scattered light. Sensitivity of the Doppler effect to the low mobility of larger particles is very low, making it difficult to calculate electrophoretic mobility. Some newer devices can use a different method for calculating electrophoretic mobility. This method was developed in the early 1990s by Miller et al.24and is based on phase shift analysis, where differences
in phases between the unshifted reference beam and the sample-scattered beam are analyzed with higher sensitivity. This phase shift is related to the position of the particle. Hence, the mean phase change with time yields the electrophoretic motion.24,25Using Henry’s relation, it is possi-ble to calculate the ζ-potential of the particle (for a more detailed description see refs. 26 and 27):
(7.10)
where z is the ζ-potential, UE—the electrophoretic mobility, and f (ka)—
Henry’s function. The value of this function is 1.5 when particles are sus-pended in aqueous solutions (Smoluchowski approximation) and 1 when they are in nonaqueous media (Hückel approximation). The ζ-potential
UE = zf ka 2 3 ε η ( ) ,
Figure 7.5. Distribution of electrical potential in the double layer region surrounding
measurements should be made in a liquid transparent continuous phase, where the dispersed phase has a different refractive index. This method allows accurate ζ-potential measurements for samples with particle sizes larger than 5 nm and smaller than 10 µm. If a horizontal field is applied, the ζ-potential measurements can be carried on while the sample is sed-imenting. Samples with known ζ-potential should be used to calibrate and validate the system. The only ζ-potential reference sample that fol-lows the requirements of the National Institute of Standards and Technology ( NIST) is Standard Reference Material (SRM) 1980. This sample is a 500 mg/L goethite (α-FeOOH) suspension, saturated with 100 µmol/g phosphate in a 50 mM sodium perchlorate electrolyte solu-tion, at pH 2.5. When prepared according to the procedure supplied by NIST, its electrophoretic mobility is (2.53 ± 0.12) × 10–8m2/V·s, corre-sponding to a ζ-potential of 32 ± 1.5 mV, if the Smoluchowski model is used. However, most studied samples are negatively charged, suggesting the use of a standard with also negative charge. Since no negatively charged samples fulfill the requirements of NIST, it is common to use carboxylate-modified polystyrene sulfate latex microspheres (beads) as ζ-potential standard. A standard with these characteristics, produced by Malvern Instruments (Worcestershire, United Kingdom), is dispersed in a pH 9.22 buffer and has a ζ-potential of −50 ± 5 mV.
7.4.1. Samples Preparation
The preparation of samples for ζ-potential measurements is similar to those described above. However, some samples are too concentrated to be directly measured and they require dilution. The dilution process must not change the properties of the particle surface. One way to ensure this is by filtering and centrifuging some clear liquid from the original sam-ple and using that to dilute the stock solution to the desired concentra-tion. This usually maintains the equilibrium between liquid and surface. Sometimes extraction of supernatant is not possible, making it necessary to wait for sample sedimentation before measuring the ζ-potential of the diluted particles left in the supernatant. Another possibility is to dia-lyze the concentrate sample against a solution with the desired ionic strength. If the particles to be measured are positively charged, avoid storage in glass containers, because dissolution of glass can lead to adsorption of negatively charged species on the particles. For emulsion
systems, dilution is problematic since the phase volume ratio can be changed and, consequently, lead to changes in the surface properties. In successive measurements, the original ζ-potential value may increase. In these circumstances a delay between measurements will allow sample stabilization and subsequent coherent and reliable values.28When sam-ples with more than one solute are used, control measurements of each individual solute should always be made. In some situations, these meas-urements allow establishing a threshold with the software, so as to remove background signal from a free solute that is contributing to ζ-potential values (e.g., discarding the contribution of a peptide that is free in solu-tion when studying peptide–membrane complexes).
7.5. Applications
The methods described above are very useful for studying interaction and behavior of proteins or peptides in solution. Both SLS and DLS can be used for determining crystal growth conditions.29Another possible use concerns the process of association or dissociation of proteins induced by several conditions. In the biomedical field, this process can indicate loss of biological activity. More frequent are the applications of SLS, DLS, and ζ-potential measurements in membrane-active-peptide studies. The peptide–membrane interaction often leads to changes in the physical properties of the membrane (e.g., size, charge, and shape). Membrane-active peptides vary in their hydrophobic and charged amino-acid contents. These peptide properties are believed to determine their interaction-related effects on membranes.
ζ-potential measurements are a useful tool to evaluate membrane– peptide interactions. Many biological systems, like bacterial membranes, are composed of a high proportion of negative lipid, which ensures the selectivity and efficient activity of positively charged antibiotics. In addition to negative lipids, endotoxin or lipopolysaccharide (LPS) is present in the outer leaflet of the outer membrane of Gram- negative bac-teria, further contributing to an overall negative charge. Because of the high relevance of LPS to human diseases, peptides with positive charge and LPS-binding properties are needed and sought. Antimicrobial peptides, such as those based on Limulus antilipopolysaccharide factor,
have LPS-binding properties, reducing their overall charge, as measured by ζ-potential technique.30 This potential reduction ensures the high affinity of those peptides toward LPS moieties. Using the same approach, Willumeit et al. studied the effect of an α-helical peptide antibiotic, named NK-2, on phospholipid membranes representative of bacterial and human cell cytoplasmic membranes.31 Fig. 7.6 shows the effect of the
peptide on each membrane. The addition of NK-2 had no influence on the ζ-potential of 1,2-dipalmitoyl-sn-glycero-3-phosphatidylcholine (DPPC) membranes. Otherwise, for 1,2-dipalmitoyl-sn-glycero-3-phosphoethanolamine (DPPE) and 1,2-dipalmitoyl-sn-glycero-3-[phosphor-rac-(1-glycerol)] (DPPG) membranes, charge neutralization was observed. For DPPE membranes the ζ-potential was neutralized at low [peptide]-to-[lipid] molar ratio, which is representative of an electrostatic interaction. At higher [peptide]-to-[lipid] molar ratios there is a charge overcompen-sation, suggesting a hydrophobic interaction after the saturation of the negative surface charge. For DPPG membranes a stronger overcompen-sation occurs, corresponding to a higher affinity toward NK-2 for DPPG than for DPPE membranes. These results indicate that the peptide is more selective toward bacterial membranes (considering DPPG mem-branes as their model system) than to human cell cytoplasmic membrane (DPPC mimetic systems) and interacts with them, adsorbing on and inserting in the membranes.
Figure 7.6. Variation of the ζ-potential of phospholipid vesicles of DPPC (open circles), DPPE
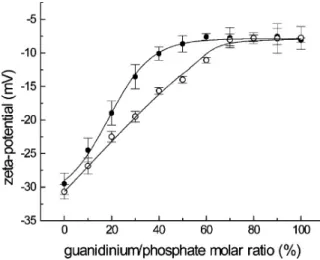
Cell-penetrating peptides (CPPs) have been used as vectors for cyto-plasmic and nuclear delivery of hydrophobic biomolecules and drugs. The design of new peptides as CPPs is a possible strategy for an alter-native therapeutic approach. Their positive charge allows electrostatic interaction with membranes composed of negative lipid and enables ζ-potential measurements to study that effect. Fig. 7.7 shows results of a ζ-potential study of the interaction of poly-L-arginine, a positively charged peptide, with lipid vesicles.13 This peptide is believed to be a good system for facilitating transport of drugs through biological membranes. As shown in Fig. 7.7, ζ-potential measurements (at different temperatures) of the addition of peptides to mixed lipid vesicles consisting of 1-palmitoyl-2-oleoyl-sn-glycerol-3-phosphatidylcholine, cho-lesterol, and dihexadecylphosphate (POPC–Chol–DHP) results in less negative ζ-potential values. This is due to adsorption of the peptide to the membrane. However, at 65°C, where lipids are in the liquid-crystalline phase, the plateau is reached at higher molar ratios of the guanidinium group of the peptide relative to the phosphate group of the lipid mem-brane. This could be due to partial incorporation of the pep tide, which results in a hydrophobic interaction instead of surface adsorption. As this happens the phosphate groups of the lipid are exposed and interact more
Figure 7.7. ζ-potential of POPC–Chol–DHP lipid vesicles as a function of guanidium/
phosphate molar ratios, before (closed symbols) and after (open symbols) incubation at 65°C with polyarginine.13 Reproduced with permission of the American Chemical Society.
freely with other peptide molecules. These studies have found that before phase transition of the lipids the peptide is mainly adsorbed and after phase transition the peptide inserts in the membrane, leading to drug transport across the membrane. In the same way, Yaroslov et al. studied polylysine, a positive polypeptide, and showed that it can interact with lipid vesicles composed of negative lipids (in this case cardiolipin), result-ing in a slightly positive complex.32This interaction with negative lipid enables increase in permeation of vesicles of doxorubicin (or dox, a fluo-rescent antitumor drug) when lipid vesicle charge is close to zero, corre-sponding to peptide being electrostatically adsorbed to the negative lipid.
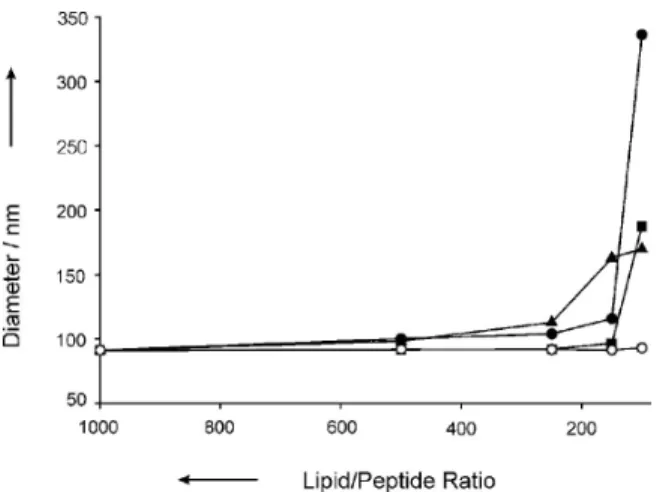
Almost all the cationic peptides induce aggregation of negatively charged lipid vesicles at high enough peptide concentrations. Besides this, many hydrophobic peptides are capable of interacting with neutral-charge lipids and inducing their aggregation. These properties can help the design of new peptides with antibiotic action. Using DLS, Vagt et al. studied the effect of structure on the biological activity of three variants of coiled-coil peptides.14Fig. 7.8 shows the strongest effect on variant 1
peptide, while the basis peptide has no interaction. This higher effect on variant 1, on membrane composed of negative charge, over other variant
Figure 7.8. Hydrodynamic diameter of POPC:POPG (1:1) large unilamellar vesicles at
dif-ferent lipid/peptide ratios: basis peptide (open circles), variant 1 (closed circles), variant 2 (closed squares) and variant 3 (closed triangles).14Reproduced with permission of
peptides and the basis peptide has to do with variant 1’s secondary struc-ture and with its charge as well. Although the variant 1 and the basis pep-tides both retain a stable α-helical coiled coil, variant 1 has an overall positive charge and the basis peptide has a neutral charge. The other vari-ant peptides have an overall positive charge but also higher repulsive forces on their secondary structures, which result in an unstable α-helical coiled-coil conformation. The results show that a positive charge and a stable α-helical folding are characteristics that promote a stronger effect on vesicle aggregation. Cummings et al. observed by DLS the size increase of 1-palmitoyl-2-oleoyl-sn-glycerol-3-phosphatidylglycerol (POPG) vesi-cle aggregates upon addition of cryptdin-4, an antimicrobial peptide found in mice that causes aggregation and hemifusion of negative lipid vesicles.33The lipid vesicles’ aggregation in the presence of cryptdin-4 reaches a limit for very large aggregates, less prone to fusion. Thus, the ability of cryptdin-4 to promote stable fusion of anionic lipid vesicles can create vesicular structures that may be used as drug delivery agents. Herbig et al. used several techniques, including DLS, to evaluate whether a vascular endothelial cadherin-derived CPP (pVEC) and W2-pVEC were able to affect biomembrane integrity.9 W2-pVEC is a peptide derived from pVEC with the substitution of an isoleucine for a tripto-phan. Although integrity of the DPPC large unilamellar vesicles (LUVs) is not impaired at low peptide concentrations, it remained unclear whether at higher peptide concentrations this integrity is compromised. DLS studies at 25°C (Fig. 7.9) show a small increase of membrane vesi-cle diameter with the addition of the peptides. This increase is more pro-nounced for W2-pVEC addition. To find whether this increase was a consequence of peptide insertion in or association on the membrane vesicles or due to membrane vesicle damage, the authors monitored the polydispersity indices of the size distribution. As none of the peptides caused significant increase in the polydispersity index, it was concluded that the increase in vesicle diameter was due to peptide insertion. If the integrity of the membrane vesicles had been affected, a significant change in the polydispersity index values would have been expected, as a consequence of the formation of larger and smaller membrane vesicles or to membrane vesicle aggregation. At 50°C, with DPPC LUVs in the fluid phase (Fig. 7.9), addition of the peptides causes an initial higher membrane vesicle diameter, which decreases over time. Analysis of the polydispersity index values indicated that at the very first moment of pVEC addition significant increase of the polydispersity index also
occurs, which is lost over time. This variation of the polydispersity index was not seen for W2-pVEC. The results show that the interaction of both peptides with the membrane vesicle is followed by insertion, without damage of the membrane vesicle structure.
The fusion process of lipid vesicles in the presence of peptides can also be evaluated by SLS. Intensity measurements for vesicle dispersions at different pH in the presence of wtfp (wild type fusion peptide of hemagglutinin) and mutfp (sequence of the fusion peptide of hemagglu-tinin with a mutation at the N-terminal glycine residue) are shown in
Fig. 7.10.34The average Mwof the scattering particles for wtfp at neutral
pH (1.1 × 10⁷ g · mol−1) is lower than that obtained at acidic pH (3.5 × 10⁷g · mol−1). In the presence of mutfp there was no difference in
the average Mwcalculated at neutral and acidic pH (1.2 × 10⁷g · mol−1).
Trivedi et al. showed by this methodology that wtfp has more effect on vesicular fusion than mutfp and, consequently, the important role of the N-terminal in fusion activity.
Figure 7.9. Diameters and polydispersity indexes of DPPC large unilamellar vesicles
with-out and with peptide, monitored over 30 min. DPPC LUV alone (closed circles) were com-pared with LUV in the presence of the peptides pVEC (open triangles) or W2-pVEC (open squares).8
7.6. Other Practical Aspects
Independently of the application, some practical conditions must be ful-filled in light-scattering experiments. The light source must be monochro-matic and continuous, in order to have a signal of the same frequency. Lasers are the only practical source of radiation that match these condi-tions. Another requirement to do light-scattering experiments is related to stray light. It can be very problematic, since uncontrolled light can mix with the light from the scattering volume and generate false signals.19As mentioned above, the contamination by dust and other large particles can also be a severe problem since scattering intensity depends on the sixth Figure 7.10. Determination of the average molecular weight, by SLS, for vesicular
disper-sion in the presence of fudisper-sion peptides wtfp (A) and mutfp (B), at acidic (closed symbols) and neutral pH (open symbols).34Reproduced with permission from Elsevier.
power of the radius of the particle. Even with a careful sample preparation process, the addition of filtration or centrifugation, or both, can be useful for eliminating contamination.16 Absorbing samples are a limitation to light-scattering measurements since efficiency of the autocorrelation can be considerably reduced.19Loss of signal is the major consequence of this lim-itation, since there is attenuation of the incident and scattered light. Increasing the power of incident light is not recommended, since heating problems may cause alterations in the diffusion coefficient. Fluorescent samples can also interfere with the measurement. A highly fluorescent sam-ple, with absorption at the wavelength of the laser used for the light-scattering measurements, can be impossible to characterize by these methodologies. On ζ-potential measurements, changes in the pH should be avoided because of alterations in protonation of the peptide amino acid residues. Ionic strength should be kept low (not significantly above the physiologic saline concentration), as high conductivity causes Joule heating of the sample and affects the particle mobility as well as its integrity.26,27However, a too low conductivity would also impair the elec-trophoretic mobility. A minimal salt concentration (e.g., NaCl 0.1 mM) is needed for field stability and double layer definition.27
7.7. Conclusion
Peptides constituted by charged residues and an amphipathic structure can have a strong interaction with membranes. This interaction can be studied by spectroscopic techniques without affecting the system. The interaction of peptides with membranes may be accompanied by membrane changes, such as aggregation or physical damage, which can be measured by their size and scattering intensity using DLS or SLS techniques. Charged residues in peptide structure can promote electro-static interaction with membranes and lead to variation of their surface charge. This membrane surface-charge alteration in the presence of pep-tides can be efficiently followed by ζ-potential measurements. Together, these methods can contribute to the determination of mechanisms of action of membrane-active peptides at the molecular level, as well as to the identification of new peptides with higher pharmaceutical activity.
Acknowledgments
This work was partially supported by the Fundação para a Ciência e Tecnologia (FCT) of the Portuguese Ministry of Science, Technology and Higher Education. M.M.D. acknowledges the grant SFRH/BD/ 41750/2007 from FCT.
References
1. Strutt J. On the scattering of light by small particles. Phil Mag 1871, 41:447–454.
2. Berne BJ and Pecora R. Dynamic Light Scattering - with Application to Chemistry,
Biology and Physics. Malabar, Florida: Robert E. Krieger Publishing, 1990, pp. 1–23.
3. Santos NC and Castanho MA. Teaching light scattering spectroscopy:
The dimension and shape of tobacco mosaic virus. Biophys J 1996, 71(3):1641–1650.
4. Zimm BH. Apparatus and methods for measurement and interpretation of the
angular variation of light scattering - Preliminary results on polystyrene solutions. J ChemPhys 1948, 16(12):1099–1116.
5. Zimm BH. The scattering of light and the radial distribution function of high
polymer solutions. J Chem Phys 1948, 16(12):1093–1099.
6. Bohidar HB. Light scattering and viscosity study of heat aggregation of insulin.
Biopolymers 1998, 45(1):1–8.
7. Bridelli MG. Self-assembly of melanin studied by laser light scattering. Biophys
Chem 1998, 73(3):227–239.
8. Matsunami H, Fujita C, Ogawa K, and Kokufuta E. Static light scattering study of
complex formation between protein and neutral water-soluble polymer. Colloids Surf B 2007, 56(1–2):149–154.
9. Herbig ME, Assi F, Textor M, and Merkle HP. The cell penetrating peptides pVEC
and W2-pVEC induce transformation of gel phase domains in phospholipid bilayers without affecting their integrity. Biochemistry 2006, 45(11):3598–3609.
10. Panyukov Y, Yudin I, Drachev V, Dobrov E, and Kurganov B. The study of
amorphous aggregation of tobacco mosaic virus coat protein by dynamic light scattering. Biophys Chem 2007, 127(1–2):9–18.
11. Papish AL, Tari LW, and Vogel HJ. Dynamic light scattering study of
calmodulin-target peptide complexes. Biophys J 2002, 83(3):1455–1464.
12. Reichert J, Grasnick D, Afonin S, Buerck J, Wadhwani P, and Ulrich AS. A critical
evaluation of the conformational requirements of fusogenic peptides in membranes. Eur Biophys J 2007, 36(4–5):405–413.
13. Tsogas I, Tsiourvas D, Nounesis G, and Paleos CM. Interaction of poly-L-arginine with dihexadecyl phosphate/phosphatidylcholine liposomes. Langmuir 2005, 21(13):5997–6001.
14. Vagt T, Zschornig O, Huster D, and Koksch B. Membrane binding and
structure of de novo designed alpha-helical cationic coiled-coil-forming peptides. Chemphyschem 2006, 7(6):1361–1371.
15. Volodkin D, Ball V, Schaaf P, Voegel JC, and Mohwald H. Complexation of
phosphocholine liposomes with polylysine. Stabilization by surface coverage versus aggregation. Biochim Biophys Acta 2007, 1768(2):280–290.
16. Brown W. Light Scattering—Principles and Development. Oxford: Clarendon Press, 1996, pp. 1–27.
17. Chu B. Laser Light Scattering—Basic Principles and Practice. New York: Academic Press, 1991, pp. 13–20.
18. Harding SE, Satelle DB, and Bloomfield VA. Laser Light Scattering in Biochemistry. Cambridge: The Royal Society of Chemistry, 1972, pp. 3–22.
19. Johnson CS and Gabriel DA. Laser Light Scattering. New York: Dover Publication. 1994, pp. 3–7.
20. Frisken BJ. Revisiting the method of cumulants for the analysis of dynamic
light-scattering data. Appl Opt 2001, 40(24):4087–4091.
21. Koppel DE. Analysis of macromolecular polidispersity in intensity correlation
spectroscopy: The method of cumulants. J Chem Phys 1972, 57(12):4814–4820.
22. Provencher SW. A constrained regularization method for inverting data
represented by linear algebraic or integral-equations. Comput Phys Commun
1982, 27(3):213–227.
23. Provencher SW. CONTIN: A general purpose constrained regularization
program for inverting noisy linear algebraic and integral equations. Comput Phys Commun 1982, 27(3):229–242.
24. Miller JF, Schatzel K, and Vincent B. The determination of very small
electrophoretic mobilities in polar and nonpolar colloidal dispersions using phase-analysis light-scattering. J. Colloid Interface Sci 1991, 143(2):532–554.
25. Tscharnuter WW. Mobility measurements by phase analysis. Appl Opt 2001,
26. Kirby BJ and Hasselbrink EF. Zeta potential of microfluidic substrates: 1. Theory,
experimental techniques, and effects on separations. Electrophoresis 2004, 25(2):187–202.
27. Delgado AV, Gonzalez-Caballero F, Hunter RJ, Koopal LK, and Lyklema J.
Measurement and interpretation of electrokinetic phenomena. J Colloid Interface Sci 2007, 309(2):194–224.
28. Kaufman ED, Belyea J, Johnson MC, Nicholson ZM, Ricks JL, Shah PK, Bayless M, Pettersson T, Feldoto Z, Blomberg E, Claesson P, and Franzen S. Probing protein
adsorption onto mercaptoundecanoic acid stabilized gold nanoparticles and surfaces by quartz crystal microbalance and zeta-potential measurements. Langmuir 2007, 23(11):6053–6062.
29. Wilson WW. Light scattering as a diagnostic for protein crystal growth—
A practical approach. J Struct Biol 2003, 142(1):56–65.
30. Andra J, Lamata M, Martinez de Tejada G, Bartels R, Koch MH, Brandenburg K.
Cyclic antimicrobial peptides based on Limulus anti-lipopolysaccharide factor for neutralization of lipopolysaccharide. Biochem Pharmacol 2004, 68(7):
1297–1307.
31. Willumeit R, Kumpugdee M, Funari SS, Lohner K, Navas BP, Brandenburg K, Linser S, and Andra J. Structural rearrangement of model membranes by the
peptide antibiotic NK-2. Biochim Biophys Acta 2005, 1669(2):125–134.
32. Yaroslavov AA, Kuchenkova OY, Okuneva IB, Melik-Nubarov NS, Kozlova NO, Lobyshev VI, Menger FM, and Kabanov VA. Effect of polylysine on transfor
-mations and permeability of negative vesicular membranes. Biochim Biophys Acta 2003, 1611(1–2):44–54.
33. Cummings JE and Vanderlick TK. Aggregation and hemi-fusion of anionic
vesicles induced by the antimicrobial peptide cryptdin-4. Biochim Biophys Acta
2007, 1768(7):1796–1804.
34. Trivedi VD, Yu C, Veeramuthu B, Francis S, and Chang DK. Fusion induced
aggregation of model vesicles studied by dynamic and static light scattering. Chem Phys Lipids 2000, 107(1):99–106.
35. Zetasizer Nano User Manual. Malvern, Worcestershire, United Kingdom: Malvern Instruments Ltd., 2007:252.


![Figure 7.6. Variation of the ζ -potential of phospholipid vesicles of DPPC (open circles), DPPE (open triangles) or DPPG (closed circles) with the [NK-2]/[phospholipid] molar ratio](https://thumb-eu.123doks.com/thumbv2/123dok_br/19282508.988096/15.756.214.539.620.868/figure-variation-potential-phospholipid-vesicles-circles-triangles-phospholipid.webp)