Contents lists available atScienceDirect
Food Research International
journal homepage:www.elsevier.com/locate/foodresPatterns of sweetness preference in red wine according to consumer
characterisation
Maria Madalena Sena-Esteves, Mariana Mota, Manuel Malfeito-Ferreira
⁎Linking Landscape, Environment, Agriculture and Food Research Center (LEAF), Instituto Superior de Agronomia (ISA), University of Lisbon (UL), Tapada da Ajuda, 1349-017 Lisboa, Portugal
A R T I C L E I N F O
Keywords: Consumer categories red wine Sweetness preference 2-AFC method Personality traitsA B S T R A C T
The preference for sweet taste in red wine was examined according to consumer categories of age, gender, drinking experience and personality type (Big-5 personality-test). A total of 114 subjects revealed their pre-ferences for sweetness after tasting dry red wine spiked with equal concentrations of glucose and fructose at 2 g/ L, 4 g/L, 8 g/L, 16 g/L and 32 g/L, following an ascending forced choice paired comparison method (2-AFC).
The overall preference for sweetness was shown within the range of 4.8 to 21.9 g/L, with maximal liking at 8 g/L. Three patterns of response to sweetness were observed (sweet dislikers, sweet likers and indifferent to sweet) according to the different categories of consumers. Differences (p > 0.05) were not found in sweetness preference among the categories up to 16 g/L sugar except for the trait extraversion at 8 g/L, where low ex-traverts showed a higher proportion of responses preferring the sweeter sample. Most significant differences were found only under the highest tasted concentration (32 g/L). Females and novices preferred sweeter samples (p < 0.05) when compared with the response of males and experienced consumers, respectively.
1. Introduction
The sensory properties of a wine are a major element that will de-termine its success among consumers (Francis & Williamson, 2015). These authors provided an overview of the current knowledge of the sensory attributes that have been found to be important to consumer preference and liking. The relationships between consumer hedonic response and wine sensory attributes, as quantified by a trained sensory panel, help enable the understanding of the sensory characteristics that drive acceptance. A commonfinding is the importance for many con-sumers of the appropriate balance among acidity (sourness) (Francis et al., 2010; Lésschaeve, Bowen, & Bruwer, 2012), bitterness and sweetness (Francis et al., 2010), and astringency (Lattey, Bramley, & Francis, 2010). These mouthfeel properties are complemented by aro-matic features, where fruity, floral and oak flavours are particularly appreciated (Lund et al., 2007, Marchal, Pons, Lavigne, & Dubourdieu, 2013). Comparatively, studies concerning preferences for sweet mouthfeel are fewer and present knowledge is mostly based on early research (Amerine & Ough, 1967; Duitschaever, Buteau, & Ashton, 1980; Filipello, Berg, Hinreiner, & Webb, 1955; Kielhöfer, 1955). More recently, Blackman, Saliba, and Schmidtke (2010) reported the pre-ference for sweetness in two Australian Semillon wines with different acidity levels. International wine challenges also tend rate sweeter
samples more highly (Loureiro, Brasil, & Malfeito-Ferreira, 2016). Therefore, either from controlled experiments with wines spiked with different sugar levels or from overall consumer preferences, it seems that a“sweet tooth” observed in other foods (Wansink, Bascoul, & Che, 2006) may also be applied for wine drinkers.
Preference for sweet foods has been studied associated with the perception of sweetness intensity revealing several patterns of sweet liking (Drewnowski, Henderson, Shore, & Barratt-Fornell, 1997; Kim, Prescott, & Kim, 2014; Thompson, Moskovitz, & Campbell, 1976and Whiterly, Pangborn, & Stern, 1980). Intensity ratings of sweetness show that consumers with different sweet liking status have similar intensity ratings either in water (Drewnowski et al., 1997; Kim et al., 2014) or in foods and beverages (Drewnowski et al., 1997; Kim et al., 2014; Methven, Xiao, Cai, & Prescott, 2016). Therefore, sweet perception appears to be independent from the pleasantness of sweetened foods, although a recent report stated otherwise (Jayasinghe et al., 2017). The former authors established sugar preference or acceptance dose-re-sponse curves with several shapes, yielding 3 or 4 types of hedonic responses, which may be reduced to 2, gathering sweet/sucrose likers in opposition to sweet/sucrose dislikers (Drewnowski et al., 1997, Methven et al., 2016, Yeomans, Prescott, & Gould, 2009, Yeomans, Tepper, Riestzschel, & Prescott, 2007). The establishment of individual sweet liking status may be obtained across multiple sugar
https://doi.org/10.1016/j.foodres.2017.12.043
Received 22 June 2017; Received in revised form 25 October 2017; Accepted 15 December 2017
⁎Corresponding author.
E-mail address:[email protected](M. Malfeito-Ferreira).
Available online 17 December 2017 0963-9969/ © 2017 Published by Elsevier Ltd.
concentrations using hedonic Likert scales (Drewnowski et al., 1997), visual analogue scales (Kim et al., 2014; Methven et al., 2016; Yeomans et al., 2007), labeled magnitude scales (Jayasinghe et al., 2017; Yeomans et al., 2007) or paired comparison tests (Blackman et al., 2010).Yeomans et al. (2009)used two concentrations of sucrose and two concentrations of saccharin to classify sweet liking. Hedonic re-sponses to one concentration of sugar (Kim et al., 2014; Saliba, Wragg, & Richardson, 2009) failed to reveal some features of liking patterns when compared to ratings across increasing concentrations (Kim et al., 2014). However, for rapid screening tests a single concentration may be used to separate between sweet likers and sweet dislikers (Asao et al., 2015).
Consumer segmentation is regarded as essential to understand preferences for different types of wine (Francis & Williamson, 2015). In other food and beverage products, it has been shown that the response to sweet taste by consumers is highly segmented (Kim et al., 2014; Moskovitz, Jacobs, & Lazar, 1985). In wines most frequent studied segments or categories include gender, age, level of expertise, con-sumption habits or culture (Blackman et al., 2010; Lattey et al., 2010; Lésschaeve et al., 2012; Osidacz, Francis, Bramley, & Stevens, 2011; Williamson, Robichaud, & Francis, 2012). Personality traits have also been shown as influencing food choice. The research on this theme relies on the ‘Big Five’ theory of personality that involves the in-dependent traits of extraversion, neuroticism, openness, con-scientiousness and agreeableness (Hogan, Johnson, & Briggs, 1997). Extraversion reflects how much the individual is oriented towards things outside him and derives satisfaction from interacting with other people. Neuroticism is the tendency to experience negative emotions. Openness to experience has been portrayed as a proxy measure of the willingness to explore new and unfamiliar experiences, ideas and feel-ings, while conscientiousness refers to persistence, perfectionism and self-discipline. Agreeableness means being sympathetic, kind, a ffec-tionate and reflects how much an individual likes and tries to please others (Costa Jr. & McCrae, 1992). A preference for sweet and salty tastes in people who score high in the neuroticism trait was found by Kikuchi and Watanabe (2000). In wines,Saliba et al. (2009)found that sweet taste preference was associated with a higher level of impul-siveness but lower openness. A study involving aroma characterization and liking of a set of Italian red wines showed a link between “in-novativeness” (related to openness) and consumers who could reliably differentiate samples (Torri et al., 2013).
Wine is a complex matrix with several taste and mouthfeel inter-actions. In white wine sugar reduces sourness while in reds reduce as-tringent and bitter sensations (Sáenz-Navajas, Fernandez-Zurbano, & Ferreira, 2012). Therefore, the addition of sugar may result in lowering the perception of these attributes while sweetness remains unnotice-able. According to our empirical experience, the appeal of smooth red wines has led winemakers to increase residual sugar to relatively high levels, far beyond the level of balancing excessive astringency or bit-terness. Therefore, it seems relevant to provide wine industry with guidelines on the addition of sugar to increase red wine acceptance in parallel to what has been reported for white wines (Blackman et al., 2010). The research described in this work was based on Blackman et al. (2010)using a larger number of consumers segmented in several traits other than individual expertise. The main objective was to es-tablish a relationship between the preference for sweetness in a red wine and the different consumer age, gender, wine drinking experience and personality type, hoping to help winemakers in tuning up the levels of residual sugar in red wines according to each consumer target. 2. Material and methods
2.1. Consumer categories
One hundred and fourteen participants were recruited from ISA (Instituto Superior de Agronomia, Lisbon, Portugal) and other external
faculties such as medicine, law and engineering. The average age of the participants was 27, ranging from 19 to 56 years old. Consumers were initially asked to answer some questions in order to group them into several classes in the following categories: gender, age, wine drinking experience and personality type (Table 1).
The wine drinking experience included novice and experienced consumers, based on a combination of self-reported consumption, years of experience in drinking wine, wine knowledge, and involvement in the wine industry, consistent with previous research (Blackman et al., 2010; Melcher & Schooler, 1996). Specifically, the definitions provided byBlackman et al. (2010)were followed: i) a novice was an individual who had been a wine consumer for < 10 years, that drank less than three times a week and who did not self-report as being “knowledge-able”; ii) an experienced consumer was an individual who had been a wine consumer for > 10 years, drinking at least several times a week and who self-reported as being“interested” or “knowledgeable”; iii) the respondents who reported being wine consumers for < 10 years and “knowledgeable” were also classified as experienced consumers.
To evaluate personality, subjects took the Big 5 personality-test (Hogan et al., 1997), which consists in 50 questions to be answered online (www.personality-testing.info/tests/IPIP-BFFM/) on the 5 per-sonality traits: openness to experience, conscientiousness, extraversion, neuroticism and agreeableness. These traits were rated from 1 to 5, and arbitrarily grouped in two classes, high scorers (class A) for the scores from 3 to 5 and low scorers (class B) from 1 to 2, to obtain higher number of respondents in each class.
2.2. Wines
The wine was a 2014 blend of Syrah (80%), Touriga Nacional, Cabernet Sauvignon and Trincadeira varieties (20%) produced in the experimental winery of ISA following classical vinification with skin maceration until sugar dryness. The concentrations of residual sugar in wine were 2, 4, 8, 16 and 32 g/L, obtained by the addition of equal amounts of glucose and fructose (Sigma-Aldrich, St. Louis, USA). Wines were analyzed on pH, total acidity, volatile acidity, free and total sulfur dioxide, reducing substances and alcohol strength using standard OIV (International Office of Vine and Wine) methods (OIV, 2010). The characterization of colour and phenolic compounds was performed by evaluating (i) colour intensity, tonality, total pigments, polymeric pig-ments, pigment polymerization index, total and stained anthocyanins (Somers & Evans, 1977); (ii) tannic power (NTU/mL) (Freitas & Mateus, 2001) and (iii) total phenols (mg/L of gallic acid) (Ribéreau-Gayon, 1970).
Table 1
Number of subjects in each class of the categories under study.
Categories Classes Number of subjects
Age [18–24] 68 [25–29] 27 [30–60] 19 Gender Females 51 Males 63 Experience Novices 85 Experienced 29 Agreeableness A high 113 B low 1 Neuroticism A high 45 B low 69 Extraversion A high 88 B low 26 Openness A high 100 B low 14 Conscientiousness A high 94 B low 20
2.3. Testing procedure
The tasting session took place in a well ventilated classroom from 11 am to 5 pm, in 4 different sessions held in December 2015. In each bench, other than the glasses of wine, there was a glass of water, a spittoon, the demographic questionnaire and a laptop for the re-spondents to take the“Big 5 Personality” test. First, they were required to complete the forms by replying to the questions with thefirst an-swers that came into their mind. Once the questionnaires had been completed, wine tasting was initiated.
To assess tasters response to sweetness, a two ascending forced choice (2-AFC) protocol was conducted following the procedures de-scribed by the ISO guidelines for two-tailed paired comparisons (ISO, 1983), accepting a 5% risk of error, as applied by Prescott, Norris, Kunst, and Kim (2005)andBlackman et al. (2010).Participants were asked to compare the base wine (control) with the spiked wines at each sugar level and indicate their preference on a scoresheet. Base wine position (left or right) was randomized. No information was given on the wine such as its variety, origin, or nature of the test. Each paired sample had a control wine and a spiked wine which was presented in increasing sugar concentration. Respondents were instructed to taste the wine, expectorate, rinse their mouth with water and wait 1 min before going on to the next sample. The wine (30 mL) was poured at 18 °C in transparent ISO standard glasses (Ideal 6019, Schott Zwiesel, Germany), labeled with randomized 3-digit numbers. Participants were also asked to write what type of mouth-feel difference they felt in the preferred sample. Time was given as much as they needed to complete the test and released after tasting all the samples.
2.4. Data analysis
The assessment of differences between each class within a consumer category was performed counting as 1 when the spiked sample was preferred and as 0 when the control wine was preferred. Pearson's Chi-square test was used to assess if there was any influence of the different categories on the sugar preference. Tests were performed with software R (www.r-project.org) for each sugar concentration. When a category significant influence (p < 0.05) was identified, post-hoc tests were conducted to evaluate the influence of each class within the category. 3. Results
3.1. Consumer characterization
The characterization of each consumer category is shown inTable 1. The minimum number of 40 respondents for each category class as recommended for consumer preference tests byMacFie (2007)was not always achieved, even after pooling some of the classes. However, the ISO-5495 standard tables present a minimum of 7 replies to establish significance with a 5% risk of error (α < 0.05) applicable when tasters may be considered as experienced. Therefore, results were also statis-tically compared for the experienced segment with 29 participants. 3.2. Wine chemical analyses
The young red wine used in tastings was selected due to its noticeable astringency hoping that the added sugar could effectively increase pre-ference. Although it was not expected that sugar could modify the poly-phenolic composition, the measurements of colour and astringency in-dexes were performed to check if any change could occur. The results (Supplementary data 1) showed that there were no significant differences between the control and all the spiked samples (p > 0.05). In this way taster responses could be ascribed to the sole effect of sugar addition and not to other effect on other mouthfeel characteristics. Higher sugar con-centrations (64 g/L) did increase wine volume inducing a dilution effect in phenolic indexes and were not used.
3.3. Patterns of hedonic responses to sweetness according to consumer categories
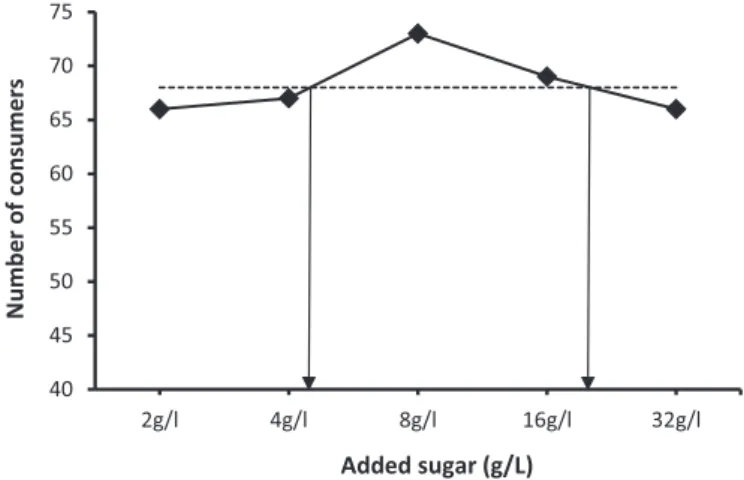
The overall response for increasing levels of sweetness is re-presented inFig. 1which shows the number of subjects who preferred the glucose and fructose spiked sample at each concentration. Using the 0.05 significance level (ISO, 1983) and interpolation between two neighboring concentrations, the spiked wine samples preferred to the control wine were those between 4.8 g/L and 21.9 g/L, with a max-imum of individuals preferring 8 g/L. The response curve describing the number of respondents preferring the spiked sample can be described as having an inverted-U shape. This overall behavior may be understood as the sum of the different responses given by each consumer segment. The response curve for each particular segment is described below.
The segment age was divided in 3 classes. Class A (18 to 24 years) preferred concentrations between 7.2 and 13.2 g/L, and above 25.6 g/L up to 32 g/L (Fig. 2). Classes B (25 to 29 years) and C (30 to 60 years) did not reach the threshold level to show preference for added sugar. However, class B showed decreasing proportion of tasters preferring higher sugar levels while Class C showed constant responses along the tested concentrations.
In the case of females, there was an increasing proportion of tasters 40 45 50 55 60 65 70 75 2g/l 4g/l 8g/l 16g/l 32g/l
sr
e
m
us
n
oc
f
o
r
e
b
m
u
N
Added sugar (g/L)
Fig. 1. Number of consumers (♦) who preferred the sugar spiked sample for each con-centration. Dotted line (n = 68) represents minimum agreeing judgements necessary to establish preference usingα = 0,05 for paired comparison tests when total the number of tasters was 114. Vertical arrows indicate threshold values obtained by interpolation.
0 5 10 15 20 25 30 35 40 45 50 2g/l 4g/l 8g/l 16g/l 32g/l sr e m us n oc f o r e b m u N Added sugar (g/L)
Fig. 2. Number of consumers with 18 to 24 years (♦), 25 to 29 years (■) and 30 to 60 years (▲) who preferred the sugar spiked sample for each concentration. Dotted lines (n = 43, 20 and 15) represent minimum agreeing judgements necessary to establish preference usingα = 0,05 for paired comparison tests when total the number of tasters were 68, 27 and 19, respectively. Vertical arrows indicate threshold values obtained by interpolation.
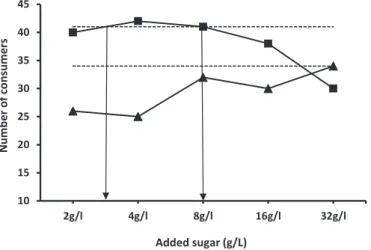
preferring the spiked samples up to 32 g/L, concentration under which preference could be established for the sweeter wine (Fig. 3). In the case of males, the preference for sugar was observed between 3 and 8 g/L, with an inverted U-shape response curve.
The responses of the two classes of wine drinking experience are depicted in Fig. 4. The experienced consumers did not show a pre-ference for sugar while the novice group showed prepre-ference over 7 g/L up to the maximum level of 32 g/L.
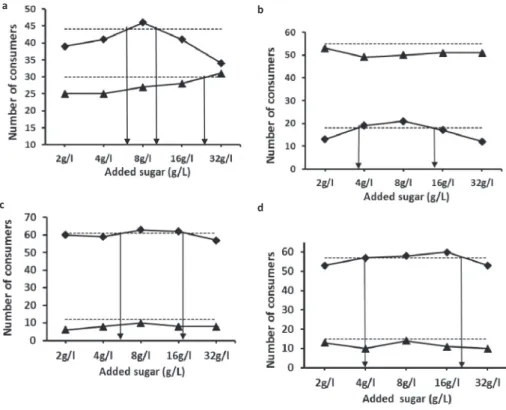
The personality tests consider 4 possible scores for each trait: high A (4–5), medium M (3–4), low B (2–3) and very low MB (1–2). However, the few number of respondents in many of the categories led to their merging in two classes: high (A), for from 3 to 5, and low (B), for low from 1 to 2. Even after these rearrangements, only one subject resulted low in agreeableness. Therefore, the high score in agreeableness tasters showed an inverted-U response similar to that of all subjects presented in Fig. 1(results not shown). The trait neuroticism showed different behaviors for higher and lower scorers (Fig. 5a). Class A revealed an increasing proportion of tasters preferring the sweeter sample, showing preference over 26.7 g/L sugar. Lower scorers, class B, revealed a re-sponse curve with an inverted U shape, showing a significant preference
between 5.5 and 12.5 g/L. Regarding extraversion, the low scorers, class B, preferred concentrations between 3.6 g/L and 14.1 g/L (Fig. 5b). The higher scorers, class A, did not show preference as a function of sugar level. Concerning openness, the high scorers preferred the spiked sample with concentrations between 6 and 20.4 g/L (Fig. 5c). Low scorers did not show preference for sugar at any of the tested concentrations. About conscientiousness, the high scorers pre-ferred the spiked samples with concentrations between 4 and 24 g/L (Fig. 5d). For the low scorers, preference for sweetness was not evi-denced, being indifferent to the increase in sugar concentrations.
The several hedonic patterns of sugar liking reported byThompson et al. (1976),Whiterly et al. (1980),Drewnowski et al. (1997)andKim et al. (2014)were obtained with hedonic ratings across several sugar concentrations in the approximate range of 20 g/L to 360 g/L. In the present study, sugar levels were about 10-fold lower which, in pre-liminary tests, did not induce different liking scores using a visual analogue scale (results not shown). Therefore, preference was estab-lished through a 2-AFC protocol, as described by Blackman et al. (2010). Preference could only be demonstrated when number of re-sponses choosing the sweetened sample were over a minimum value. Therefore, the curves presented in thefigures reflect the overall re-sponse of the tasters and only show preference over the dotted line. These response curves have different shapes that can be grouped into 3 types (Table 2): (i) type I, defined as sweet dislike category, showing a decreasing or inverted-U shape proportion of tasters preferring the sweeter sample; (ii) type II, the sweet like category, defined as in-creasing proportion of individuals preferring sweeter samples and (iii) type III, indifferent to sweetness, defined as the responses without variation over the sugar concentrations. Table 2 shows that Type I (sweet dislikers) was the category that combined more segments: ages ranging from 25 to 29 years, males, experienced consumers, subjects who scored high on agreeableness, openness and conscientiousness and low on neuroticism and extraversion. Type II (sweet likers) was the category that included ages ranging from 18 to 24 years, females, no-vices and subjects who scored high on neuroticism. Type III (sweet insensitives), was the category that included subjects with 30 to 60 years old, scored high on extraversion, low on conscientiousness and low on openness. In addition, the utilization of a 2-AFC sensory tech-nique provided an additional feature to the hedonic pattern related with the establishment of preference for sweetness. Type I and Type II included segments where preference for sugar was not demonstrated while all segments in Type III did not show preference for sweetness (Table 2).
3.4. Comparison of sweetness preference among taster categories To compare the responses of each category, the output of each sugar concentration was considered as 1, when the spiked sample was pre-ferred, or 0, when it was the case for the control sample. For each sugar concentration and each category, positive and negative responses were counted, and the proportion of positive answers calculated. The use of the Chi-square test for each sugar concentration showed that, most of the categories did not show significant different influence on sweetness preference (results not shown). For the trait extraversion, differences were found only at 8 g/L (p = 0.02), with low extraverts showing a higher preference (0.85 ± 0.07, mean ± standard error) than high extraverts (0.58 ± 0.05, mean ± standard error). Significant differ-ences were mainly found at the highest concentration tested (32 g/L) for gender (p = 0.02) and experience (p = 0.01) categories. Females and novices showed higher proportion preferring the sweeter samples (Table 3).
The taster responses also suggested the existence of interactions within gender and category of wine drinking experience (at 8 g/L sugar), and within neuroticism and openness (at 16 g/L sugar). However, the comparison between the responses between classes within each category was not statistically valid taking in account the 10 15 20 25 30 35 40 45 2g/l 4g/l 8g/l 16g/l 32g/l sr e m us n oc f o r e b m u N Added sugar (g/L)
Fig. 3. Number of female (▲) and male (■) consumers who preferred the sugar spiked sample for each concentration. Dotted lines (n = 34 and 41) represent minimum agreeing judgements necessary to establish preference usingα = 0,05 for paired comparison tests when total the number of tasters were 51 and 63, respectively. Vertical arrows indicate threshold values obtained by interpolation.
0 10 20 30 40 50 60 2g/l 4g/l 8g/l 16g/l 32g/l Number of consumers Added sugar (g/L)
Fig. 4. Number of novices (■) and experienced (▲) consumers who preferred the sugar spiked sample for each concentration. Dotted lines (n = 53 and 21) represent minimum agreeing judgements necessary to establish preference usingα = 0,05 for paired com-parison tests when total the number of tasters were 85 and 29, respectively. Vertical arrows indicate threshold values obtained by interpolation.
required minimum number of 40 respondents advised byMacFie (2007) for each consumer class (results not shown).
4. Discussion
The results from this work showed that dry red wine preference is
clearly influenced by the residual sugar concentration. When responses from all individuals were pooled together, red wines with sugar be-tween 4.8 and 21.9 g/L were preferred over the control wine. The strongest preference was observed for the wine that had been spiked with 8 g/L sugar, following an inverted U-shape pattern. This behavior, defined as sweet disliking, is common in foods where patterns of in-dividual hedonic response to increasing levels of sweetness have been reported (Drewnowski et al., 1997; Kim et al., 2014; Methven et al., 2016; Moskovitz et al., 1985; Prescott, 1998; Prescott et al., 1992; Thompson et al., 1976; Whiterly et al., 1980; Yeomans et al., 2007). In the present work, probably due to the low sugar concentrations tested, hedonic scales did not show differences in liking. Therefore, the method of choice was a 2-AFC technique that enabled to observe a pattern across multiple sugar concentrations, as advised byKim et al. (2014) and also validated byBlackman et al. (2010), in white wines,Harwood, Ziegler, and Hayes (2012), in chocolate milk, and Methven et al. (2016), in orange juices or jellies. The utilization of higher sugar con-centrations would have made no sense because wines could no longer be regarded as dry. In fact, the higher sugar (64 g/L) level would fall in the sweet wine category (OIV, 2015), besides that the required spiked solution would dilute wine polyphenols with effects in wine preference that could not be only ascribed to sugar addition (seeTable 2in sup-plementary material). This inverted-U shape behavior is reported for thefirst time regarding sugar level in red wines. In white wines, de-creasing preference with (for novices and experienced consumers) or without an initial plateau (for winemakers) was described byBlackman et al. (2010). These authors reported maximum preference thresholds ranging from 2 g/L glucose for winemakers to 16 g/L for novices, both consistent with a sweet disliking pattern but without an inverted-U shape. Following the same 2-AFC technique, qualitatively similar re-sults were found in certain consumer segments but the decrease in preference with higher sugar concentration was more pronounced in white wines tasted by winemakers and experienced individuals. Moreover, the sweet liking and insensitive to sweetness patterns were not reported byBlackman et al. (2010). These differences might be due to the astringency/bitterness of red wines. Knowing that sweetness masks bitterness and the puckering effect of astringency (Sáenz-Navajas et al., 2012), the presented results reflect the same behavior reported by
a b
d c
Fig. 5. Number of consumers with high (▲) and low (♦) psychological traits who preferred the sugar spiked sample for each concentration: (a) Neuroticism, dotted lines (n = 30 and 44) represent minimum agreeing judgements necessary to establish preference usingα = 0,05 for paired comparison tests when total the number of tasters were 45 and 69, respectively; (b) Extraversion, dotted lines (n = 18 and 55) represent minimum agreeing judgements necessary to establish preference usingα = 0,05 for paired compar-ison tests when total the number of tasters were 26 and 88, respectively; (c) Openness, dotted lines (n = 61 and 12) represent minimum agreeing judgements necessary to es-tablish preference usingα = 0,05 for paired comparison tests when total the number of tasters were 100 and 14, respectively; (d) Conscientiousness, dotted lines (n = 58 and 15) represent minimum agreeing judgements necessary to establish preference usingα = 0,05 for paired compar-ison tests when total the number of tasters were 94 and 20, respectively. Vertical arrows indicate threshold values ob-tained by interpolation.
Table 2
Consumer segments grouped according to the types of hedonic responses to sweetness. Type I - Inverted-U shape, type II - positive hedonic rating and type III - insensitive re-sponses.
Type Denomination Consumer segments Preferred sugar concentrations (g/L)
I Sweet dislikers Age (25–29) No preference
Males 3–8 Experienced No preference High openness 6–20.4 High agreeableness 4.8–21.9 Low neuroticism 6.4–11.1 High conscientiousness 4–24 Low extraversion 3.6–14.1
II Sweet likers Age (18–24) 2–8, 24–32
Females 32 Novices 7–32 High neuroticism 26.7 III Insensitive to sweet Age (30–60) No preference
Low openness No preference Low conscientiousness No preference High extraversion No preference
Table 3
Proportion of the tasters preferring the wine spiked with 32 g/L sugar according to the different consumer categories that showed significant differences using a Chi-square test. Proportions of female and novices were significantly higher that proportions of male and experienced tasters (α = 0.05).
Gender Mean Experience Mean
Female 0.71 Novices 0.65
Lattey et al. (2010) where the observed inverted-U shape curve for liking of different red wines was attributed to varying levels of as-tringency. Accordingly, similar inverted-U shape curves with optimum sucrose levels at 18 g/L were observed in tea, a non-alcoholic bitter beverage (Chung & Vickers, 2007).
The preference for wine with added sugar can also be inferred from other reports where the objective was to assess liking of different wines. Lattey et al. (2010), in a range of Shiraz and Cabernet Sauvignon wines, showed that the sweetest wine (7.1 g/L) was the most preferred by Australian consumers and received intermediate scores by winemakers. Williamson et al. (2012), studying Chinese and Australian consumers' liking responses for red wine, showed that they share broadly similar preferences, preferring the wine with 16.1 g/L sugar. In Austria, with white wines, the most appreciated wine had 10.8 g/L sugar although tasters did not recognize it as being sweet (Bazala, Knoll, & Derndorfer, 2015). Similarly, in red wines the effect of sugar may not be recognized by consumers as a sweetener but as a smoothener. The appeal of these smoothened wines may also be inferred from the results of wine chal-lenges, where the best awarded wines (Great Gold medal) have fre-quently over 10 g/L of residual sugar (Loureiro et al., 2016). These authors also showed that average residual sugar concentrations in-creased in the wines awarded great gold medals from 2004 to 2014. Therefore, preferred levels in the range determined by us under con-trolled conditions reflect an overall appreciation of red wines with re-latively high sugar concentrations for wines considered to be dry. In fact, the definition given by OIV standards is that dry wines contain a maximum of 4 g/L glucose plus fructose, medium dry between 4 and 12 g/L, semi-sweet between 12 and 45 g/L and sweet when the sugar level is over 45 g/L (OIV, 2015). Higher concentrations may apply to dry (9 g/L) or medium dry (18 g/L) types when the level of total acidity expressed in g/L tartaric acid is not < 2 g/L sugar or when the differ-ence between the sugar and acid levels does not exceed 10 g/L, re-spectively. As a result, wine challenges should introduce additional categories to accommodate the supposed“dry” wines according to their true sugar content. This apparent increasing preference for sweeter wines may be due to the increase in sugar levels in the childhood diets of younger tasters, as discussed by Menella, Bobowski, and Reed (2016). Given the frequency of sweetened wines and the present dietary concerns it would be adequate to provide information about the sugar level in the wine label.
Meaningful interpretations of differences in consumer categories should have > 30 (ISO, 1983) or 40 individuals (MacFie, 2007). Hence, our conclusions are drawn with caution for the experience category (29 experienced tasters) and the extraversion trait (26 low extraverts). The preference for sweetness appeared to be independent from consumer categories under the most common residual sugars in red wines (≤16 g/L), except for the trait extraversion which is expected to be linked to sweet taste preference (Saliba et al., 2009). Under the highest concentration tested (32 g/L), wines became noticeably sweet or smooth. Females and novices showed higher preference for this sugar level when compared with males or experienced tasters, respectively. Similar results were reported byBlackman et al. (2010)regarding the experienced segment but gender was not evaluated by these authors.
Francis and Williamson (2015) considered that the inclusion of measurements of personality traits is of interest for winemakers. It is likely that people who have an interest in wine and are willing to spend quite large sums of money in buying them, will have certain psycho-logical personality traits, such as interest in new experiences, high sociability, an intellectual interest in wineflavor differences or a desire to signal their taste to others (Francis & Williamson, 2015). While there has been limited work investigating this area, it has been shown that there is a generally positive link between alcohol use and extraversion, impulsivity, or neuroticism and a negative link with conscientiousness (Zhang, Bray, Zhang, & Lanza, 2015). A study involving aroma char-acterization and liking of a set of Italian red wines showed a link be-tween“innovativeness” (related to openness) and consumers who could
reliably differentiate samples (Torri et al., 2013). Concerning sweet taste,Saliba et al. (2009)found that participants with preference for 20 g/L sugar in white wine reported significantly lower level of open-ness. In the present study individuals with low openness were in-sensitive to sweetness which may be explained by the different re-sponses induced by red wines. Contrarily, high openness individuals were sweet dislikers. In another study, high scorers for openness re-ported healthier dietary practices since individuals with a preference for non-sweet tastes, or dry tastes, seem to be less likely to consume high-sugar products (Goldberg & Strycker, 2002). Research byKikuchi and Watanabe (2000)found that individuals (mostly females) scoring high in neuroticism preferred sweet tastes, and the results presented here showed that sweet likers indeed formed this segment. In addition, these results suggested some relation among openness and neuroticism. High openness and high neuroticism or low openness and low neuro-ticism were both associated with higher preference for sweetness, under 16 g/L sugar. Further investigation is necessary to understand these different behaviors based on personality traits.
5. Limitations of the study and future research
The composition of the tasting group recruited among faculty staff, students and graduated persons may have selected individuals with higher level of education that are not representative of the overall wine consumers in Portugal. In addition, in spite of the overall high number of respondents, many categories did not reach the minimum value of 40, mainly when interactions among class categories were determined. These drawbacks should be avoided in future research by obtaining balanced number of individuals for each category. The utilization of self-reported questionnaires also tends to favour socially desirable re-sponses but are commonly used as indicators of personality traits (Saliba et al., 2009).
For the industry and concerningfine wines, manipulation through sugar addition, although being cost-effective, is not a sophisticated way to increase smoothness and pleasantness. Hence, other strategies re-lated with mouthfeelfine-tuning (Marchal et al., 2013; Sáenz-Navajas et al., 2012) should be tested in the future. Moreover, research is re-quired to extend this investigation to other red wine styles, as responses are likely to be different. Ultimately, pairing with food should also be evaluated to highlight the quality of aggressive wines instead of seeking how to smooth them.
6. Conclusions
The results presented in this study can help winemakers to under-stand the importance of sugar addition in order to take into account consumers' personal preferences and hence increase wines' likeability. Residual sugar can be modulated to shape the sensory properties of wines in order to create“softer” and more desirable products. In par-ticular, knowing that cool climate wines seem to be the next consumer trend, their acidity and astringency may befine-tuned by sugar addi-tion. Wine education and exposure to these wine styles, especially for new-to-wine markets, is crucial to achieve this purpose.
Acknowledgments
This work was supported by national funds from Fundação para a Ciência e a Tecnologia (FCT) through the research unit UID/AGR/ 04129/2013 (LEAF).
Appendix A. Supplementary data
Supplementary data to this article can be found online athttps:// doi.org/10.1016/j.foodres.2017.12.043.
References
Amerine, M. A., & Ough, C. S. (1967). Sweetness preference in rosé wines. American Journal of Enology and Viticulture, 18, 121–125.
Asao, K., Miller, J., Arcori, L., Lumeng, J., Han-Markey, T., & Herman, W. (2015). Patterns of sweet taste liking: A pilot study. Nutrients, 7(9), 7298–7311.
Bazala, B., Knoll, M., & Derndorfer, E. (2015). Perception and acceptance of white wines by consumers belonging to different age groups. Journal International des Sciences de la Vigne et du Vin, 49, 217–230.
Blackman, J., Saliba, A., & Schmidtke, L. (2010). Sweetness acceptance of novices, ex-perienced consumers and winemakers in Hunter Valley Semillon wines. Food Quality and Preference, 21, 679–683.
Chung, S.-J., & Vickers, Z. (2007). Influence of sweetness on the sensory-specific satiety and long-term acceptability of tea. Food Quality and Preference, 18, 256–264. Costa, P. T., Jr., & McCrae, R. R. (1992). Revised NEO personality inventory (NEO-PI-R) and
NEOfive-factor inventory (NEO-FFI) professional manual. Odessa, FL: Psychological Assessment Resources.
Drewnowski, A., Henderson, A., Shore, A., & Barratt-Fornell, A. (1997). Nontasters, ta-sters, and supertasters of 6-n-propylthiouracil (PROP) and hedonic response to sweet. Physiology and Behaviour, 62, 649–655.
Duitschaever, C. L., Buteau, C., & Ashton, G. C. (1980). Edulcoration of white wine with four different sweeteners. American Journal of Enology and Viticulture, 31, 337–343. Filipello, F., Berg, H. W., Hinreiner, E., & Webb, A. D. (1955). Reproducibility of results in
consumer wine preference surveys. Food Technology, 9, 431–432.
Francis, I. L., Osidacz, P. C., Bramley, B., King, E. S., O'Brien, V., Curtin, C., ... Pretorius, I. S. (2010). Linking wineflavor components, sensory properties and consumer quality perceptions. Australian & New Zealand Wine Industry Journal, 25, 18–23.
Francis, I. L., & Williamson, P. O. (2015). Application of consumer sensory science in wine research. Australian Journal of Grape and Wine Research, 21, 554–567.
Freitas, V., & Mateus, N. (2001). Structural features of procyanidin interactions with salivary proteins. Journal of Agriculture and Food Chemistry, 49, 940–945. Goldberg, L. R., & Strycker, L. A. (2002). Personality traits and eating habits: The
as-sessment of food preferences in a large community sample. Personality and Individual Differences, 32, 49–65.
Harwood, M., Ziegler, G., & Hayes, J. (2012). Rejection thresholds in chocolate milk: Evidence for segmentation. Food Quality and Preference, 26, 128–133.
Hogan, R., Johnson, J., & Briggs, S. (Eds.). (1997). Handbook of personality psychology. California: Academic Press.
ISO (1983). Standard 5495: Sensory analysis— methodology - paired comparison test. Jayasinghe, S., Kruger, R., Walsh, D., Cao, G., Rivers, S., Richter, M., & Breier, B. (2017).
Is sweet taste perception associated with sweet food liking and intake? Nutrients, 9(7), 750.
Kielhöfer, E. (1955). Die Restsüsse des Weines. Weinberg und Keller, 2, 358–365. Kikuchi, Y., & Watanabe, S. (2000). Personality and dietary habits. Journal of
Epidemiology, 10, 191–198.
Kim, J. Y., Prescott, J., & Kim, K. O. (2014). Patterns of sweet liking in sucrose solutions and beverages. Food Quality and Preference, 36, 96–103.
Lattey, K. A., Bramley, B. R., & Francis, I. L. (2010). Consumer acceptability, sensory properties and expert quality judgements of Australian cabernet sauvignon and shiraz wines. Australian Journal of Grape and Wine Research, 16, 189–202.
Lésschaeve, I., Bowen, A., & Bruwer, J. (2012). Determining the impact of consumer characteristics to project sensory preferences in commercial white wines. American Journal of Enology and Viticulture, 63, 487–493.
Loureiro, V., Brasil, R., & Malfeito-Ferreira, M. (2016). A new wine tasting approach based on emotional responses to rapidly recognize classic European wine styles. Beverages, 2(1), 6.
Lund, C. M., Thompson, M. K., Benkwitz, F., Wohler, M. W., Triggs, C. M., Gardner, R., ... MacFie, H. (2007). Preference mapping and food product development. In H. Macfie (Ed.). Consumer-led food product development (pp. 551–592). Cambridge, England: Woodhead Publishing.
Marchal, A., Pons, A., Lavigne, V., & Dubourdieu, D. (2013). Contribution of oak wood
ageing to the sweet perception of dry wines. Australian Journal of Grape and Wine Research, 19, 11–19.
Macfie, H. (Ed.). (2007). Consumer-led food product development. Cambridge, England: Woodhead Publishing.
Melcher, J. M., & Schooler, J. W. (1996). The misremembrance of wines past: Verbal and perceptual expertise differentially mediate verbal overshadowing of taste memory. Journal of Memory and Language, 35, 231–245.
Menella, J., Bobowski, N., & Reed, D. (2016). The development of sweet taste: From biology to hedonics. Reviews in Endocrinology and Metabolism Disorder, 17, 171–178. Methven, L., Xiao, C., Cai, M., & Prescott, J. (2016). Rejection thresholds (RjT) of sweet
likers and dislikers. Food Quality and Preference, 52, 74–80.
Moskovitz, H. R., Jacobs, B. E., & Lazar, N. (1985). Product response segmentation and the analysis of individual differences in liking. Journal of Food Quality, 8, 191–198. OIV (2010). Recueil des méthodes internationales d'analyse des vins et des moûts. International
Organisation of Vine and Wine, Paris, France.
OIV (2015). International standard for the labelling of wines. Paris, France: International Organisation of Vine and Wine.
Osidacz, P., Francis, I. L., Bramley, B., & Stevens, M. (2011). The effect of repeated wine exposure on consumer preferences. In R. J. Blair, T. H. Lee, & I. S. Pretorius (Eds.). Proceedings of the fourtheenth Australian wine industry technical conference; 3–8 July 2010; Adelaide, SA, Australia (Australian Wine Industry Technical Conference: Urrbrae, SA, Australia) (pp. 223–225)..
Prescott, J. (1998). Comparisons of taste perceptions and preferences of Japanese and Australian consumers: Overview and implications for cross-cultural sensory research. Food Quality and Preference, 9, 393–402.
Prescott, J., Laing, D., Bell, G., Yoshida, M., Gillmore, R., & Allen, S. (1992). Hedonic responses to taste solutions: A cross-cultural study of Japanese and Australian panels. Chemical Senses, 17, 801–809.
Prescott, J., Norris, L., Kunst, M., & Kim, S. (2005). Estimating a“consumer rejection threshold” for a cork taint in white wine. Food Quality and Preference, 16, 345–349. Ribéreau-Gayon, P. (1970). La dosage des composés phenoliques totaux das les vins
rouges. Chemie Analytique, 52, 627–631.
Sáenz-Navajas, M. P., Fernandez-Zurbano, P., & Ferreira, V. (2012). Contribution of nonvolatile composition to wineflavor. Food Reviews International, 28, 389–411. Saliba, A., Wragg, K., & Richardson, P. (2009). Sweet taste preference and personality
traits using a white wine. Food Quality and Preference, 20, 572–575. Somers, T. C., & Evans, M. E. (1977). Spectral evaluation of young red wines:
Anthocyanin equilibria, total phenolic, free and molecular SO2,“chemical age”. Journal of the Science of Food and Agriculture, 28, 279–287.
Thompson, D. A., Moskovitz, H. R., & Campbell, R. (1976). Effects of body weight and food intake on pleasantness ratings for a sweet stimulus. Journal of Applied Psychology, 41, 77–83.
Torri, L., Dinnella, C., Recchia, A., Naes, T., Tuorila, H., & Monteleone, E. (2013). Projective mapping for interpreting wine aroma differences as perceived by naïve and experienced assessors. Food Quality and Preference, 29, 6–15.
Wansink, B., Bascoul, G., & Che, G. (2006). The sweet tooth hypothesis: How fruit con-sumption relates to snack concon-sumption. Appetite, 47, 107–110.
Whiterly, S., Pangborn, R., & Stern, J. (1980). Gustatory responses and eating duration of obese and lean adults. Appetite, 1, 53–63.
Williamson, P. O., Robichaud, J. A., & Francis, I. L. (2012). Comparison of Chinese and Australian consumer's liking responses for red wines. Australian Journal of Grape and Wine Research, 18, 256–267.
Yeomans, M., Prescott, J., & Gould, N. (2009). Acquired hedonic and sensory char-acteristics of odours; influence of sweet liker and propylthiouracil taster status. The Quartely Journal of Experimental Psychology, 62, 1648–1664.
Yeomans, M., Tepper, B., Riestzschel, J., & Prescott, J. (2007). Human hedonic respenses to sweetness: Role of taste genetics and anatomy. Physiology and Behaviour, 91, 264–273.
Zhang, J., Bray, B. C., Zhang, M., & Lanza, S. T. (2015). Personality profiles and frequent heavy drinking in young adulthood. Personality and Individual Differences, 80, 18–21.