www.scielo.br/rbg
NUCLEAR MAGNETIC RESONANCE TO CHARACTERIZE THE PORE SYSTEM OF COQUINAS
FROM MORRO DO CHAVES FORMATION, SERGIPE-ALAGOAS BASIN, BRAZIL
Fernanda Oliveira Hoerlle
1, Edmilson Helton Rios
1, William Godoy de Azevedo Lopes da Silva
1,
Elizabeth May Braga Dulley Pontedeiro
1, Maira da Costa de Oliveira Lima
1, Patrick William Michael Corbett
2,
José Luis Drummond Alves
1and Paulo Couto
1ABSTRACT. Nuclear magnetic resonance (NMR) is a recognized petrophysical tool in the oil and gas industry to characterize reservoir rocks and fluids. In this study, the pore system of coquinas from a single bed of a quarry in the Morro do Chaves Formation was evaluated. These sedimentary rocks have been considered as a potential analogous to some Brazilian pre-salt reservoir rocks. The objective of this work was to characterize the porous system of coquinas in terms of total porosity and pore size distribution using low-field NMR. Conversion of T2relaxation times to pore size radii was performed and literature cut-offs were applied for porosity
partitioning. Coquinas were classified and ranked according to their percentage of macro, meso and micro porosity. This work verified quantitatively the pore system heterogeneities for the coquina samples and the variation in the layer from which they were extracted. The study provides some clues on lateral porosity and pore size variation in any reservoir for which this unit is an analogue.
Keywords: petrophysics, NMR, total porosity, pore size distribution, porosity partitioning.
RESUMO.Ressonância magnética nuclear (RMN) é uma técnica petrofísica reconhecida na indústria de óleo e gás pela sua capacidade de caracterizar rochas reservatório e seus fluidos saturantes. Neste estudo, foi avaliado o sistema poroso de coquinas pertencentes a uma camada de uma pedreira na Formação Morro do Chaves. Essas rochas sedimentares foram consideradas possíveis análogos de algumas rochas carbonáticas do pré-sal brasileiro. O objetivo do trabalho foi caracterizar o sistema poroso dessas coquinas em termos de porosidade total e distribuição de tamanho de poros utilizando RMN de baixo campo. Realizou-se a conversão dos tempos de relaxação T2para raios de poro e empregou-se cut-offs da literatura para o particionamento da porosidade. As coquinas foram classificadas e ranqueadas
de acordo com a sua porcentagem de macro, meso e micro poros. Verificou-se quantitativamente a heterogeneidade do sistema poroso das coquinas estudadas e a variação da camada sedimentar em que os plugues foram retirados. O estudo fornece informações sobre a variação lateral de porosidade e tamanho de poros para reservatórios que tenham a unidade estudada como análogo.
Palavras-chave: petrofísica, RMN, porosidade total, distribuição do tamanho de poros, particionamento da porosidade.
1Universidade Federal do Rio de Janeiro, COPPE, Rua Moniz Aragão, 360, Bloco 4 (CT2/LTEP), Cidade Universitária, Rio de Janeiro, 21941-972,
RJ, Brazil - E-mails: fernandahoerlle@petroleo.ufrj.br, edmilson@petroleo.ufrj.br, wmgodoy@petroleo.ufrj.br, bettymay@petroleo.ufrj.br, mairalima@coc.ufrj.br, jalves@lamce.coppe.ufrj.br, pcouto@petroleo.ufrj.br
2Institute of Petroleum Engineering, School of Energy Geoscience, Infrastructure and Society, Heriot-Watt University; Riccarton, Edinburgh, EH14 4AS, UK, 01314513607
INTRODUCTION
Nuclear magnetic resonance (NMR) is an important technique for investigating the physical and chemical properties of materials. In the oil and gas industry, NMR is frequently used to help in reservoir characterization both in laboratorial and in well logging measurements (Rios et al., 2010; Trevizan et al., 2014).
Under a constant magnetic field (B0), an induced magnetization, aligned with B0 , builds up as a resultant of the contribution of the nuclear spins ensemble from the 1H isotopes present in the reservoir fluids, water or hydrocarbons. Subsequently, an oscillating magnetic field (B1), perpendicular to B0, is applied in order to remove the protons from equilibrium. When B1 is removed, the spins return to equilibrium and the induced magnetization builds up again. This process is known as nuclear magnetic relaxation and can be detected by an electrical signal called free induction decay (FID), usually fitted by an exponential curve.
In complex materials, such as porous media, the relaxation decay is acquired by the CPMG (Carr & Purcell, 1954; Meiboom & Gill, 1958) pulse-sequence technique where multiple spin echoes are generated. The decay is modeled by fitting multiple exponentials, each one with a different maximum signal amplitude and a correspondent relaxation decay rate, 1/T2. The T2 is the transverse relaxation time constant due to the spin-spin relaxation interactions. The signal amplitudes for a pre-determined relaxation time range are obtained by a regularized numerical inversion due to the ill-posed nature of the problem (Coates et al., 1999; Rios et al., 2015). The amplitudes of the resultant T2distribution can be calibrated to fluid volume and, consequently, to porosity.
In the fast-diffusion regime, usually achieved with a short inter-echo space in the CPMG experiment and when surface relaxation is stronger than bulk relaxation, T2 is related to pore size (Kleinberg, 1999). Bulk relaxation influence is minimized when the formation is fully saturated with a single and well-behaved fluid, such as brine or light oil. Large pores are associated with longer relaxation times, while smaller pores are associated with shorter relaxation times (Coates et al., 1999).
In this study, we applied the CPMG experiment to fully brine-saturated carbonate rocks classified as coquinas. The acquired NMR data was used to quantify the total and fractional porosity and the pore size distribution. Partitioned porosity was evaluated according to the modified classification of Lønøy (2006) applied on the pore size distribution obtained with the average surface relaxivity calculated by Luna et al. (2016). Surface
relaxivity is a phenomenological parameter that relates relaxation times to pore size.
MATERIAL AND METHODS
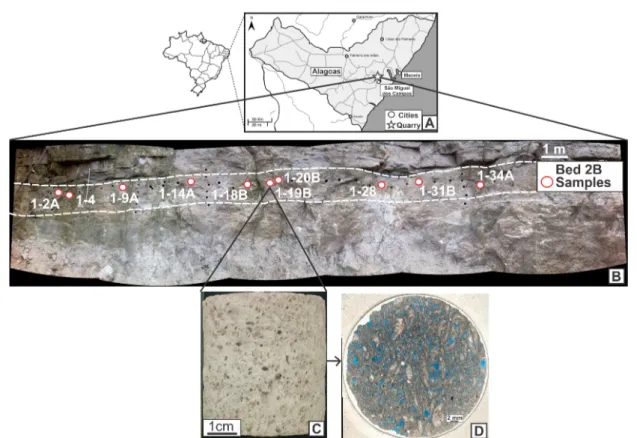
The studied coquinas are from a quarry located in the Morro do Chaves Formation in Sergipe-Alagoas Basin, Northeast Brazil (Fig. 1A). Corbett et al. (2016) suggested this outcrop as an analogue to some pre-salt reservoirs of Brazil. The studied plugs (1-2A, 1-4, 1-9A, 1-14A, 1-18B, 1-19B, 1-20B, 1-28, 1-31B, and 1-34A) were sampled horizontally along one single bed named as Bed 2B (Fig. 1B and 1C), layer also studied by Estrella (2015), Corbett et al. (2016), Luna et al. (2016) and Hoerlle et al. (2017, 2018).
These coquinas are formed by non-marine bioclasts, mainly bivalves, with different amounts of terrigenous content (Corbett et al., 2016). The investigated samples have approximately 1% of terrigenous. The bivalves were transported and the rock was affected by several phases of diagenesis, resulting in complex pore systems (Tavares et al., 2015) which is visually heterogeneous (Fig. 1C). The heterogeneity can also be identified by the presence of different types, sizes, and shapes of pores. The pore types described with the thin sections (Fig. 1D) are mainly interparticle, vugular and intercrystalline. Intraparticle, moldic, shelter, fracture and breccia pore types also occur, but they are less frequent (Hoerlle et al., 2018).
As a standard routine core analysis procedure, the coquina plugs were cleaned with toluene and methanol to remove eventual oil and salt that could be present in the pore space. Samples were dried in an oven and thermalized under vacuum to laboratory temperature. Gas (helium - He) expansion technique was applied based on Boyle’s Law to calculate the porosity of the samples. Measurements were performed at a confining pressure of 500 psi on the He porosimeter from Weatherford, DV-4000, which belongs to the Enhanced Oil Recovery Laboratory, LRAP/COPPE/UFRJ. According to Lucia (2007), this method is the most accurate for measuring total porosity, and therefore we used it as a comparison benchmark for the total NMR porosity.
For the NMR core analysis, the samples were saturated with a salt-water solution (brine) containing 50,000 ppm of NaCl. The brine density, 1.04 g/cm3at 25◦C, was measured using the DM40 density meter from Mettler Toledo. Samples were saturated in the Petrobras Research Center (Cenpes). The plugs were submitted to vacuum inside a chamber, which was then invaded with brine and subsequently pressurized to 2,000 psi for 24 hours.
Figure 1 – (A) Location of the quarry in Morro do Chaves Formation, Sergipe-Alagoas Basin, Brazil; (B) Bed 2B layer where coquina samples where laterally plugged; (C) sample 1-19B, plugged with 1.5 inches diameter; (D) petrographic thin section extracted from sample 1-19B. Modified from Corbett et al. (2016).
Once the saturation procedure was performed, the samples were weighted to verify the effectiveness of the procedure. A saturation of 100% is expected, but an error of 5% is usually accepted (API (American Petroleum Institute), 1998). The Eqs. (1) and (2) were used to calculate the saturation index (Isat), in percentage: Isat= 100 Vbrine Vp , (1) Vbrine= Msat− Mdry ρbrine , (2)
where Vbrineis the volume of brine saturating the pore space of the rock, Vpis the pore volume measured by the helium porosimeter, Msatis the mass of the sample saturated with brine, Mdryis the dry mass of the sample, andρbrineis the brine density.
The CPMG experiment was performed in a low-field NMR equipment from Oxford Instruments (OI), the MQC-5MHz (Fig. 2A). This benchtop NMR analyzer belongs to the Low-Resolution NMR Laboratory at the Institute of Macromolecules (IMA/UFRJ). Samples were wrapped with teflon tape to avoid fluid losses during NMR measurements (Fig. 2B). The raw relaxation decays
were acquired and pre-processed with the RINMR software (OI) using 4,096 echoes and an inter-echo space of 400µs. The T2 distributions were inverted with WinDXP software (OI) using 100 bins logarithmically spaced from 100µs to 10 s.
Conversion of T2 relaxation times, usually in seconds, to pore size radii (Rp), usually in micrometers, was performed using Eqs. (3) and (4) as described by Rios et al. (2015):
1 T2 =ρ2 S V =ρ2 Fg Rp , (3) Rp= Fgρ2T2, (4) where ρ2 is the transverse surface relaxivity, VS is the pore surface-to-volume ratio, and Fg is a geometric factor that represents planar (Fg = 1), cylindrical (Fg= 2) or spherical (Fg = 3) pore shapes (Rios et al., 2015). In this work, pores were assumed to have a spherical shape, whileρ2was considered to be 35.7µm/s, which is an average from the values calculated by Luna et al. (2016), who used five samples from the same layer (Bed 2B) at Morro do Chaves Formation (Fig 1B).
Figure 2 – (A) Low-field NMR analyzer, MQC 5MHz; (B) tube with fluid calibration (bulk brine) and saturated samples wrapped in teflon tape before NMR data acquisition.
Table 1 – Coquina samples and results from routine and NMR core analysis.
Plug Dimensions Routine Core Analysis NMR Core Analysis Code L (cm) D (cm) Mdry(g) Vp(cm3) φHe(%) Msat(g) Isat(%) φNMR(%)
1-2A 3.53 3.63 75.91 6.98 19.9 82.94 97.0 19.7 1-4 3.52 3.63 82.21 5.26 14.7 87.49 96.7 14.3 1-9A 3.91 3.63 92.49 5.53 13.9 98.19 99.1 13.9 1-14A 2.69 3.52 53.71 5.10 20.3 58.58 91.8 20.2 1-18B 3.04 3.44 59.12 4.84 18.0 63.94 95.8 18.4 1-19B 3.61 3.50 74.10 6.82 19.8 81.03 97.8 19.7 1-20B 3.61 3.62 76.76 6.57 18.7 83.31 95.9 18.4 1-28 3.38 3.43 69.37 5.17 16.7 74.51 95.7 17.2 1-31B 3.64 3.49 78.67 4.96 14.5 83.71 97.8 14.5 1-34A 3.53 3.60 79.10 5.74 16.3 83.58 75.1 13.9
RESULTS AND DISCUSSION
Samples dimension, dry-measured properties and saturated-measured properties are shown in Table 1. The cylindrical plugs have similar diameters (D) and lengths (L). The saturation index, calculated from Eqs. (1) and (2), was satisfactory for all the samples except for plug 1-34A, of which only 75.1% of the pore space was filled with brine. This sample has several large pores at its external surface, and hence may not have retained all
the brine. Since the NMR signal is proportional to the volume of fluids in the pore space, one may expect a porosity deficit for this sample. For avoiding such an issue, we recommend that the experiment should be performed with a NMR core holder (not available for this work), which would allow extra brine to be injected into the confined pore space.
NMR signal measured from the plugs was calibrated to pore volume using the signal measured from a known volume of brine (Fig. 2B). NMR total porosity, which is obtained dividing
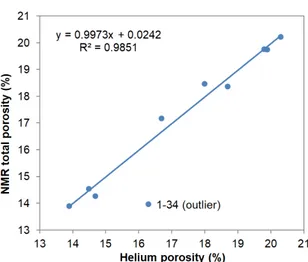
NMR pore volume to the geometrical sample volume, ranged from 13.9% to 20.2% (Table 1). Figure 3 provides a comparison of the NMR-based porosities with the He-based porosities. Excluding the sample not fully saturated, the correlation coefficient (R2) was 0.99, which demonstrates that NMR is a good method for measuring porosities. The inverted T2 distributions were calibrated to incremental porosity (Fig. 4) such that the sum of all the 100 increments gives the total NMR porosity (Rios et al., 2015). Figure 5 shows the T2values converted to pore radii using Eq. (4).
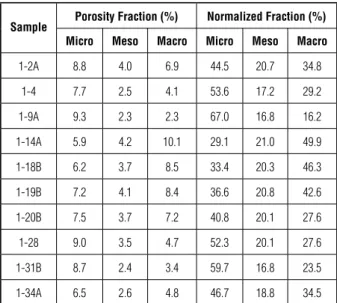
Since intraparticle pore was one of the predominant types of pores in the samples, we adapted the porosity partitioning method of Lønøy (2006) for this type of pore. The classification is based on the value of the pore radii. Pores with a radius less than 25 µm were considered micropores, pores between 25µm and 50 µm were considered mesopores, and pores above 50µm were macropores.
Table 2 – NMR porosity partitioning using cut-offs of 25 and 50µm.
Sample Porosity Fraction (%) Normalized Fraction (%) Micro Meso Macro Micro Meso Macro 1-2A 8.8 4.0 6.9 44.5 20.7 34.8 1-4 7.7 2.5 4.1 53.6 17.2 29.2 1-9A 9.3 2.3 2.3 67.0 16.8 16.2 1-14A 5.9 4.2 10.1 29.1 21.0 49.9 1-18B 6.2 3.7 8.5 33.4 20.3 46.3 1-19B 7.2 4.1 8.4 36.6 20.8 42.6 1-20B 7.5 3.7 7.2 40.8 20.1 27.6 1-28 9.0 3.5 4.7 52.3 20.1 27.6 1-31B 8.7 2.4 3.4 59.7 16.8 23.5 1-34A 6.5 2.6 4.8 46.7 18.8 34.5
From the cumulative porosity calculated from the NMR pore radii distribution, as exemplified for sample 1-14A in Figure 6, we could then quantify the partitioned porosity and its relative percentages (Table 2).
Based on this modified Lønøy (2006) method, we observed that most of the pores of samples 1-2A, 1-4, 1-28, 1-31B, and 1-34A are classified as micropores, followed by macropores and, to a lesser extent, as mesopores. Sample 1-9A also showed micropores as dominant pore size, but the meso and macropores had similar percentages. In contrast, plugs 1-14A, 1-18B, and 1-19B presented different partitioning as compared to the other
samples. They showed a majority of macropores, followed by micropores and, to a lesser extent, mesopores. The sample 1-20B presented the micro- and macro-pores with similar proportion, being the micropore the majority of the pore sizes. For all of the samples studied, we found that the predominant pore size is not constant, but that mesopores always had the fewest number of pores (Table 2). This is because cut-offs in Lønøy (2006) classification are very close to each other as it can be seen in Figure 6.
Luna et al. (2016) found different results for porosity partitioning in vertical samples of Bed 2B. In their study, the macroporosity were dominant, followed by the mesoporosity, and, in minor percentage, the microporosity. This difference in the porosity partitioning is because Luna et al. (2016) used different cut-offs from those used in this work. It is beyond the scope of this study to assess what is the most appropriate definition of microporosity. Instead, this study focuses on the relative changes in percentages of micro- and macro-pores as it may help to explain the large variations in permeability (for small changes in porosity) that has previously been reported in this bed (Corbett et al., 2016).
The image of Bed 2B (Fig. 7) shows, from left to right, a predominance of micropores followed by macropores for samples 1-2A, 1-4 and 1-9A. In the middle of the layer (samples 1-14A, 1-18B and 1-19B), the preponderance is of macropores, followed by micropores. Finally, in the region to the right of Figure 7, represented by samples 1-28, 1-31B, and 1-34A, micropores are predominant, followed by macropores. Sample 1-20B has similar percentages of macro- and micro-pores and it may represent the start of a transition zone of pore size predominance. Corbett et al. (2016) noted that Bed 2B showed a substantial variation in its poroperm properties throughout the layer, especially in permeability. These authors also divided the layer in regions of high and medium porosity. Results of our work not only confirmed this heterogeneity (Table 1), but also show a clear variation in the predominant pore size along the layer (Fig. 7).
CONCLUSION
The NMR technique proved to be an efficient laboratorial method for total porosity measurements of coquinas from the Morro do Chaves Formation. The partitioning of porosity according to the modified classification of Lønøy (2006) and the use of the average surface relaxivity calculated by Luna et al. (2016) were also satisfactory. It shall be noted that the assumption of spherical
Figure 3 – Correlation between gas (He) porosity and NMR total porosity. Figure 4 – NMR T2distribution in seconds.
Figure 5 – NMR pore radii distribution in micrometers. Figure 6 – NMR porosity partitioned into macro, meso and micro pores for sample 1-14A based on the 25 and 50µm cut-off reported by Lønøy (2006).
Figure 7 – Heterogeneity of pore size classes (macro, micro, and meso pores) along the studied layer of Morro do Chaves Formation relative to the analyzed samples. Modified from Corbett et al. (2016).
pores over simplifies the complexity of these biomoldic rudstone carbonates.
A considerable heterogeneity of the coquinas, and the layer from where they were extracted, was quantitatively described with
the pore size distribution. It was verified that a horizontal variation of facies exists in the layer by observing the dominant pore sizes present in the different regions. The diagenesis and sedimentation process are the main causes for that (Tavares et al., 2015; Estrella,
2015). This lateral variation in poroperm properties, which can easily be observed in the quarry sections, can only be surmised and modelled in the subsurface.
The studied samples contained micro, meso and macro pores. Normalized curves of the cumulative porosity showed that the coquinas do not have a predominant pattern of pore size. We observed that 70% of the samples had micropores as the predominant pore size, followed by macropores and then mesopores. On the other hand, the remaining 30% had macropores as the dominant pore size, followed by micropores and, to a lesser extent, mesopores. The predominance of the pore size can influence the permeability of the samples and of the studied layer. This will be further investigated in future work.
ACKNOWLEDGEMENTS
This research was carried out in association with the ongoing R&D projects registered as ANP 19027-2, “Desenvolvimento de infraestrutura para pesquisa e desenvolvimento em recuperação avançada de óleo – EOR no Brasil” (UFRJ/Shell Brazil/ ANP) setting-up a advanced EOR Lab facility for R&D in Brazil, and ANP 20163-2, “Análise experimental da recuperação de petróleo para as rochas carbonáticas do pré-sal brasileiro através da injeção alternada de CO2e água”, both sponsored by Shell Brazil under the ANP R&D levy as “Compromisso de Investimentos com Pesquisa e Desenvolvimento”. This research was also carried out with the support of project ANP 18029-9 ”Projeto de correlação petrofísica poço x perfil” sponsored by Petrobras under the ANP R&D levy “Compromisso de Investimentos com Pesquisa e Desenvolvimento”. This study was financed in part by the Coordenação de Aperfeiçoamento de Pessoal de Nível Superior - Brazil (CAPES) – Finance Code 001, and carried out with the support of CNPq, Conselho Nacional de Desenvolvimento Científico e Tecnológico - Brazil. The authors acknowledge Professor Leonardo Borghi from Universidade Federal do Rio de Janeiro and the Sedimentary Geology Laboratory (LAGESED/UFRJ) for the concession of the samples of the SACL project - Sedimentary geological analysis of Cretaceous carbonate successions in a Brazilian sedimentary basin (ANP authorization n.551 / 2012, BG E&P Brazil project BG-04, COPPETEC Foundation project IGEO-15.981). The authors acknowledge the Petrobras Research and Development Center (Cenpes) for the aid in the saturation of the rocks and Professor Maria Inês Bruno Tavares (IMA/UFRJ) for the use of the NMR equipment. The authors extend thanks to the research teams of LRAP/COPPE/UFRJ and LAGESED/UFRJ.
REFERENCES
API (American Petroleum Institute). 1998. 40, Recommended Practices for Core Analysis. Washington. 2nd ed., 236 pp.
CARR HY & PURCELL EM. 1954. Effects of diffusion on free precession in nuclear magnetic resonance experiments. Physical Review, 94(3): 630-638.
COATES GR, XIAO L & PRAMMER. 1999. NMR logging: principles and applications. Volume 344. Halliburton Energy Services Houston. CORBETT PW, ESTRELLA R, RODRIGUEZ AM, SHOEIR A, BORGHI L & TAVARES AC. 2016. Integration of cretaceous Morro do Chaves rock properties (NE Brazil) with the Holocene Hamelin Coquina architecture (Shark Bay, Western Australia) to model effective permeability. Petroleum Geoscience, 22(2): 105–122.
ESTRELLA R. 2015. Variação da porosidade e da Permeabilidade em coquinas da Formação Morro do Chaves (andar Jiquiá), Bacia de Sergipe-Alagoas. Geology Monography, Programa de Graduação em Geologia, Universidade Federal do Rio de Janeiro, 2015, 82 pp. HOERLLE FO, SILVA WGAL, ALVES JLD & COUTO P. 2018. Porosidade e distribuição de tamanho de poros de coquinas da Formação Morro do Chaves através da análise digital de imagem. In: Rio Oil & Gas Expo and Conference 2018. Rio de Janeiro: IBP, Rio de Janeiro, Brazil.
HOERLLE FO, SILVA WGAL, RIOS EH, SILVEIRA TMG, COUTO P, ALVES JLD, LIMA MC, BORGHI L & CORBETT PWM. 2017. Evaluation of segmentation procedures using x-ray computed microtomography images of coquinas from Morro do Chaves Formation–NE Brazil. In: XXXVIII Iberian-Latin American Congress on Computational Methods in Engineering 2017, Florianópolis, ABMEC, Santa Catarina, Brazil. KLEINBERG RL. 1999. 9. Nuclear Magnetic Resonance. In: Methods in the Physics of Porous Media. Volume 35. Academic Press.
LØNØY A. 2006. Making sense of carbonate pore systems. AAPG Bulletin, 90(9): 1381–1405.
LUCIA FJ. 2007. Carbonate reservoir characterization: An integrated approach. Springer Science & Business Media, 226 pp.
LUNA J, PEROSI FA, DOS SANTOS RIBEIRO MG, SOUZA A, BOYD A, DE ALMEIDA LFB & CORBETT PWM. 2016. Petrophysical Rock Typing of Coquinas from the Morro do Chaves Formation, Sergipe-Alagoas Basin (Northeast Brazil). Brazilian Journal of Geophysics, 34(4): 509–521.
MEIBOOM S & GILL D. 1958. Modified spin-echo method for measuring nuclear relaxation times. Review of Scientific Instruments, 29(8): 688–691.
RIOS EH, FIGUEIREDO I, MOSS AK, PRITCHARD TN, GLASSBOROW BA, DOMINGUES ABG & AZEREDO RBV. 2015. NMR permeability estimators in ‘chalk’ carbonate rocks obtained under different relaxation
times and MICP size scalings. Geophysical Journal International, 205(1): 260-274.
RIOS EH, STAEL GC, RAMOS PFO, MACHADO VF, FORECCHI RB & AZEREDO RBV. 2010. Caracterização petrofísica de rochas reservatório por Ressonância Magnética Nuclear, In: IV Simpósio Brasileiro de Geofísica, Brasília, SBGf, Distrito Federal, Brazil.
TAVARES AC, BORGHI L, CORBETT P, NOBRE-LOPES J & CÂMARA R. 2015. Facies and depositional environments for the coquinas of
the Morro do Chaves Formation, Sergipe-Alagoas Basin, defined by taphonomic and compositional criteria. Brazilian Journal of Geology, 45(3): 415–429.
TREVIZAN W, NETTO P, COUTINHO B, MACHADO VF, RIOS EH, CHEN S, SHAO W & ROMERO P. 2014. Method for predicting permeability of complex carbonate reservoirs using NMR logging measurements. Petrophysics, 55(03): 240–252.
Recebido em 22 setembro, 2018 / Aceito em 12 novembro, 2018 Received on September 22, 2018 / accepted on November 12, 2018