RESIDUAL EFFECT OF SOIL TILLAGE ON WATER EROSION
FROM A TYPIC PALEUDALF UNDER LONG-TERM
NO-TILLAGE AND CROPPING SYSTEMS
(1)Mastrângello Enívar Lanzanova(2), Flávio Luiz Foletto Eltz(3), Rodrigo da Silveira
Nicoloso(4), Elemar Antonino Cassol(5), Ildegardis Bertol(6), Telmo Jorge Carneiro
Amado(7) & Vitor Cauduro Girardello(8)
SUMMARY
Soil erosion is one of the chief causes of agricultural land degradation. Practices of conservation agriculture, such as no-tillage and cover crops, are the key strategies of soil erosion control. In a long-term experiment on a Typic Paleudalf, we evaluated the temporal changes of soil loss and water runoff rates promoted by the transition from conventional to no-tillage systems in the treatments: bare soil (BS); grassland (GL); winter fallow (WF); intercrop maize and velvet bean (M+VB); intercrop maize and jack bean (M+JB); forage radish as winter cover crop (FR); and winter cover crop consortium ryegrass - common vetch (RG+CV). Intensive soil tillage induced higher soil losses and water runoff rates; these effects persisted for up to three years after the adoption of no-tillage. The planting of cover crops resulted in a faster decrease of soil and water loss rates in the first years after conversion from conventional to no-tillage than to winter fallow. The association of no-tillage with cover crops promoted progressive soil stabilization; after three years, soil losses were similar and water runoff was lower than from grassland soil. In the treatments of cropping systems with cover crops, soil losses were reduced by 99.7 and 66.7 %,
(1) Part of first author´s Doctorate Thesis at the Federal University of Santa Maria - UFSM. Received for publication on
September 26, 2012 and approved on August 22, 2013.
(2) Professor at State University of Rio Grande do Sul - UERGS. Rua Cipriano Barata, 47. CEP 98600-000 Três Passos (RS), Brazil.
E-mail: mastrangello-lanzanova@uergs.edu.br
(3) Retired Professor, Soil Department, UFSM. Av. Roraima, s/n. Zipe code 97105-900 Santa Maria (RS), Brazil. E-mail:
feltz@ccr.ufsm.br
(4) Researcher, Embrapa Swine and Poultry. BR 153, Km 110. P.O. Box 21. Zipe code 89700-000 Concórdia (SC), Brazil. E-mail:
rodrigo.nicoloso@embrapa.br
(5) Associate Professor, Soil Department, Agronomy Faculty, Federal University of Rio Grande do Sul - UFRGS. Av. Bento
Gonçalves, 7712. P.O. Box 15100. Zipe code 91501-970 Porto Alegre (RS), Brazil. E-mail: cassolea@orion.ufrgs.br
(6) Professor, Soil and Natural Resources Department, State University of Santa Catarina - UDESC. Av. Luís de Camões, 2090.
Zipe code 88520-000 Lages (SC), Brazil. Research scholarship from CNPq . E-mail: a2ib@cav.udesc.br
(7) Associate Professor, Soil Department, UFSM. Av. Roraima, s/n. Zipe code 97105-900 Santa Maria (RS), Brazil. E-mail:
compared to bare soil and winter fallow, while the water losses were reduced by 96.8 and 71.8 % in relation to the same treatments, respectively.
Index terms: cover crops, water runoff, soil erosion.
RESUMO:EFEITO RESIDUAL DO PREPARO DO SOLO SOBRE A EROSÃO HÍDRICA EM UM ARGISSOLO VERMELHO SOB PLANTIO DIRETO E SISTEMAS DE CULTURAS DE LONGA DURAÇÃO
Erosão ainda causa degradação do solo em todo o mundo e é uma das mais importantes fontes de poluição ambiental. Para atenuar esse problema, a mudança de manejo do solo é indicada, e o sistema plantio direto é a principal ferramenta utilizada. Com o objetivo de avaliar as alterações temporais das taxas de escoamento da água e das perdas de solo provocadas pela transição do preparo convencional do solo para o sistema plantio direto (SPD), um experimento de longa duração foi conduzido em um Argissolo Vermelho distrófico, na Universidade Federal de Santa Maria, RS, Brasil. Os tratamentos testados foram: BS - solo descoberto; GL - campo nativo; WF - pousio invernal; M+VB - consórcio de milho e mucuna-preta; M+JB - consórcio de milho e feijão de porco; FR - nabo forrageiro como cultura de cobertura de inverno; e RG+CV - consórcio de culturas de cobertura de inverno, azevém e ervilhaca. Os resultados evidenciaram que o preparo do solo promoveu aumento da erosão e do escoamento da água; consequentemente, os efeitos desses permaneceram significativos pelo menos três anos após a adoção do SPD. Também apresentaram que o uso de culturas de cobertura de inverno ou de verão gerou estabilização mais rápida do solo, bem como menores perdas de solo e água do que o pousio invernal, nos primeiros anos após o preparo do solo. O SPD associado a plantas de cobertura do solo ocasionou a estabilização progressiva do solo; após três anos de sua implantação, a perda de solo foi semelhante e o escoamento de água foi menor, em comparação ao solo sob campo nativo. O uso de culturas de cobertura de inverno ou de verão reduziu a perda de solo, em 99,7 e 66,7 %, e do escoamento de água, em 96,8 e 71,8 %, em comparação ao solo descoberto e o pousio invernal, respectivamente.
Termos de indexação: plantas de cobertura, escoamento superficial de água, erosão do solo.
INTRODUCTION
Soil erosion is the main cause of land degradation (Eswaran et al., 2001; Lal, 2001) and one of the major environmental and food security threats mankind is facing (Pimentel, 2006). Slight to moderate soil erosion can increase crop yield losses by 0.6 to 2.8 % for each centimeter of eroded topsoil (Langdale et al., 1979; Albuquerque et al., 1996; Duan et al., 2011). About 10 million hectares of cropland are abandoned worldwide every year due to the depletion of crop yields by severe soil erosion (Faeth & Crosson, 1994). However, the increasing food demand of the growing world population will require an additional 1 billion hectares of agricultural lands by 2050 (Tilman et al., 2001). This process increases the pressure on agriculture soils to ensure food security and water quality and to meet emerging environmental demands, as for renewable energy production and mitigation of climate change (Lal, 2007).
Croplands are especially susceptible to soil erosion under intensive and frequent soil tillage or exposure of bare soil to rain. When soil is tilled and turned, the potential for accelerated soil loss increases (Triplett & Dick, 2008). Conventional tillage (CT) increases soil particle detachment and transportation by soil splash
(Reichert & Cabeda, 1992; Choudhary et al., 1997), increasing surface sealing, water runoff and, consequently, reducing water infiltration (Cogo et al., 2003; Guadagnin et al., 2005; Amaral et al., 2008; Strudley et al., 2008). The introduction of no-tillage (NT) systems in crop and residue management is a key strategy for reducing soil erosion and water runoff in agriculture (Schuller et al., 2007).
1982 and 2007 (NRCS, 2010). This result could be partially explained by the increase in NT area from 2.5 to 16.1 % of US croplands between 1984 and 2007 (FAO, 2011). A recent study showed that soil erosion rates in a cropland from Chile decreased from 11.0 to 1.4 Mg ha-1 yr-1 or 87 %, 18 years after CT-NT
conversion (Schuller et al., 2007). However, there is a lack of information about how much time is necessary for soil stabilization and to reduce soil and water losses after NT conversion. The objective of this work was to evaluate temporal changes of soil erosion and water runoff rates from a Typic Paleudalf in Southern Brazil, after the conversion of grassland to CT crops and the following adoption of NT with different cropping systems.
MATERIAL AND METHODS
This long-term experiment was carried out at the experimental station of the Soil Department of the Federal University of Santa Maria, Rio Grande do Sul, Brazil. The local climate is humid subtropical (Köppen Cfa), with mean annual rainfall and temperature of 1,500 mm and 18.5 oC, respectively. The soil was a Typic Paleudalf (USDA, 1999) with the following properties (0-0.20 m layer) at the beginning of the experiment: 87 g kg-1 clay; 660 g
kg-1 sand; 253 g kg-1 silt; pH (H
2O) = 4.50; P =
1.80 mg dm-3; K = 33 mg dm-3; O.M.= 24.6 g kg-1;
Al = 1.4 mmolc dm-3; Ca + Mg = 2.6 cmol c dm-3;
and CEC = 4.08 cmolc dm-3 (Debarba, 1993).
The experiment was installed on a grassland area in March 1991, in a completely randomized design with seven treatments and two replications. The treatments consisted of: bare soil BS; grassland -GL; winter fallow - WF; intercrop maize (Zea mays
L.) and velvet bean (Stizolobium cinereum Piper & Tracy) - M+VB; intercrop maize and jack bean [Canavalia ensiformis (L.) DC.] - M+JB; forage radish
(Raphanus sativus L.) as winter cover crop - FR;
winter cover crop consortium of ryegrass (Lolium
multiflorum Lam.) and common vetch (Vicia sativa
L.) - RG+CV (detailed descriptions see Table 1). At that time, 6.5 Mg ha-1 lime and 130 kg ha-1 P
2O5
were applied and plowed into the soil by disk plowing followed by two tandem disk operations, except in the GL treatment, which was not fertilized. Afterwards no-tillage was adopted for all cropping systems. Each plot (width 3.5 m, length 22 m) was marked by galvanized steel sheets (height 0.20 m), driven into the soil to a depth of 0.10 m. The average plot slope was 0.055 m m-1.
Soybean and maize were sown with a hand-held seeder at a density of, respectively, 250.000 and 60.000 plants ha-1. Velvet and jack beans as intercrop after
maize were sown in hoe-dug grooves at a density of 40 and 60 kg ha-1 seeds, respectively. All crop rows ran
perpendicular to the soil slope. Ryegrass, common
vetch and forage radish seeds (20, 30 and 20 kg ha-1,
respectively) seeds were broadcast by hand on plots without subsequent incorporation. Soybean and maize were fertilized according to the recommendations of CQFSRS/SC (2004).
Soil and water losses were first measured in April 1992, after the installation of covered collecting spouts at the lower end of the plots, which were connected to 1 m3 collection tanks by 75 mm PVC pipes. On the
BS plots, a second collection tank was installed due to the high volume of water runoff and soil erosion from that treatment. The two collection tanks were connected through GEIB divisors to collect only 1/9 of the water volume. Soil losses were measured according to the method of Veiga & Wildner (1993) after each rainfall or group of rainfall events. Considering the variations in soil slope between plots, soil losses were adjusted to a standard slope of 0.06 m m-1 (Wischmeier
& Smith, 1978). Rainfall data were collected at a meteorological station at a distance of 2 km from the experimental area. Rain erosivity was determined by the EI30 index, calculated as proposed by Wischmeier & Smith (1978) with modifications by Cabeda (1976). The rain erosivity data were converted to the international unit system as described by Foster et al. (1981).
Analysis of variance (ANOVA) was performed using SAS PROC MIXED (SAS Institute, 2002) to assess differences in soil and water losses among treatments. The ANOVA was performed comparing all treatments and also with exclusion of the BS treatment from the comparisons, since the high soil and water losses from bare soil limited the sensitivity of the statistical analysis to detect differences among the other treatments. The residual effects of soil tillage on water erosion were evaluated by temporal changes in soil and water losses from each treatment by regression analysis of soil and water losses over time, using software TableCurve 2D v5.01 (Systat Software Inc., Richmond, CA 94804-2028). Treatments with significant changes in soil and water loss rates over time were subjected to a new ANOVA to assess differences among treatments and evaluation periods (group of years). The periods were established based on the results of regression analysis which showed periods with distinct patterns of soil and water losses over time. Means were compared using differences in least square means. Results were considered statistically significant at p<0.05.
RESULTS AND DISCUSSION
Annual and total soil losses
After 16 years, 2,539.7 Mg ha-1 of soil were lost
from the BS treatment (Table 2). Considering an average soil bulk density of 1.51 Mg m-3 in the 0-0.16
experiment (Lanzanova et al., 2010), an estimated 0.168 m of soil were eroded from this treatment by water. Annual soil losses from the BS were significantly higher than in all other treatments, with exception of the period from 2004 to 2005, when rainfall volume and erosivity were very low (925 mm and 3,919 MJ mm ha-1 h-1, respectively) in comparison to
the average rainfall volume and erosivity measured in the 16 experimental years (1,663 mm and 7,891 MJ mm ha-1 h-1, respectively). Total soil loss from BS
was 125 and 1,149 timeshigher than in the treatments WF and GL, respectively.
The huge soil losses from BS, several times higher than in the other treatments, limited the ANOVA sensitivity to detect the small differences between NT and GL treatments. When excluding the BS treatment from the statistical analysis, ANOVA and the LS means test were able to detect significant differences in soil erosion in the first two years of the experiment and in total soil losses accumulated over 16 years of measurement in the other treatments. In 1992-1993 and 1993-1994, more soil was lost from the treatment WF than from the other NT treatments and GL, which did not differ from each other. The higher soil losses from WF were probably due to the lack of soil cover in that treatment in the first years after soil tillage. Soil losses were lower from the other NT treatments with summer and winter cover crops, not
Treatment Year(1)
BS(2) WF M+VB M+JB FR RG+CV GL
1991-1992 WF/Maize GP/Maize WF/M+VB WF/M+JB BL/Maize BO+CV/Maize Grassland
1992-1993 Bare soil WF/Maize WF/M+VB WF/M+JB BL/Maize BO+CV/Maize Grassland
1993-1994 Bare soil WF/Maize WF/M+VB WF/M+JB BL/Maize BO+CV/Maize Grassland
1994-1995 Bare soil WF/Soybean WF/Sunflower+VB WF/Sunflower+JB RG/Soybean BO/Soybean Grassland
1995-1996 Bare soil WF/Maize WF/M+VB WF/M+JB FR/Maize RG+CV/Maize Grassland
1996-1997 Bare soil WF/Soybean WF/CB+VB WF/CB+JB RG/Soybean BO/Soybean Grassland
1997-1998 Bare soil WF/Maize WF/M+VB WF/M+JB FR/Maize RG+CV/Maize Grassland
1998-1999 Bare soil WF/Maize WF/M+VB WF/M+JB BO/Maize RG/Maize Grassland
1999-2000 Bare soil WF/Maize WF/M+VB WF/M+JB FR/Maize RG+CV/Maize Grassland
2000-2001 Bare soil WF/Maize WF/M+VB WF/M+JB FR/Maize RG+CV/Maize Grassland
2001-2002 Bare soil WF/Soybean WF/Soybean WF/Soybean FR/Soybean RG+CV/Soybean Grassland
2002-2003 Bare soil WF/Maize WF/M+VB WF/M+JB FR/Maize RG+CV/Maize Grassland
2003-2004 Bare soil WF/Soybean WF/Soybean WF/Soybean FR/Soybean RG+CV/Soybean Grassland
2004-2005 Bare soil WF/Maize WF/M+VB WF/M+JB FR/Maize RG+CV/Maize Grassland
2005-2006 Bare soil WF/Soybean WF/Soybean WF/Soybean FR/Soybean RG+CV/Soybean Grassland
2006-2007 Bare soil WF/Maize WF/M+VB WF/M+JB FR/Maize RG+CV/Maize Grassland
2007-2008 Bare soil WF/Soybean WF/Soybean WF/Soybean FR/Soybean RG+CV/Soybean Grassland
Table 1. Description of cropping systems used in a long-term soil erosion experiment
(1) Corresponding to the period from April of the first year to March of the following year. (2) BS: Bare soil; WF: Winter fallow;
Maize: Zea mays L.; GP: Grass Pea (Lathyrus sativus L.) Soybean: Glycine max (L.) Merrill; M+VB: Intercrop maize - velvet bean (Stizolobium cinereum Piper & Tracy); Sunflower+VB: Intercrop of Sunflower (Helianthus annuus L.) and Velvet Bean; CB+VB: Intercrop of Commom Bean (Phaseolus vulgaris L.) and Velvet Bean; M+JB Intercrop of Maize and Jack Bean (Canavalia ensiformis (L.) DC.); Sunflower+JB: Intercrop of Sunflower and Jack Bean; CB+JB: Intercrop of Commom Bean and Jack Bean; FR: Forage Radish (Raphanus sativus L.); BL: Blue Lupine (Lupinus angustifolius L.); RG: Ryegrass (Lolium multiflorum Lam.); BO: Black oat (Avena strigosa Schreb.); RG+CV: winter consortium ryegrass - common vetch (Vicia sativa
L.); BO+CV: winter consortium of Black Oat and Common Vetch.
differing from GL even in the first years after soil tillage.
Year(1) Rain erosivity Soil loss from treatment (2)
BS WF M+VB M+JB FR RG+CV GL
MJ mm ha-1 h-1 Mg ha-1
1992-1993 7,919 171.77 a 6.47 bA 1.83 bB 1.65 bB 1.87 bB 0.53 bB 0.18 bB
1993-1994 2,350 220.15 a 9.63 bA 1.42 bB 1.36 bB 1.20 bB 0.86 bB 0.07 bB
1994-1995 3,436 182.42 a 1.25 bNS 0.73 b 0.76 b 1.09 b 0.53 b 0.21 b
1995-1996 8,274 96.20 a 0.16 bNS 0.80 b 1.66 b 0.11 b 0.23 b 0.12 b
1996-1997 5,920 51.23 a 0.11 bNS 0.15 b 0.32 b 0.03 b 0.04 b 0.08 b
1997-1998 11,798 184.29 a 0.44 bNS 0.60 b 0.81 b 0.20 b 0.16 b 0.19 b
1998-1999 11,983 125.74 a 0.39 bNS 0.09 b 0.23 b 0.26 b 0.09 b 0.14 b
1999-2000 8,879 114.61 a 0.15 bNS 0.13 b 0.15 b 0.05 b 0.12 b 0.09 b
2000-2001 11,498 206.98 a 0.14 bNS 0.04 b 0.08 b 0.03 b 0.08 b 0.15 b
2001-2002 10,667 174.53 a 0.08 bNS 0.11 b 0.04 b 0.04 b 0.03 b 0.10 b
2002-2003 12,628 243.30 a 0.48 bNS 0.09 b 0.11 b 0.11 b 0.33 b 0.24 b
2003-2004 9,025 144.64 a 0.07 bNS 0.05 b 0.05 b 0.03 b 0.13 b 0.15 b
2004-2005 3,919 10.69 ns 0.02 NS 0.04 0.01 0.05 0.01 0.08
2005-2006 6,059 285.54 a 0.46 bNS 1.97 b 0.19 b 0.50 b 0.13 b 0.13 b
2006-2007 6,477 142.42 a 0.22 bNS 0.28 b 0.33 b 0.76 b 0.06 b 0.16 b
2007-2008 5,435 185.22 a 0.14 bNS 0.35 b 0.20 b 0.16 b 0.53 b 0.11 b
Sum 126,26 2,539.73 a 20.22 bA 8.67 bB 7.94 bB 6.48 bBC 3.84 bBC 2.21 bC
Table 2. Soil losses in a long-term experiment, comparing bare soil, grassland and cropping systems
(1) Corresponding to the period from April of the first year to March of the following year. (2) BS: bare soil; WF: winter fallow;
M+VB: intercrop maize - velvet bean; M+JB: summer consortium maize - jack bean; FR: forage radish; RG+CV: winter consortium ryegrass - common vetch; GL: grassland. Means followed by the same lowercase letter in the same year are not different by the LS means test (p<0.05) in the comparison among all treatments; means followed by the same uppercase letter in the same year are not different by the LS means test (p<0.05) in the comparison of treatments WF, M+VB, M+JB, FR, RG+CV, and GL; ns not
significant by the F test (p>0.05) in the comparison among all treatments; NS Not significant by the F test (p>0.05) in the
comparison of the treatments WF, M+VB, M+JB, FR, RG+CV, and GL.
temporal changes in soil erosion under different cropping systems.
Temporal changes in soil loss rates
Soil losses remained stable in the treatments BS and GL over the whole evaluation period, with annual soil erosion rates of 158.7 and 0.14 Mg ha-1 yr-1,
respectively (Figure 1). However, temporal analysis of soil losses from NT treatments showed a distinct pattern, of rapid decreases in the first years after soil tillage and stabilization thereafter, with very similar soil erosion rates to those in the GL treatment. The point of maximum curvature of the regressions adjusted to the soil loss data in NT treatments could be used as an indicator of how long soil tillage affected soil erosion in those treatments.
In all NT treatments, the point of maximum curvature of the regressions was close to the third year after soil tillage, with the exception of RG+CV, in which this point was closer to the second year after soil tillage. Up to three years were necessary for soil stabilization after tilling at treatment installation. The winter cover crops ryegrass and common vetch were efficient to accelerate soil stabilization and soil erosion control, even in the first two years after soil tillage, probably due to the quick growth and persistence of
ryegrass biomass, sustaining the conclusions of Schäfer et al. (2001) and Alves & Cabeda (1999).
Average soil erosion rates of the first three years (1992-1995) and the last 13 years (1995-2008), after soil stabilization, were statistically distinct for the treatments WF, M+VB, M+JB and FR (Table 3). No significant differences in soil erosion rates between the two periods were observed in the treatments BS, RG+CV and GL. In the period from 1992 to 1995, the soil erosion rates in NT treatments with summer or winter cover crops were similar, ranging from 0.63 to 1.32 Mg ha-1 yr-1, but
lower than in WF (5.78 Mg ha-1 yr-1) and higher
than in GL (0.15 Mg ha-1 yr-1), respectively. In the
period from 1995 to 2008, no significant differences in soil erosion rates were noticed between the treatments NT and GL.
These results suggest that after soil stabilization in the first two or three years after the last tillage operation, the NT system could control soil erosion with the same efficiency as grassland. Considering the average soil erosion rate in the BS treatment (158.7 Mg ha-1 yr-1), NT treatments could control 96.3
GL was 99.8 % and 99.9 % in relation to BS, respectively. Panachuki et al. (2011) found very low soil losses, higher water infiltration and lower water runoff under NT than CT.
Annual and total water runoff
Between April 1992 and March 2008, a total of 8,615 mm of water was lost from the BS treatment by surface runoff (Table 4). Total water runoff from this treatment was significantly higher than from all NT treatments and GL, ranging from 9 to 27 times higher than water losses in the WF and M+JB treatments, respectively. The annual water losses from BS ranged from 14 to 56 % of the annual precipitation in the period, and from 0.4 to 15.9 %, 0.2 to 16.8 %, and 0.4 to 2.8 %, respectively, in the GL, WF and other NT treatments.
For water runoff data, the approach of removing the BS treatment from the statistical analysis to increase the sensitivity of ANOVA and LS means tests to detect differences among NT and GL treatments was not effective since the sensitivity was not significantly higher than in the analysis including all treatments. There were significant differences in annual water runoff between NT and GL treatments in the first six years after the beginning of the experiment and for the total water runoff over the whole 1992-2008 period. Higher water runoff rates were recorded in GL in the period from 1992 to 1996. This result could be associated with the natural relief from soil compaction under GL due to the absence of machinery traffic on these plots after April 1992. Soil bulk density measured in the 0-0.16 m soil layer of the GL treatment in 1992 was 1.56 Mg m-3, and 1.42
Mg m-3 in the 0-0.15 m soil layer in 2008 (Lanzanova
et al., 2010). Higher annual water losses (> 100 mm) were also recorded in the WF treatment in the first three years after soil tillage, while in the other NT treatments annual water runoff never exceeded 54 mm. Total water losses (1992-2008) from GL (968 mm) were similar to those from the WF treatment (980 mm) but both results were higher than water runoff measured in the other NT treatments (320 to 435 mm for the M+JB and M+VB treatments, respectively).
Temporal changes in water runoff rates
No temporal changes in water runoff rates were detected in the BS treatment, which averaged 538.4 mm yr-1 or 32.2 % of the mean annual
rainfall (1,663 mm yr-1) in the period from 1992
to 2008 (Figure 2). However, water losses from the GL treatment differed considerably. Higher but decreasing water runoff rates were noticed in the first years after the beginning of the experiment and stabilization thereafter. An increase in water infiltration due to the improvement of soil physical quality should be the main mechanism that reduced water losses from GL (Bertol et al., 2004). A similar pattern was observed in the WF treatment. In this
Year(1) Treatment (2)
BS WF M+VB M+JB FR RG+CV GL
Soil loss rate(3)
Mg ha-1 year-1
1992-1995 191.44 ans 5.78 bxA 1.32 bxB 1.25 bxB 1.38 bxB 0.63 bnsB 0.15 bC
1995-2008 151.18 a 0.22 byNS 0.36 by 0.32 by 0.18 by 0.15 b 0.13 b
Mean 158.73 a 1.26 bA 0.54 bB 0.50 bB 0.41 bBC 0.24 bBC 0.14 bC
Water runoff(4)
mm year-1
1992-1995 580.3 ans 202.2 bxA 32.7 cnsC 29.6 cnsC 50.1 cxB 37.1 cnsC 195.7 bxA
1995-2008 528.8 a 28.7 byA 25.9 bAB 17.8 bB 14.9 byB 18.7 bB 29.3 byA
Mean 538.4 a 61.3 bA 27.2 cB 20.0 cB 21.6 cB 22.1 cB 60.5 bA
Table 3. Mean soil loss rate and water runoff in different periods in a long-term experiment, comparing bare soil, grassland and no-tillage cropping systems
(1) Corresponding to the period between April of the first year and March of the following year. (2) BS: bare soil; WF: winter fallow;
M+VB: intercrop maize - velvet bean; M+JB: summer consortium maize - jack bean; FR: forage radish; RG+CV: winter consortium ryegrass - common vetch; GL: grassland. (3) The periods of the treatments BS and GL were not compared since the regression
analysis (Figure 1) detected no significant changes of soil loss rate over the years. (4) The periods in treatments BS and M+VB were
not compared since no significant changes in water runoff rate over years were detected by regression analysis (Figure 2). Means followed by the same lowercase letter for the same period in the comparison among all treatments (a,b) or for the same treatment in the comparison of different periods (x,y) were not different by the LS means test (p<0.05). Means followed by the same uppercase letter for the same period are not different by the LS means test (p<0.05) in the comparison of treatments WF, M+VB, M+JB, FR, RG+CV, and GL. ns Not significant by the F test (p>0.05) in the comparison among periods at the same treatment; NS not
significant by the F test (p>0.05) in the comparison of the treatments WF, M+VB, M+JB, FR, RG+CV, and GL for the same period.
Year(1) Rain Water runoff from treatment
(2)
BS WF M+VB M+JB FR RG+CV GL
m m
1992-1993 1,719 443.4 a 215.6 cB 42.1 dC 32.5 dC 54.1 dC 32.9 dC 272.8 bA
1993-1994 1,719 519.4 a 289.7 bA 28.3 cD 26.6 cD 47.7 cC 25.7 cD 119.8 bB(3)
1994-1995 1,993 778.0 a 101.4 cB 27.7 eD 29.6 eCD 48.6 deCD 52.7 dC 195.0 bA
1995-1996 1,244 578.1 a 33.9 cB 29.6 cBC 36.5 cB 16.1 cC 25.7 cBC 90.6 bA
1996-1997 1,100 209.3 a 6.2 cdBC 16.8 bcA 15.0 bcdAB 5.1 dC 6.7 cdBC 18.5 bA
1997-1998 1,934 743.5 a 54.5 bA 44.8 bcAB 37.1 bcBC 15.9 cD 29.9 bcC 35.5 bcBC
1998-1999 1,536 476.9 a 48.1 bNS 19.2 b 18.3 b 16.0 b 23.7 b 22.7 b
1999-2000 1,458 431.0 a 10.3 bNS 24.1 b 11.3 b 9.8 b 9.7 b 6.1 b
2000-2001 2,046 759.1 a 21.7 bNS 20.4 b 21.0 b 14.3 b 22.7 b 29.1 b
2001-2002 1,805 743.9 a 45.3 bNS 23.4 b 16.9 b 19.3 b 21.7 b 36.0 b
2002-2003 2,898 1,060.9 a 87.9 bNS 51.5 b 28.8 b 43.9 b 45.7 b 45.1 b
2003-2004 1,452 512.3 a 30.5 bNS 33.2 b 17.6 b 16.6 b 28.9 b 24.0 b
2004-2005 925 129.9 a 2.3 bNS 7.7 b 2.9 b 3.0 b 2.5 b 3.7 b
2005-2006 1,860 410.3 a 6.1 bNS 26.5 b 8.9 b 14.8 b 8.4 b 24.1 b
2006-2007 1,447 367.0 a 18.7 bNS 21.3 b 8.1 b 11.3 b 6.6 b 28.9 b
2007-2008 1,476 452.4 a 7.9 bNS 18.5 b 9.1 b 8.6 b 10.6 b 16.9 b
Sum 26,612 8,615.4 a 980.3 bA 435.0 cB 320.1 cB 345.0 cB 354.0 cB 968.8 bA
(1) Corresponding to the period from April of the first year to March of the following year. (2) BS: bare soil; WF: winter fallow;
M+VB: intercrop maize - velvet bean; M+JB: summer consortium maize - jack bean; FR: forage radish; RG+CV: winter consortium ryegrass - common vetch; GL: grassland. (3) Water runoff in treatment GL was not measured in 1994, but estimated by
regression analysis (Figure 2). Means followed by the same lowercase letter of the same year are not different by the LS means test (p<0.05) in the comparison among all treatments. Means followed by the same uppercase letter for the same year are not different by the LS means test (p<0.05) in the comparison of treatments WF, M+VB, M+JB, FR, RG+CV, and GL. ns Not
significant by the F test (p>0.05) in the comparison among all treatments. NS Not significant by the F test (p>0.05) in the
comparison of treatments WF, M+VB, M+JB, FR, RG+CV, and GL.
case, the higher water losses in the first three years after soil tillage could be the result of soil surface crusting under deficient soil cover by crop residues in that treatment. Similar results were also related by Derpsch et al. (1991) and (Panachuki et al., 2011).
Maize and velvet bean (M+VB) treatment showed no changes in water runoff rates throughout the experiment. Water losses from this treatment were lower in the first three years after soil tillage, and similar thereafter to the water losses from GL. The treatment FR showed small water loss rates during the whole period which decreased in the first three years and then stagnated. However, the water runoff rates I the treatments M+JB and RG+CV decreased continuously from 1992 to 2008, though the water loss rates were very low at the beginning of the experiment.
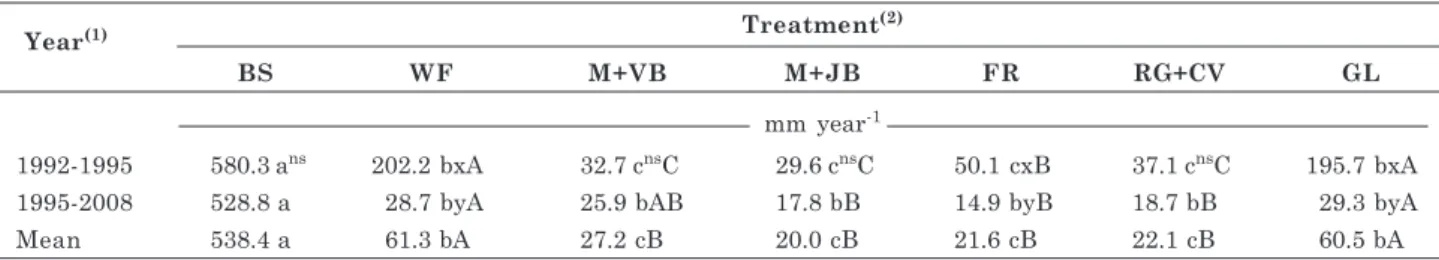
The average water runoff rates in the periods 1992-1995 and 1992-1995-2008 are shown in table 5. No statistically significant differences among periods were noticed for the treatments BS, M+VB, M+JB, and RG+CV, while water loss rates were higher in the period from 1992 to 1995 for the treatments WF, FR and GL. Water runoff after soil tillage was faster and more efficiently controlled in M+VB, M+JB and RG+CV than in the other NT treatments, since water loss rates in these treatments were significantly lower than in WF and FR in the period from 1992 to 1995. In the period from 1995 to 2008, water runoff rates in the treatments M+JV, FR and RG+CV were significantly lower than the rates in WF and GL, while M+VB had intermediary rates not differing from other treatments. The lower or similar water runoff rate in NT treatments than under GL could be associated with the higher soil macroporosity and roughness under NT than GL (Bertol et al., 2004; Luciano et al., 2009; Lanzanova et al., 2010).
CONCLUSIONS
1. Soil tillage promoted increases in soil erosion and water runoff and these effects remained significant for at least three years after the adoption of no-till system.
2. The use of winter or summer cover crops promoted faster soil stabilization and lower soil and water losses than winter fallow in the first years after soil tillage.
3. No tillage associated to cover crops promoted progressive soil stabilization and after three years, soil erosion was similar and water runoff was lower in comparison to the soil under grassland.
4. The use of winter or summer cover crops reduced soil erosion by 99.7 and 66.7 %, and water runoff by 96.8 and 71.8 %, compared to bare soil and winter fallow, respectively.
LITERATURE CITED
ALBUQUERQUE, J.; REINERT, D.J. & FIORIN, J.E. Variabilidade de solo e planta em Podzólico Vermelho-Amarelo. R. Bras. Ci. Solo, 20:151-157, 1996.
ALVES, A.G.C. & CABEDA, M.S.V. Infiltração de água em um Podzólico Vermelho-Escuro sob dois métodos de preparo, usando chuva simulada com duas intensidades. R. Bras. Ci. Solo, 23:753-761,1999.
AMARAL, A.J.; BERTOL, I.; COGO, N.P. & BARBOSA, F.T. Redução da erosão hídrica em três sistemas de manejo do solo em um Cambissolo Húmico da região do Planalto Sul-Catarinense. R. Bras. Ci. Solo, 32:2145-2155, 2008. BERTOL, I.; ALBUQUERQUE, J.A.; LEITE, D.; AMARAL, A.J.
& ZOLDAN JUNIOR, W.A. Propriedades físicas do solo sob preparo convencional e semeadura direta em rotação e sucessão de culturas, comparadas às do campo nativo. R. Bras. Ci. Solo, 28:155-163, 2004.
CABEDA, M.S.V. Computation of storm EI values. West Lafayette, Purdue University, 1976. 6p. (unpublished) CHOUDHARY, M.A.; LAL, R. & DICK, W.A. Long-term tillage
effects on runoff and soil erosion under simulated rainfall for a central Ohio soil. Soil Till. Res., 42:175-184, 1997. COGO, N.P.; LEVIEN, R. & SCHWARTZ, R.A. Perdas de solo
e água por erosão hídrica influenciadas por métodos de preparo, classes de declividade e níveis de fertilidade do solo. R. Bras. Ci. Solo, 27:743-753, 2003.
COMISSÃO DE QUÍMICA E FERTILIDADE DO SOLO -CQFSRS/SC. Manual de adubação e calagem para os Estados do Rio Grande do Sul e de Santa Catarina. 10.ed. Porto Alegre, SBCS/Núcleo Regional Sul/UFRGS, 2004. 400p.
DEBARBA, L. Sistemas de produção de milho adaptados à conservação do solo. Santa Maria, Universidade Federal de Santa Maria, 1993. 150p. (Dissertação de Mestrado)
Year(1) Treatment
(2)
BS WF M+VB M+JB FR RG+CV GL
mm year-1
1992-1995 580.3 ans 202.2 bxA 32.7 cnsC 29.6 cnsC 50.1 cxB 37.1 cnsC 195.7 bxA
1995-2008 528.8 a 28.7 byA 25.9 bAB 17.8 bB 14.9 byB 18.7 bB 29.3 byA
Mean 538.4 a 61.3 bA 27.2 cB 20.0 cB 21.6 cB 22.1 cB 60.5 bA
Table 5. Mean water runoff in different periods in a long-term experiment, comparing bare soil, grassland and no-tillage cropping systems
(1) Corresponding to the period between April of the first year and March of the following year. (2) BS: bare soil; WF: winter fallow;
M+VB: intercrop maize - velvet bean; M+JB: summer consortium maize - jack bean; FR: forage radish; RG+CV: winter consortium ryegrass - common vetch; GL: grassland. (3) The periods in treatments BS and M+VB were not compared since no significant
changes in water runoff rate over years were detected by regression analysis (Figure 2). Means followed by the same lowercase letter for the same period in the comparison among all treatments (a,b) or for the same treatment in the comparison of different periods (x,y) were not different by the LS means test (p<0.05). Means followed by the same uppercase letter for the same period are not different by the LS means test (p<0.05) in the comparison of treatments WF, M+VB, M+JB, FR, RG+CV, and GL. ns Not significant by the F test (p>0.05) in the comparison among periods at the same treatment; NS not significant by the F test (p>0.05)
in the comparison of the treatments WF, M+VB, M+JB, FR, RG+CV, and GL for the same period.
DERPSCH, R.; ROTH, C.H.; SIDIRAS, N. & KÖPKE, C.V. Controle da erosão no Paraná, Brasil: Sistemas de cobertura do solo, semeadura direto e preparo conservacionista do solo. Londrina, GTZ/IAPAR, 1991. 272p.
DUAN, X.; XIE, Y.; OU, T. & LU, H. Effects of soil erosion on long-term soil productivity in the black soil region of northeastern China. Catena, 87:268-275, 2011.
ESWARAN, H.; LAL, R. & REICH, P.F. Land degradation: An overview. In: BRIDGES, E.M.; HANNAM, I.D.; OLDEMAN, L.R.; PENING DE VRIES, F.W.T.; SCHERR, S.J. & SOMPATPANIT, S., eds. Responses to land degradation. In: INTERNATIONAL CONFERENCE ON LAND DEGRADATION AND DESERTIFICATION, 2., Khon Kaen, 2001. Proceeding… New Delhi, Oxford Press, 2001. FAETH, P. & CROSSON, P. Building the case for sustainable
agriculture. Environment, 36:16-20, 1994.
FOOD AND AGRICULTURE ORGANIZATION OF THE UNITED NATIONS - FAO. CA adoption worldwide. Available on: <http://www.fao.org/ag/ca/6c.html>. Accessed on: Nov. 18, 2011.
FOSTER, G.R.; McCOOL, D.K.; RENARD, K.G. & MOLDENHAUER, W.C. Conversion of the universal soil loss equation to SI metric units. J. Soil Water Conserv., 36:355-359, 1981.
GUADAGNIN, J.P.; BERTOL, I.; CASSOL, P.C. & AMARAL, A.J. Perdas de solo, água e nitrogênio por erosão hídrica em diferentes sistemas de manejo. R. Bras. Ci. Solo, 29:277-286, 2005.
LAL, R. Soil degradation by erosion. Land Degrad. Develop., 12:519-539, 2001.
LAL. R. Soil science and carbon civilization. Soil Sci. Soc. Am. J., 71:1425-1437, 2007.
LANZANOVA, M.E.; ELTZ, F.L.F.; NICOLOSO, R.S.; AMADO, T.J.C.; REINERT, D.J. & ROCHA, M.R. Atributos físicos de um Argissolo em sistemas de culturas de longa duração sob semeadura direta. R. Bras. Ci. Solo, 34:1333-1342, 2010. LUCIANO, R.V.; BERTOL, I.; BARBOSA, F.T.; VASQUEZ, E.V. & FABIAN, E.L. Perdas de água e solo por erosão hídrica em duas direções de semeadura de aveia e ervilhaca. R. Bras. Ci. Solo, 33:669-676, 2009.
NATURAL RESOURCES CONSERVATION SERVICE -NRCS. National Resources Inventory – Soil erosion on cropland. 2007. Available on: <http://www.nrcs.usda.gov/ Internet/ FSE_DOCUMENTS/nrcs143_012269.pdf>. Accessed on: Nov. 18, 2011.
OLIVEIRA, J.G.R.; RALISCH, R.; GUIMARAES, M.F.; BARBOSA, G.M. & TAVARES FILHO, J. Erosão no plantio direto: Perda de solo, água e nutrientes. Bol. Geogr., 30:91-98, 2012.
PANACHUKI, E.; BERTOL, I.; SOBRINHO, T.A.; OLIVEIRA, P.T.S. & RODRIGUES, D.B.B. Perdas de solo e de água e infiltração de água em Latossolo Vermelho sob sistemas de manejo. R. Bras. Ci. Solo, 35:1777-1785, 2011. PIMENTEL, D. Soil erosion: A food and environmental threat.
Environ. Develop. Sust., 8:119-137, 2006.
REICHERT, J.M. & CABEDA, M.S.V. Salpico de partículas e selamento superficial em solos do Rio Grande do Sul. R. Bras. Ci. Solo, 16:389-396, 1992.
SAS Institute. SAS/GRAPH Software: Reference. Version 8, Cary, 2002. v.2.
SEGANFREDO, M.L.; ELTZ, F.L.F. & BRUM, A.C.R. Perdas de solo, água e nutrientes por erosão em sistemas de culturas em semeadura direto. R. Bras. Ci. Solo, 21:287-291,1997. SCHÄFER, M.J.; REICHERT, J.M.; CASSOL, E.A.; ELTZ, F.L.F.
& REINERT, D.J. Erosão em sulcos em diferentes preparos e estados de consolidação do solo. R. Bras. Ci. Solo, 25:419-430, 2001.
SCHICK, J.; BERTOL, I.; BALBINOT JR, A.A. & BATISTELA, O. Erosão hídrica em Cambissolo Húmico alumínico submetido a diferentes sistemas de preparo e cultivo do solo: II. Perdas de nutrientes e carbono orgânico. R. Bras. Ci. Solo, 24:437-447, 2000a.
SCHICK, J.; BERTOL, I.; BATISTELA, O. & BALBINOT JR, A.A. Erosão hídrica em Cambissolo Húmico alumínico submetido a diferentes sistemas de preparo e cultivo do solo: I. Perdas de solo e água. R. Bras. Ci. Solo, 24:427-436, 2000b.
SCHULLER, P.; WALLING, D.E.; SEPÚLVEDA, A.; CASTILLO, A. & PINO, I. Changes in soil erosion associated with the shift from conventional tillage to a no-tillage system, documented using 137Cs
measurements. Soil Till. Res., 94:193-192, 2007. STRUDLEY, M.W.; GREEN, T.R. & ASCOUGH II, J.C. Tillage
effects on soil hydraulic properties in space and time: State of the science. Soil Till. Res., 99:4-48, 2008. TILMAN, D.; FARGIONE, J.; WOLFF, B.; D’ANTONNIO, C.;
DOBSON, A.; HOWARTH, R.; SCHINDLER, D.; SCHLESINGER, W.H.; SIMBERLOFF, D. & SWACKHAMER, D. Forecasting agriculturally driven environmental change. Science, 292:281-284, 2001. TRIPLETT, G.B. & DICK, W.A. No-tillage crop production: A
revolution in agriculture! Agron. J., 100:S153-S165, 2008. USDA - Soil Survey Staff. Soil Taxonomy - a basic system of soil classification for making and interpreting soil surveys. 2.ed. Washington, 1999. 871p.
VEIGA, M. & WILDNER, L.P. Manual para la instalación y la conducción de experimento de pérdida de suelos. Santiago, FAO, 1993. (Documento de Campo, 1) WISCHMEIER, W.H. & SMITH, D.D. Predicting rainfall