Trace mineral requirements for growth of Moxotó goats grazing in the
semiarid region of Brazil
Marcos Jácome de Araújo1*, Ariosvaldo Nunes de Medeiros2, Izabelle Auxiliadora Molina de Almeida Teixeira3, Roberto Germano Costa4, Carlo Aldrovandi Torreão Marques1, Kléber
Tomás de Resende3, Gabriel Maurício Peruca de Melo5 1 Universidade Federal do Piauí, Departamento de Zootecnia, Bom Jesus, PI, Brazil.
2 Universidade Federal da Paraíba, Departamento de Zootecnia, Areia, PB, Brazil.
3 Universidade Estadual Paulista, Faculdade de Ciências Agrárias e Veterinárias, Departamento de Zootecnia, Jaboticabal, SP, Brazil. 4 Universidade Federal da Paraíba, Departamento de Agropecuária, Bananeiras, PB, Brazil.
5 Universidade Camilo Castelo Branco, Descalvado, SP, Brazil.
ABSTRACT - A comparative slaughter trial was conducted to estimate the body composition and net requirements of Cu, Zn, Mn, Fe, and Co for growth of castrated Moxotó goat kids, with15.69±0.78 kg initial body weight (BW), grazing in the semiarid region of Brazil. The baseline group consisted of four randomly selected kids (15.37±0.30 kg BW). Thirty-two kids were randomly allocated into eight groups (considered as block), distributed among four levels of concentrate supplementation (0, 0.5, 1.0, and 1.5% BW). Animals in a group were slaughtered when the 1.5% BW treatment kids in the group reached approximately 25 kg BW. The trace element content (mg/kg of empty body weight) ranged from 23.68 to 27.81 mg Zn, 35.70 to 47.29 mg Fe, 0.86 to 1.09 mg Mn, 1.45 to 1.75 mg Cu, and 0.83 to 0.87 mg Co for Moxotó kids at 15 and 25 kg BW, respectively. The net requirements (mg/kg of empty body weight gain) ranged from 30.43 to 35.74 mg Zn, 53.48 to 70.84 mg Fe, 1.22 to 1.54 mg Mn, 1.93 to 2.32 mg Cu, and 0.91 to 0.95 mg Co for animals with BW ranging from 15 to 25 kg, respectively. Indigenous goats grazing in the semiarid region of Brazil have different requirements from those values recommended by international committees for dairy and meat goats.
Key Words: Caatinga, factorial method, micro mineral, zinc
© 2017 Sociedade Brasileira de Zootecnia ISSN 1806-9290
www.sbz.org.br
R. Bras. Zootec., 46(3):231-239, 2017
Received: April 16, 2016
Accepted: November 6, 2016
*Corresponding author: jacome@ufpi.edu.br http://dx.doi.org/10.1590/S1806-92902017000300008
How to cite: Araújo, M. J.; Medeiros, A. N.; Teixeira, I. A. M. A.; Costa, R. G.; Marques, C. A. T.; Resende, K. T. and Melo, G. M. P. 2017. Trace mineral requirements for growth of Moxotó goats grazing in the semiarid region of Brazil. Revista Brasileira de Zootecnia 46(3):231-239.
Copyright © 2017 Sociedade Brasileira de Zootecnia. This is an Open Access article distributed under the terms of the Creative Commons Attribution License (http://creativecommons.org/licenses/by/4.0/), which permits unrestricted use, distribution, and reproduction in any medium, provided the original work is properly cited.
Introduction
Trace elements play an important role in maintaining normal cell metabolism in animals and inappropriate provision of any of the trace elements may damage the health and productivity of the animal. Pathologies, such as anemia, may indicate a deficiency in Fe, Cu, and Co, but they may also indicate a manifestation of Mo, Se, and Zn toxicity. Resistance to infection is influenced by Cu, Fe, Se, and Zn, and skeletal deformities occur as a consequence of the lack of Cu, Mn, Zn, Ca, and P. Moreover, deficiencies in Cu, Mn, Zn, I, and Se affect animal reproduction (Underwood and Suttle, 1999). The available method to
prevent trace mineral deficiency of animals is by adding mineral supplements (Suttle, 2010); so accurate estimates of trace mineral requirement is necessary in the prevention of trace mineral disorders.
Due to the lack of specific methodologies that may provide more accurate results, some scientific committees and authors have suggested recommendations for animal needs in trace elements, including a safety margin for its values to assure that needs of animals are properly assisted and to avoid signs of deficiency. Thus, the requirements for some trace elements for goats have been obtained from feeding trials and/or adapted from values obtained from dairy cattle, although adjustments have been made based on other estimates and available data on goats (NRC, 2007).
The estimation of the trace element requirements demands exact knowledge of trace element deposition in the body (Bellof and Pallauf, 2007). Thus, an accurate technique with direct measurement, as comparative slaughter, has recently been used in trials to estimate the trace element requirements for sheep (Ji et al., 2014; Zhang et al., 2015). Therefore, the present study was performed to determine the trace element (Zn, Fe, Cu, Mg, and Co) requirements for growth of Moxotó goat kids grazing in the semiarid region of Brazil using the comparative slaughter technique.
Material and Methods
The study was conducted in the municipality of São João do Cariri (7o29'34" S and 36o41'53" W), Paraiba
State, Brazil. The climate is Bsh type, which is classified as hot semiarid according to the Koopen classification, and vegetation is typical of Caatinga. The average maximum temperature during the experimental period was 31.45 °C and the average minimum temperature was 20.11 °C. The relative humidity was 61.2% and there was 44.26 mm of rainfall. Humane animal care and handling procedures were followed according to the local animal care committee.
Thirty-six castrated Moxotó kids with an average initial body weight (BW) of 15.69±0.78 kg at approximately four months of age were used in this study. Four animals were slaughtered at the beginning of the experiment with 15.37±0.30 kg of BW representing the initial body composition (baseline group). Thirty-two kids were randomly allocated to four supplementation levels: 0, 0.5, 1.0, and 1.5% BW. Kids were pair-fed in eight slaughter groups (considered as blocks). A slaughter group consisted of one kid from each treatment and when the animal fed for 1.5% BW in each slaughter group reached 25 kg of BW, it was slaughted along with the other goat kids from the same group (goat kids fed 0, 0.5, and 1.0% BW).
The animals had access to native pasture from 07.00 to 16.00 h. After this time, the animals were put in a pen equipped with individual stalls (2.0 × 1.0 m) that did not have coverage but had a ground floor to receive the supplementation. The animals had free access to drinking water and the collective fountains were located at the management center. The experimental concentrate was the same for all treatments, varying only the amount offered to the animals once a day (16.00 h). The feed refusals were weighed, recorded, and sampled in the morning of the next day. The experimental concentrate ingredients were calculated according to the NRC (1981) to allow a growth rate of 150 g/day for the animals with 1.5% BW supplementation level (Table 1). To control the growth and adjust the concentrate supply, the animals were weighed weekly before feeding using a scale with a precision of 0.1 kg. The experimental area was composed of two paddocks of approximately 8 ha each.
In addition to the nutritional requirement assessment, a trial to estimate the dry matter intake (DMI) of the animals on pasture was conducted. Eight animals, with an average of 25.83±4.48 kg BW, cannulated in the esophagus, were used, in a Latin square design (four goats × four periods) with simultaneous repetitions, receiving the same feeding supplementation levels as animals from the requirement test. This trial was carried out to develop a model (equation) to estimate the DMI of the animals from nutritional requirement trial.
The extrusa collection was held for eight consecutive days, in alternating shifts, forming four full collection days for each animal (four mornings and four afternoons). In the morning, the cannulas were removed and coupled to the extrusa collecting bags, which were made of synthetic leather with a bottom of nylon mesh to reduce the excess of saliva. Then, the animals were driven back to the management center for the removal of bags and placement of cannulas and then they were released into their paddocks.
Ingredient (g/ kg of DM)Composition
Chemical analysis g/ kg of DM
GE mg/kg of DM
DM CP Copper Zinc Iron Manganese Cobalt
Corn meal1 580 870.6 93.9 4.68 0.33 61.22 28.03 14.63 1.37
Soybean meal 270 866.4 458.3 4.51 0.67 54.21 44.96 24.97 1.70
Wheat meal 50 888.8 150.8 4.26 1.16 93.72 57.36 107.92 1.52
Cotton meal 50 866.8 336.0 4.13 0.61 36.15 6.57 8.88 1.85
Limestone 10 - - - 0.82 16.05 1218.69 44.04 17.68
Premix 40 - - - 86.30 1429.55 3078.79 809.85 64.75
Total 1000 875.8 202.5 4.35 3.92 113.98 166.93 53.90 4.19
Extrusa - 231.0 118.7 3.48 8.28 51.56 172.36 81.84 3.94
DM - dry matter; CP - crude protein; GE - gross energy (Mcal/kg of DM) 1 Byproduct from manufacture of corn flakes.
For the afternoon collection, the animals were removed from the pasture 4 h before sampling to avoid regurgitation and contamination of the experimental samples; then, the same procedures as those of the morning collection were performed. The extrusa samples were made considering the experimental period and the animal.
The pasture DMI was estimated through the total feces excretion and dry matter digestibility of diet (Equation 1): DMI = [(100 × Fecal excretion, kg DM/day) / (100 – DM digestibility of extrusa)] (1)
The total feces collection was performed using collecting bags attached to animals, which were collected in the early morning (07.00 h) and late afternoon (05.00 h). After homogenization of the material from each bag, aliquots of 20% of total excreted for 24 h were removed for the formation of samples per animal and period, which were wrapped in plastic bags properly identified and stored at –10 °C.
After the experimental period, samples were thawed, weighed, and dried in a forced-ventilation oven at 55 °C for 72 h and ground through a 1-mm screen using a Wiley mill (Arthur H. Thomas Co., Philadelphia, PA). The determination of the in vitro DM digestibility was held on artificial rumen (DAYSE II; ANKON Technology Coorp., Fairport, NY) based on methodology adapted from Tilley and Terry et al. (1963). The DMI values (BW, kg0.75) of fistulated animals were then decreased with the
supplementation levels (SL = 0, 0.5, 1.0, and 1.5% BW) and from the regression equation (DMI, g/kg0.75 BW = 0.0677 +
0.0086SL – 0.0141SL2), average values of 67.7, 68.5, 62.2,
and 48.9 g/kg0.75 BW were found per day for levels of 0, 0.5,
1.0, and 1.5%, respectively. These values were then used to estimate the DMI of animals from the nutritional requirement experiment. The total DMI was equal to the sum of the DMI of the pasture plus the DMI of the concentrate.
Body weights were measured immediately before feed and water were withdrawn for 16 h. Shrunk BW was measured immediately before slaughter and after feed and water were withdrawn for 16 h. At slaughter, the kids were stunned through cerebral concussion and killed by exsanguination using conventional humane procedures. The blood was weighed and sampled. The body was separated into individual components, which were then weighed separately. The individual components were as follows: internal organs (liver, heart, lungs, trachea, tongue, kidneys, and spleen), emptied and cleaned digestive tract (rumen, reticulum, omasum, abomasum, small intestines, and large intestines), hide, head, feet, and carcass. The digestive tract was weighed before and after emptying and flushing with water. All body components were initially
frozen at –6 °C. The components were then cut into small pieces, ground with a large screw grinder through a plate with 0.32-cm holes, and mixed by two additional passes through the grinder. After grinding and homogenization, the samples were collected, frozen again, and dried for DM determination. Empty body weight (EBW) was computed as shrunk BW at slaughter minus digestive tract contents. Because the sum of fat, protein, water, and ash content of the empty body did not add up to the observed EBW, the components were proportionally scaled to match the observed EBW.
The ingredients of the diet and extrusa were analyzed for DM (AOAC, 1990; method no. 930.15), and crude protein (AOAC, 1990; method no. 984.13). The gross energy was determined by a Parr adiabatic calorimetric bomb. The determination of the in vitro DM digestibility was performed on artificial rumen (DAYSE II; ANKON Technology Corp., Fairport, NY) based on methodology adapted from Tilley and Terry (1963).
The analyses for the determination of minerals in the concentrate ingredient samples, extrusa, and defatted samples were conducted by means of acid digestion (Mahanti and Barnes, 1983). For the digestion of samples, a mixture of nitric acid (HNO3) with hydrochloric acid
(HCl) and hydrogen peroxide (H2O2) was used to obtain
a mineral solution. This extract was used to obtain dilutions to determine the different trace elements and the readings were performed through atomic absorption spectrophotometry.
The samples of each animal were thawed, dried in an air-circulation oven at 55 °C, and ground in a blender. After this procedure, the samples were defatted by extraction in ether in a Soxhlet apparatus (AOAC, 1990; method no. 920.39). After extraction with ether, the samples were ground in a ball mill and stored in closed containers. The DM contents (fatted) were determined in an oven at 105 °C up to constant weight, and the ash, crude protein, and trace minerals were determined as mentioned for the ingredients of the experimental concentrate on fat-free samples.
The initial EBW of animals slaughtered at the end of the trial was estimated from the regression equation developed from the baseline animals (Equation 2). By Subtracting the initial EBW from the final EBW, the empty body weight gain (EBWG) was estimated.
Initial EBW, kg = 0.5098 (±25.95) + [0.5757 (±1.68) × initial BW, kg] (2)
direct chemical analyses of the whole empty body. The factorial approach was used to estimate trace requirements for growth. Linear regression analyses were conducted to express EBW as a function of BW. The trace element content of animals was summarized by allometric regressions of the logarithm of observed mineral content on the logarithm of empty body weight equation (3).
Log10 y = a + b × log10 EBW, (3)
in which Log10 y = log of the total amount of trace element
in the EBW (mg); Log10 EBW = the log of EBW (in kg);
and a and b = regression parameters. The equation 3 was differentiated based on the EBW to compute estimates of the composition of the gain at various EBW (Equation 4):
y’ = b × 10a × EBW(b−1), (4)
in which y’= nutrient per unit of empty weight gain (in mg/kg of gain); EBW is expressed in kilograms; and
a and b = coefficients determined from a linear regression (Equation 3). To estimate the net trace element requirements for BW gain, the values of body composition of gain were divided by the BW to EBW ratio factor.
The goat kids were distributed at random in a randomized block (slaughter groups) design (eight blocks) and each block contained one animal for each level of supplementation (0, 0.5, 1.0, and 1.5%). The data of DMI, body composition, average daily gain (ADG), and EBW were analyzed using a mixed model with the fixed effects of supplementation level (degree freedom = 3), random effect of slaughter groups (degree freedom = 7), and random residual error using PROC MIXED of SAS (Statistical Analysis System, version 9.0). Polynomial contrast test was performed to analyze linear and quadratic effects using the CONTRAST option of the MIXED procedure. Significance was declared at P<0.05.
The mathematical model was as follows: Yij = µ + αi + bj + eij,
in which Yij = expected outcome for the dependent variable; µ = overall mean; αi = effect fixed of the i-th supplementation level (i = 0, 0.5, 1.0, and 1.5% BW); bj = random effect of the j-th block (slaughter groups;
j = 1, 2…8); and eij = random error associated with each observation.
Linear regression analyses to estimate the growth requirements were adjusted using the PROC REG of SAS. The following model was employed:
Y = α + bx + e,
in which Y = expected response (Log10 of amount of trace
element in the EBW); α = the y-intercept; b = slope of the regression line; x = independent variable (Log10 of EBW); and e = the standard error of parameter estimate. Residuals plotted against the predicted values were used to
check the assumptions of the model for homoscedasticity, independency, and normality of the errors. A data point was deemed to be an outlier and removed from the database if the studentized residual was outside the ±2.5 range values.
Results
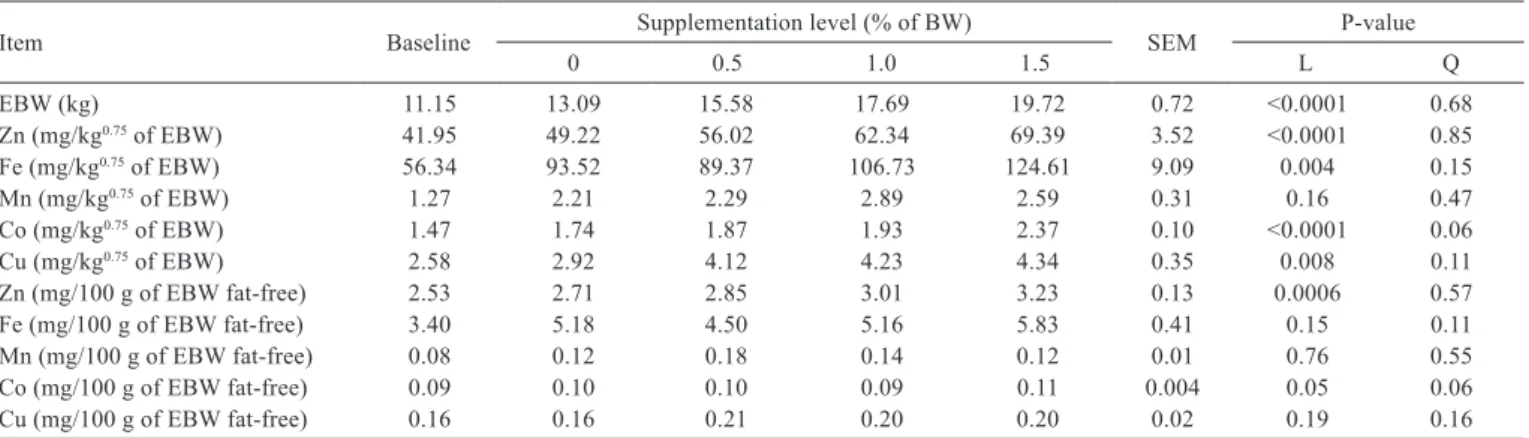
Empty body weight, ADG, EBWG, and DMI increased as supplementation level increased (P<0.0001) (Table 2). A linear positive effect was observed for the proportions of fat, protein, and zinc, while the proportions of water in the empty body decreased linearly in response to the increasing supplementation levels. The proportions of ash, Fe, Mn, Cu, and Co were not influenced by the increasing levels of supplementation (Table 2). On the other hand, when the Zn, Fe, Cu, and Co contents were expressed based on the metabolic weight (mg/kg0.75 of EBW) (Table 3), a linear
increase was observed in response to the increased level of supplementation. As expected, the trace element content on an EBW fat-free basis, independent of the treatment, was more significant than the mineral content before the removal of the fat (Table 3).
The body composition of Zn, Fe, Mn, Cu, and Co in the empty body of Moxotó goats was estimated according to the EBW (Table 4). Increases of 14.85, 24.5, 21.1, 17.14, and 4.65% in the Zn, Fe, Mn, Cu, and Co concentrations, respectively, were found when the BW varied from 15 to 25 kg (Table 4). The contents of trace elements varied from 23.68 to 27.81 mg of Zn, 35.70 to 47.29 mg of Fe, 0.86 to 1.09 mg of Mn, 1.45 to 1.75 mg of Cu, and 0.83 to 0.87 mg of Co per kg of EBW for animals with BW varying from 15 to 25 kg, respectively (Table 4).
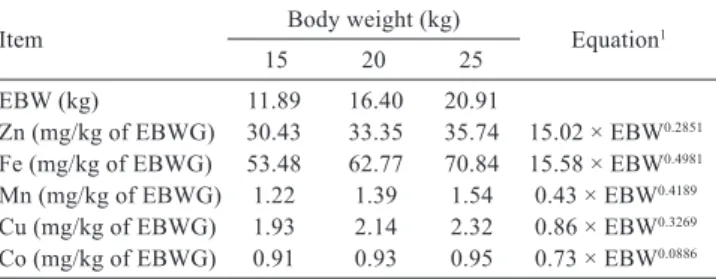
By deriving the logarithm regression equations of the body content for Zn, Fe, Mn, Cu, and Co according to the EBW logarithm, the prediction equations for these elements per kg of EBWG were obtained (Table 5). Subsequently, the trace element quantities (mg/kg of EBWG) for different weight ranges were determined. The trace element deposition in EBWG followed the same concentration pattern as in EBW (Table 4). The contents of trace elements per EBWG correspond to the respective net requirements for 1 kg of EBWG. Such requirements varied from 30.43 to 35.74 mg of Zn, 53.48 to 70.84 mg of Fe, 1.22 to 1.54 mg of Mn, 1.93 to 2.32 mg of Cu, and 0.91 to 0.95 mg of Co per kg of EBWG for animals with BW varying from 15 to 25 kg, respectively (Table 5).
Table 2 - Performance and final body composition (fat, protein, water, ash, Zn, Fe, Mn, Co, and Cu) of Moxotó goat kids at baseline and fed different supplementation levels
Item Baseline Supplementation level (% of BW) SEM P-value
0 0.5 1.0 1.5 L Q
Number of kids 4 7 8 8 8 - -
-Days on feed - 150 150 150 150 - -
-Initial BW (kg) 15.38 15.76 15.73 15.71 15.73 - -
-Final BW (kg) 15.38 18.40 21.04 22.94 25.69 0.93 <0.0001 0.89
SBW (kg) 13.91 16.82 19.44 21.25 23.42 0.81 <0.0001 0.73
EBW (kg) 11.15 13.09 15.58 17.69 19.72 0.72 <0.0001 0.68
ADG (g/d) - 15.74 34.29 49.56 69.83 5.80 <0.0001 0.82
EBWG (g/d) - 10.49 27.09 43.16 58.57 4.47 <0.0001 0.91
DMI (g/d) - 569.67 703.73 772.34 789.80 14.12 <0.0001 <0.0001
Fat (g/kg of EBW) 68.12 74.97 96.21 107.37 145.26 10.04 <0.0001 0.24
Protein (g/kg of EBW) 154.44 154.71 162.54 165.22 169.56 4.08 0.001 0.56
Water (g/kg of EBW) 709.63 705.32 674.25 655.66 631.95 11.80 <0.0001 0.72
Ash (g/kg of EBW) 45.32 45.41 44.95 46.02 44.56 1.66 0.85 0.77
Zn (mg/100 g of EBW) 2.30 2.45 2.51 2.61 2.73 0.10 0.03 0.61
Fe (mg/100 g of EBW) 3.80 4.68 3.96 4.48 4.90 0.34 0.43 0.11
Mn (mg/100 g of EBW) 0.07 0.11 0.10 0.12 0.10 0.01 0.91 0.53
Co (mg/100 g of EBW) 0.08 0.09 0.08 0.08 0.09 0.004 0.36 0.06
Cu (mg/100 g of EBW) 0.14 0.15 0.19 0.18 0.17 0.02 0.42 0.14
BW - body weight; SBW - shrunk body weight; EBW - empty body weight; ADG - average daily gain; EBWG - empty body weight gain; DMI - dry matter intake; SEM - standard error of mean; L - linear; Q - quadratic.
Regression analysis was made only among supplementation levels (Y = α + βx + ε).
Table 3 - Final body content of trace minerals (Zn, Fe, Mn, Co, and Cu) of Moxotó goat kids at baseline and fed different supplementation levels
Item Baseline Supplementation level (% of BW) SEM P-value
0 0.5 1.0 1.5 L Q
EBW (kg) 11.15 13.09 15.58 17.69 19.72 0.72 <0.0001 0.68
Zn (mg/kg0.75 of EBW) 41.95 49.22 56.02 62.34 69.39 3.52 <0.0001 0.85
Fe (mg/kg0.75 of EBW) 56.34 93.52 89.37 106.73 124.61 9.09 0.004 0.15
Mn (mg/kg0.75 of EBW) 1.27 2.21 2.29 2.89 2.59 0.31 0.16 0.47
Co (mg/kg0.75 of EBW) 1.47 1.74 1.87 1.93 2.37 0.10 <0.0001 0.06
Cu (mg/kg0.75 of EBW) 2.58 2.92 4.12 4.23 4.34 0.35 0.008 0.11
Zn (mg/100 g of EBW fat-free) 2.53 2.71 2.85 3.01 3.23 0.13 0.0006 0.57
Fe (mg/100 g of EBW fat-free) 3.40 5.18 4.50 5.16 5.83 0.41 0.15 0.11
Mn (mg/100 g of EBW fat-free) 0.08 0.12 0.18 0.14 0.12 0.01 0.76 0.55
Co (mg/100 g of EBW fat-free) 0.09 0.10 0.10 0.09 0.11 0.004 0.05 0.06
Cu (mg/100 g of EBW fat-free) 0.16 0.16 0.21 0.20 0.20 0.02 0.19 0.16
BW - body weight; EBW - empty body weight; SEM - standard error of mean; L - linear; Q - quadratic. Regression analysis was made only among supplementation levels (Y = α + βx + ε).
Item Regression equation R2 RMSE P-value Body weight
1 (kg)
15 20 25
EBW (kg) EBW = –1.6334 ( ±0.53) + [0.9017 (±0.02) × SBW] 0.97 0.50 <0.0001 11.89 16.40 20.91 Zn (mg/kg of EBW) Log10 Zn = 1.0678 (±0.09) + [1.2852 (±0.07) × log10 EBW] 0.92 0.03 <0.0001 23.68 25.95 27.81 Fe (mg/kg of EBW) Log10 Fe = 1.0171 (±0.23) + [1.4981 (±0.19) × log10 EBW] 0.69 0.09 <0.0001 35.70 41.90 47.29 Mn (mg/kg of EBW) Log10 Mn = –0.5166 (±0.34) + [1.4189 (±0.28) × log10 EBW] 0.46 0.14 <0.0001 0.86 0.98 1.09 Cu (mg/kg of EBW) Log10 Cu = –0.1894 (±0.29) + [1.3269 (±0.24) × log10 EBW] 0.50 0.12 <0.0001 1.45 1.61 1.75 Co (mg/kg of EBW) Log10 Co = –0.1754 (±0.13) + [1.0885 (±0.10) × log10 EBW] 0.79 0.05 <0.0001 0.83 0.86 0.87 Table 4 - Allometric equations to estimate the body composition in trace elements (Zn, Fe, Mn, Cu, and Co) of Moxotó goats fed different
supplementation levels
SBW - shrunk body weight; EBW - empty body weight; RMSE - root mean square error; R2 - coefficient of determination.
that were determined by the BW:EBW ratio, which were calculated as 1.26, 1.22, and 1.20 and corresponded to animals with BW of 15, 20, and 25 kg BW, respectively. Our findings indicate that the net requirement for weight gain ranged from 24.15 (30.43/1.26) to 29.78 (35.74/1.20) mg of Zn, 42.44 (53.48/1.26) to 59.03 (70.84/1.20) mg of Fe, 0.97 (1.22/1.26) to 1.28 (1.54/1.20) mg of Mn, 1.53 (1.93/1.26) to 1.93 (2.32/1.20) mg of Cu, and 0.72 (0.91/1.26) to 0.79 (0.95/1.20) mg of Co per kg of BW gain when the BW ranged from 15 to 25 kg, respectively.
Discussion
A positive contribution of concentrate supplementation to growth performance and body composition of grazing goats was demonstrated in this study. Similar results were reported by Silva et al. (2013), who showed that the EBW, EBWG, and trace element content of Canindé goats with BW varying from 15 to 25 kg increased as feed intake level increased. In this study, we found that when the Zn, Fe, Cu, and Co contents were expressed based on the metabolic weight (mg/kg0.75 of EBW) (Table 3), a
linear increase was observed in response to the increased level of supplementation. This concentration pattern may have been a reflection of the increased mineral intake and weight gain, which led to a better body development of the animals as the increase in BW has been noted as one of the main discriminating factors in body composition (Mahgoub and Lu, 1998; Bellof and Pallauf, 2007; Fernandes et al., 2007; Araújo et al., 2010; Fernandes et al., 2012; Teixeira et al., 2013).
Silva et al. (2013) observed that trace element concentrations in the empty body of Canindé goats increased as feed intake levels increased. In lambs, Bellof and Pallauf (2007) observed a similar concentration pattern to the one presented in this study, reporting that the concentration of Zn and Mn increased during the growing period and there
was a decrease in the concentration of Fe and Cu as BW increased. On the other hand, Zang et al. (2015) found that for each gender (males and females) of Dorper × Hu crossbred lambs, Fe, Mn, Cu, and Zn concentrations slightly decreased as BW increased, except for zinc concentration in males.
Data on trace elements in body compositions are scarce and conflicting. In the literature, however, there are some data on the deposition of trace elements in specific organs and tissues. Among these reports, Suttle (1979) found that mean concentrations of manganese for groups of lamb carcasses (18 to 69 kg BW) fell within the ranges 0.7-1.2 mg/kg fresh carcass weight, respectively. Years later, Grace (1983) reported that the concentration of manganese varied from 0.5 to 3.9 mg/kg of DM in the carcasses of sheep and cattle. In adult sheep, the concentration of manganese is elevated in the liver (4.2 mg/kg of DM), followed by the pancreas (1.7 mg/kg of DM) and kidneys (1.2 mg/kg of DM) and the concentration is less than 0.3 mg/kg of DM in other tissues. Haenlein and Anke (2011) verified increased amounts of manganese in the liver (10.1 mg/kg of DM), ribs (9.7 mg/kg of DM) and pancreas (7.0 mg/kg of DM) of goats fed normal amounts of this element. In the present study, the concentrations of manganese in the empty body varied from 0.25 to 0.40 mg/kg of DM when the BW varied from 15 to 25 kg, respectively.
The liver is one of the main organs for copper storage (200 to 300 mg/kg of DM). The concentration of copper in the carcass is relatively low with values of 1.2 mg/kg fresh weight in sheep and 0.8 mg/kg fresh weight in cattle (Grace, 1983). In the present study, copper values of 1.45 and 1.75 mg/kg of EBW were found in animals with BW varying from 15 to 25 kg, respectively, which were different from the values reported for sheep and cattle. These results may indicate divergences in the nutritional requirements between these species. Zhang et al. (2015), reported that Fe, Mn, and Cu concentrations in Dorper × Hu lambs were greater in viscera (blood included) and zinc concentration was higher in fleece than other body tissues and that viscera tissue had more than 56, 60, and 71% of the total Fe, Mn, and Cu, respectively, in the empty body. The main pool of zinc was the tissues of bone and muscle, which had more than 32 and 36% of the total zinc, respectively, in the empty body.
Studies have also demonstrated that the retention of trace elements (mg/kg of EBWG) is influenced by the nutrition plan, sex, and final body weight (Bellof and Pallauf, 2007; Ji, et al., 2014; Silva et al., 2013; Zhang et al., 2015). Ji et al. (2014) observed that concentrations of zinc ranged from 29 to 30 mg/kg EBWG for ram lambs and 29 to 28 mg/kg EBW for ewe lambs, which were slightly
Item Body weight (kg) Equation1
15 20 25
EBW (kg) 11.89 16.40 20.91
Zn (mg/kg of EBWG) 30.43 33.35 35.74 15.02 × EBW0.2851 Fe (mg/kg of EBWG) 53.48 62.77 70.84 15.58 × EBW0.4981 Mn (mg/kg of EBWG) 1.22 1.39 1.54 0.43 × EBW0.4189 Cu (mg/kg of EBWG) 1.93 2.14 2.32 0.86 × EBW0.3269 Co (mg/kg of EBWG) 0.91 0.93 0.95 0.73 × EBW0.0886 BW - body weight; EBW - empty BW; EBWG - empty body weight gain. 1 Component concentration, b × 10a × EBW(b−1), in which constants a and b were
determined from the equations in Table 4.
lower than our findings. Bellof and Pallauf (2007), working with German Merino Land sheep, reported an average of 26.1 mg Fe, 1.04 mg Mn, 1.41 mg Cu, and 30.0 mg Zn/kg of EBWG for the animals with body weight varying from 18 to 55 kg, respectively. Silva et al. (2013) observed that trace contents in Canindé goats ranged between 13.96 and 14.20 mg for Fe, 9.56 and 10.26 mg for Zn, 6.37 and 6.38 mg for Mn, and 5.86 and 7.90 mg/kg of EBWG, respectively, for animals with 15 and 25 kg BW, which is slightly lower than our findings.
Trace elements serve as structural components of several metalloenzymes such as glutathione catalase (Fe) and superoxide dismutase (Cu and Zn). Metalloenzymes are required for a wide range of metabolic activities such as energy production, protein digestion, cell replication, antioxidant activity, and wound healing (McDowell, 1992). However, nutritional requirements of trace minerals for goats are scarce. In a recent study, Ji et al. (2014) found that the net zinc requirement for growth decreased from 23.4 to 23.2 mg/kg BW gain for ram lambs and 23.8 to 22.1 mg/kg BW gain for ewe lambs as the BW increased from 20 to 35 kg. On the other hand, Zang et al. (2015) found that the net requirements for growth decreased from 56.60 to 49.40 mg Fe, from 0.30 to 0.22 mg Mn, and from 3.00 to 2.40 mg Cu per kg of BW gain and increased from 22.70 to 23.00 mg Zn per kg of BW gain for males, while decreased from 24.70 to 17.60 mg Fe, from 0.35 to 0.25 mg Mn, from 2.30 to 1.70 mg Cu, and from 22.30 to 20.50 mg Zn per kg of BW gain for females from 20 to 35 kg BW, respectively.
The recommendations of zinc for growth adopted by the NRC (2007) for goats are 25 mg of Zn/kg of BW gain, which are similar to the value found in this research (24.15 to 29.79 mg of Zn/kg of BW gain). Suttle (1979) reported that the value of 24 mg/kg carcass gain was taken to represent the approximate net growth requirements of lambs. This value has been widely adopted for ruminant nutritional systems (NRC, 2007; Suttle, 2010). Therefore, the results presented in this paper are consistent with these general findings.
For goats, the NRC (2007) determined that factorial approach to calculating iron requirements was not justified because of the lack of data. It has been reported that dietary requirements for goats are higher than for sheep because they are more often affected by internal parasites; in addition, older animals have lower needs, because considerable recycling of iron occurs when red blood cells turn over (Underwood, 1977); and in older animals, blood volume does not increase as it does for younger animals (NRC, 2007). Net iron requirements in this study (42.45 to 59.03 mg of Fe/BW gain) were similar
to those recommended by NRC (2007) for growing sheep (55 mg of Fe/kg of BW gain) and to those found by Zang et al. (2015) for males (56.60 to 49.40 mg of Fe/BW gain); however; they were greater than those observed for females (24.70 to 17.60 mg of Fe/BW gain). In our study, all the net requirements for growth were higher than those observed by Silva et al. (2013) working with animals in similar conditions to those of this study. According to Zang et al. (2015), these differences might be related, in part, to breed, feed, management practices, and physiological and environmental conditions.
Manganese is an essential mineral in the ration of goats, required for skeletal development and reproductive efficiency. Suttle (1979) reported that values of 0.85 mg/kg carcass gain were taken to represent the approximate net growth requirements of lambs for manganese. According to NRC (2007), the amount of manganese deposited in the weight gain is estimated as 0.70 and 0.47 mg/kg of BW for goats and sheep, respectively. According to Zang et al. (2015), the net requirements for growth varied from 0.30 to 0.22 mg Mn/kg of BW gain for males and from 0.35 to 0.25 mg Mn/kg of BW gain for females from 20 to 35 kg BW, respectively. Comparing these results with those given in the present study (0.97 to 1.29 mg of Mn/kg of BW gain), the manganese net requirements for gain for the Moxotó goats from 15 and 25 kg of BW were about 28% and 46% higher, respectively, than those reported by the NRC (2007) for goats. These findings indicate that the manganese net requirements for growth are higher in goats than in sheep. Animals of different genotypes are well known to exhibit differences in their mineral requirements due to the differences in their body composition (Teixeira et al., 2013).
indicated that the net copper requirements for growth of Moxotó goats (1.53 to 1.59 mg/kg BW gain) were higher than the recommendations of the NRC (2007).
Results presented by Suttle (1979) indicated that the extent to which Cu is deposited in tissues influenced the Cu concentrations in the whole carcass. Therefore, these researchers suggested that the net growth requirement for coper must, therefore, either be derived from minced carcasses that exclude the liver or from animals that have at no time received more dietary copper than they require. On the other hand, the major concentration of copper in goats is not only in the liver (10 mg/kg of DM), but in other tissues such as brain (14 mg/kg of DM) and heart muscle (13 mg/kg of DM), as reported by Haenlein and Anke (2011). Therefore, it is possible that such inconsistencies may be related to differences in experimental conditions. Accordingly, more research is necessary to evaluate body composition in copper to better establish mineral requirements for different goat genotypes to obtain a more efficient and economic production system.
There is a paucity of information available relative to the net requirements of cobalt for goats. Therefore, dietary cobalt requirements are used. In this study, cobalt presented the lowest retention in empty body gain, which may have been due to the low requirements of this mineral in body tissues (Table 5). Similarly to other trace elements, the net requirements of cobalt increased as BW and weight gain rate increased. Cobalt is important in ruminants because it is required by ruminal microorganisms to synthesize vitamin B12. Consequently, diets containing inadequate amounts of cobalt result in vitamin B12 deficiencies. It is commonly
assumed that the minimum daily requirement of cobalt specified for sheep is adequate for goats. However, this assumption appears not to be valid for all goat breeds (Johnson et al., 2004). Some authors have demonstrated that goats fed a diet containing the minimum daily requirement of cobalt as specified for sheep developed poor hair coats, weight loss, and reduction in erythrocyte counts and hemoglobin.
According to Suttle (2010), net mineral requirements underestimate gross dietary needs for minerals because ingested minerals are incompletely absorbed, the degree of underestimate being inversely related to the efficiency with which a given mineral is absorbed from a given diet. However, the main advantage of the factorial approach is that requirements can be predicted for a wide range of production circumstances, provided that reliable data are available for each model component (ARC, 1980; White, 1996). Therefore, these extrapolated nutrient recommendations can be used as a starting point for the minimum suggested
nutrient requirements and concentrations in formulating diets (Robert and Van, 2006).
This research is one of the few to provide information on trace mineral requirements for indigenous goats using the factorial approaches. Thus, it is difficult to compare these results with values generated with similar animals to the ones used in this research. Therefore, new studies on the nutrient requirements should be undertaken, including different breeds in different environments because of the influence of breed and environment on the requirements of the animals. Thus, these differences must be taken into account when a diet is formulated.
Conclusions
The net zinc, iron, manganese, copper, and cobalt requirements of Moxotó goat kids grazing in the semiarid region increases as feed intake level and their body weight increase from 15 to 25 kg. In addition, our study reveals that body weight changes affects more the deposition of iron and manganese in empty body weight gain than other trace elements.
Acknowledgments
The authors would like to thank the Conselho Nacional de Desenvolvimento Científico e Tecnológico (CNPq) and the Banco do Nordeste do Brasil for financial support.
References
AOAC - Association of Official Analytical Chemistry. 1990. Official methods of analysis. 15th ed. AOAC International, Washington, DC.
Araújo, M. J.; Medeiros, A. N.; Teixeira, I. A. M. A.; Costa, R. G.; Marques, C. A. T.; Resende, K. T. and Mello, G. M. P. 2010. Mineral requirements for growth of Moxotó goats grazing in the semi-arid region of Brazil. Small Ruminant Research 93:1-9. ARC - Agriculture and Research Council. 1980: The nutrient
requirements of ruminant livestock. CAB International, Wallingford, UK.
Bellof, G. and Pallauf, J. 2007. Deposition of copper, iron, manganese and zinc in empty body growing of lambs of the breed German Merino Land sheep. Animal 6:827-834.
CSIRO - Commonwealth Scientific and Industrial Research Organization. 2007. Nutrient requirements of domesticated ruminants. CSIRO Publishing, Collingwood, Australia.
Fernandes, M. H. M. R.; Resende, K. T.; Tedeschi, L. O.; Fernandes, J. S.; Silva, H. M.; Carstens, G. E.; Teixeira, I. A. M. A. and Akinaga, L. 2007. Energy and protein requirements for maintenance and growth of Boer crossbred kids. Journal of Animal Science 85:1014-1023.
the maintenance and growth of Boer crossbred kids. Journal of Animal Science 90:458-4466.
Grace, N. D. 1983: The mineral requirements of grazing ruminants. Occasional Publication. New Zealand Society of Animal Production, Palmerston North.
Haenlein, G. F. W. and Anke, M. 2011. Mineral and trace element research in goats: A review. Small Ruminant Research 95:2-19. Ji, S. K.; Xu, G. S.; Diao, Q. Y.; Jiang, C. G.; Deng, K. D.; Tua, Y. and
Zhang, N. F. 2014. Net zinc requirements of Dorper × thin-tailed Han crossbred lambs. Livestock Science 167:178-185.
Johnson, E. H.; Al-Habsi, K.; Kaplan, E.; Srikandakumar, A.; Kadim, I. T.; Annamalai, K.; Al-Busaidy, R. and Mahgoub, O. 2004. Caprine hepatic lipidosis induced through the intake of low levels of dietary cobalt. Veterinary Journal 168:174-179.
Mahanti, H. and Barnes, R.M. 1983. Determination of major and trace elements in bone by Determination of major, minor and trace elements in bone by inductively-coupled plasma emission spectrometry. Analytica Chimica Acta 151:409-417.
Mahgoub, O. and Lu, C. D. 1998. Growth, body and carcass tissue distribution in goats of large and small sizes. Small Ruminant Research 27:267-278.
McDowell, L. R. 1992. Minerals in animal and human nutrition. Academic Press, London.
NRC - National Research Council. 1981. Nutrient requirements of goats: Angora, dairy, and meat goats in temperate and tropical countries. National Academy of Sciences, Washington, DC. NRC - National Research Council. 2007. Nutrient requirements of
small ruminants: sheep, goats, cervids, and new world camelids. 1st rev. ed. National Academy Press, Washington, DC.
Ramírez-Perez, A. H.; Buntinx, S. E. and Rosiles, R. 2000. Effect of breed and age on the voluntary intake and the micromineral status of non-pregnant sheep II. Micromineral status. Small Ruminant Research 37:231-242.
Robert, J. and Van, S. 2006. Nutrient requirements of South American camelids: a factorial approach. Small Ruminant Research 61:165-186. Silva, C. M.; Medeiros, A. N.; Costa, R. G.; Sales, E. P.; Silva, A. M.
A. and Lima Jr, V. L. 2013. Micromineral nutritional requirements for weight gain in Canindé goats under grazing in the Brazilian semiarid. Acta Scientiarum - Animal Sciences 35:173-179. Solaiman, S. G.; Shoemaker, C. E. and D’Andrea, G. H. 2006. The
effect of high dietary Cu on health, growth performance, and Cu status in young goats. Small Ruminant Research 66:85-91. Suttle, N. F. 1979. Copper, iron, manganese and zinc concentrations in
the carcass of lambs and calves and the relationship to trace element requirements for growth. British Journal of Nutrition 42:89-96. Suttle, N. F. 2010. Mineral nutrition of Livestock, 4th ed. CAB
International, Oxfordshire, UK.
Teixeira, I. A. M. A.; Resende, K. T.; Silva, A. M. A.; Silva Sobrinho, A. G.; Härter, C. J. and Sader, A. P. O. 2013. Mineral requirements for growth of wool and hair lambs. Revista Brasileira de Zootecnia 42:347-353.
Tilley, J. M. A. and Terry, R. A. 1963. A two stage technique for the in vitro digestion of forage crops. Journal of the British Grassland Society 18:104-111.
Underwood, E. J. 1977. Trace elements in human and animal nutrition. 4th ed. Academic Press, London.
Underwood, E. J. and Suttle, N. F. 1999. The mineral nutrition of Livestock. 3rd ed. CABI Publishing, NY, USA.
Zhang, H.; Nie, H. T.; Wang, Q.; Wang, Z.Y.; Zhang, Y.L.; Guo, R.H. and Wang, F. 2015. Trace element concentrations and distributions in the main body tissues and the net requirements for maintenance and growth of Dorper × Hu lambs. Journal of Animal Science 93:2471-2481.