ABSTRACT
RESUMO
Submitted on April 5th, 2017 and accepted on September 26th, 2017.
1 Universidade Federal de Santa Catarina, Departamento de Engenharia Rural, Florianópolis, Santa Catarina, Brazil. [email protected]; [email protected] 2 Universidade Federal Rural de Pernambuco, Serra Talhada, Pernambuco, Brazil. [email protected]
* Corresponding author: [email protected]
Estimation of soybean agronomic performance in climatic scenarios
for Southern Brazil
The study aimed to analyze the agronomic performance of soybean cultivated in Southern Brazil, in climatic scenarios. Climatic data from three cities located in the main soybean producing regions of Paraná, Santa Catarina, and Rio Grande do Sul were used in the Aquacrop 4.0 software. Thus, it was possible to simulate cycle duration, yield, water use efficiency in productivity of evapotranspiration water (WUE), net irrigation requirement, and harvest index adjusted for different climatic scenarios based on short-term (2016-2035) and medium-term projections (2046-2065) of the RCP4.5 scenario of the Intergovernmental Panel on Climate Change. The soybean cycle duration tends to decrease when the locality is colder. Productivity and WUE should increase even if there is no irrigation requirement in future climate scenarios.
Key words: yield; irrigation; fenology.
Rosandro Boligon Minuzzi1*, Carolina do Amaral Frederico1, Thieres George Freire da Silva2
10.1590/0034-737X201764060002
Estimativa do desempenho agronômico da soja em cenários climáticos para o sul do Brasil
Este estudo teve como objetivo analisar o desempenho agronômico da soja cultivada no sul do Brasil em cenários climáticos. Dados climáticos de três municípios localizados nas principais regiões produtoras de soja do Paraná, Santa Catarina e do Rio Grande do Sul foram utilizados no software Aquacrop 4.0 para simular a duração do ciclo, produtivida-de, eficiência do uso da água na produtividade da água evapotranspirada (EUA), requerimento de irrigação líquida e o índice de colheita ajustado em diferentes cenários climáticos, baseados nas projeções em curto prazo (2016-2035) e médio prazo (2046-2065) do cenário RCP4.5 do Painel Intergovernamental sobre Mudança Climática. A duração do ciclo da soja tende a diminuir quanto mais frio for a localidade. A produtividade e a EUA devem aumentar, mesmo que não haja requerimento de irrigação nos cenários climáticos futuros.
INTRODUCTION
Soybean is one of the main crops of the Brazilian agribusiness that currently occupies 49% of the country grain area according to the Ministry of Agriculture, Livestock and Food Supply (MAPA, 2016). In the 2014/ 2015 harvest, the planted area was 31.6 million hectares and production reached 95.1 million tons, according to the National Supply Company (CONAB, 2016). These data give Brazil the position as second largest producer in the world and the South region, in turn, stands out in the national scenario with the second largest area planted (~11.0 million hectares), production (33.8 million tons), and leading with the highest yield in the country (3,067 kg ha-1).
The current edaphoclimatic conditions of the Brazilian South region confer a vast plantation area for dry soybeans, with a sowing calendar between October and December, when there are very low climatic risks to yield according to the current ordinance of agricultural zoning of MAPA, based on the occurrence of frost, average monthly temperature, and water deficit. Thus, it becomes even more worrying when considering future scenarios for air temperature increase because of increased greenhouse gases, uncertainties in rainfall levels, and extreme event intensification, according to the fifth report of the Intergovernmental Panel on Climate Change (IPCC, 2013). Climate scenarios are representations of future climate, based on a set of assumptions, which include trends of future energy demand, greenhouse gas emissions, changes in land use, and approximations in the laws governing the climatic system resulting from human activities (Hamada
et al., 2008).
In the evaluation of climate change effects on the agronomic performance of crops, some plant growth models could be useful tools for the elaboration of public policies of adaptation to the new agricultural scenarios. Among the most applied, Aquacrop simulates biomass and crop yield in response to abiotic stresses (hydric, thermal, fertilization, salinity, and carbon dioxide) and agronomic management, assuming physiological concepts of plants, water balance, and salts in the soil (Vanuytrecht et al., 2014).
According to Chami & Daccache (2015), future climatic scenarios have shown reduced cultivation areas and dry crop yields, with high economic losses and the need for irrigation as an adaptation practice.
Different simulations show that the effect of climatic changes on agricultural production varies according to the scenario of greenhouse gas emissions, the period analyzed, the current climate, and the management practices adopted from region to region (Tao & Zhang, 2011). Therefore, the aim of this study was to estimate the agronomic performance of soybean cultivated in Southern Brazil, in climatic scenarios presented in the Fifth Assessment Report of the IPCC.
MATERIAL AND METHODS
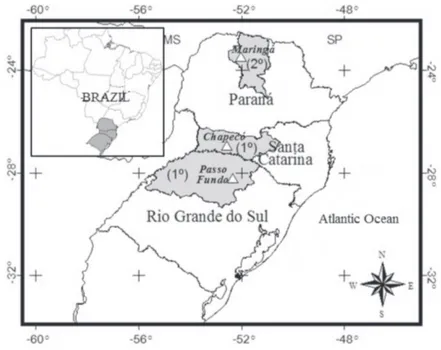
It was possible to use climatological averages (1981 to 2014) for decennial precipitation and minimum and maximum air temperature of three meteorological stations belonging to the National Institute of Meteorology (INMET) each located in the main soybean producing mesoregions, in the states of Rio Grande do Sul (Passo Fundo), Santa Catarina (Chapecó), and Paraná (Maringá) (Figure 1).
Table 1 specifies the geographic coordinate and altitu-de of the municipalities where the meteorological stations are located, as well as air temperature and rainfall climatology from October 1st to March 31.
The following parameters regarding the agronomic performance during the whole soybean cycle were considered in the analysis: yield (ton ha-1), cycle duration
after germination (days), adjusted harvest index (%), net irrigation requirement (mm), and efficiency of water use in the productivity of evapotranspiration water (kg m-3). The
simulations of variables were performed by using AquaCrop 4.0 software (available on the Food and Agriculture Organization–FAO website) and the input data were climatic parameters, soil and crop characteristics, and soil management information.
Effective precipitation was determined by the USDA Soil Conservation Service method (USDA-SCS), while the reference evapotranspiration (ETo) was estimated by using Cropwat 8.0 software, and applying the air temperature data in the proposed Penman-Monteith methodology (FAO Standard -1998, Allen et al., 1998). Other meteorological variables to calculate the ETo were estimated through procedures suggested by Allen et al. (1998).
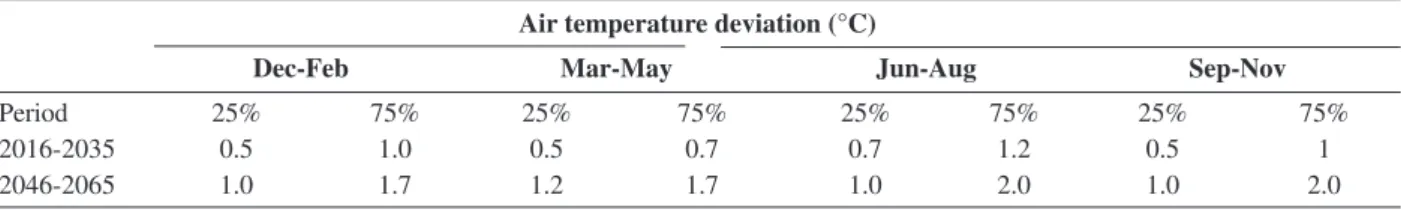
Simulations considered the climate projections presented in the Fifth Assessment Report of the IPCC (IPCC, 2013) based on 25 and 75% values of ensemble distribution among models used to generate the RCP 4.5 scenario in the short (2016-2035) and medium term (2046-2065), besides the current climate used as a reference (1981-2014). Precipitation and air temperature deviations for the southern region of Brazil are presented, respectively, in Tables 2 and 3, based on the 25 and 75% values of the RCP 4.5 scenario. For example, if the current precipitation climate (mm) is to 100%, the expected positive (negative) percentage will indicate if precipitation will increase (decrease) in millimeters.
The CO2 value used as a reference (383.76 ppm) refers to the average concentration measured in 2007 at the Mauna Loa Observatory, in Hawaii. For future scenarios in short and medium terms, the RCP4.5 scenario projections for the years 2025 (425.8 ppm) and 2055 (499.55 ppm) were considered as representatives of those periods, respectively.
October 10 and December 10, representing the planting limits recommended by the COODETEC (2006) for 20 cultivars indicated for the South of Brazil. The maximum depth of adequate root system was considered to be 70 cm, the reference harvest index (HIo) was 31%, and maximum canopy cover of 100%. The proposed method of McMaster & Wilhelm (1997) was used to calculate the accumulated degree-days (ADD), with the modification that no adjustment is made at minimum temperature when it is below lower basal temperature. Thermal accumulation required for the crop to reach certain phenological phases from sowing was obtained by “rolling” the model for the first time, considering cycle length and stages in days for medium-cycle cultivars. Then, the parameters were automatically converted into thermal units based on the concept of degree-days (DD). Such parameterization was performed by considering that lower critical temperature is not a limiting factor for soybean in the region climate and period in which simulations were carried out (Steduto et al., 2012). Therefore, accumulated degree-days (ADD) from sowing were the following: 177 ADD (emergence), 1242 ADD (flowering), and 2056 ADD (senescence).
The adjusted harvest index (HIaj) was used to evaluate water deficit impact after the flowering phase of the crop, associating the HIo with reduced biomass rate, during the reproductive stage.
In the case of liquid irrigation requirement, it was stipulated to irrigate when easily available water in the root zone was at 85% of its field capacity to apply enough water to reach 20% of soil field capacity, as a way to take advantage of rainwater that may eventually occur after
irrigation. During simulations, the existence of stress due to salinity and/or soil fertility was not considered.
Characteristics of predominant agricultural soils in Maringá and Chapecó (Oxisoil) and Passo Fundo (Red Oxisoil) were considered. Regarding no-tillage, it was taken into account that the soil had 85% coverage of organic matter.
RESULTS AND DISCUSSION
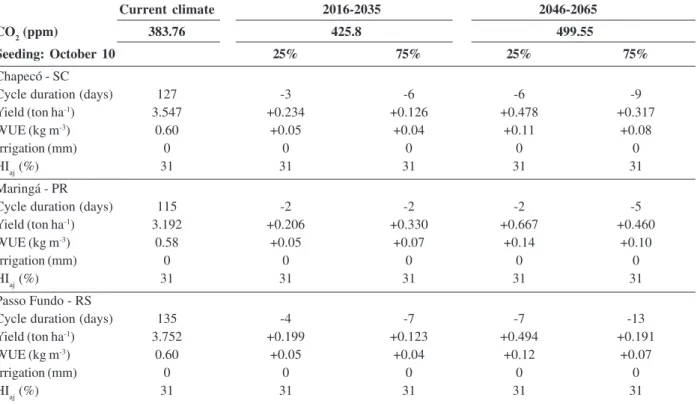
The results indicated that estimated data for soybeans sown at the beginning of October showed a decrease in crop cycle duration (Table 4). Such tendency is higher when the locality is colder (Table 1). Citing the extreme results in Maringá and Passo Fundo, decreases in cycle length duration were from two to five and four to 13 days, respectively. This is due to the difference in the latitude and altitude of the regions, in which Maringá has a lower altitude and latitude, opposite to Passo Fundo, which is the coldest region. Thus, the future trend about duration difference of soy cycle will be lower among the southern states of Brazil.
Another analysis refers to comparing the current cycle duration with the one predicted for the future between different localities. As an example, in Passo Fundo, in some scenarios where it indicates a reduction of up to seven days, cycle duration will be practically equal to the one observed today in Chapecó. It is the same reasoning when comparing the nine-day reduction predicted for Chapecó in the medium term (2046 to 2065), in the 75% percentile, with current duration observed in Maringá (115 days).
In parentheses, the position of mesoregions in the soybean state production.
The unanimous reduction in cycle duration of soybean with early sowing foreseen for Southern Brazil is consistent since its calculation was based on the concept of cumulative degree-days, which takes into account only the air temperature. Thus, as all scenarios indicate air temperature elevation in the region, the crop will reach its energy requirement sooner to complete its cycle. Rodrigues et al. (2001) pointed out that the response of soybean development to photoperiod and air temperature is not linear throughout the phenological cycle. However, the duration between emergence and flowering is strongly dependent on these two climatic elements and such influence is variable according to the cultivars and lineage.
It is worth noting that these estimated parameters for soybean are based on a no-tillage system. Nevertheless, the application to soybeans sown by the conventional system should not be very distinct as shown by Muller et al. (2015), who found equal thermal accumulation for a soybean variety to reach three phenological stages, independent of the planting system.
Yield and efficiency of water use in the productivity by evapotranspiration water (WUE) were also unanimous in showing the same increase trend, in all future scenarios (Tabela 4). Despite such consistency, hypotheses for yield increase are diverse and distinct.
Schöffel & Volpe (2002) showed that the highest yields of soybean grains were obtained when degree day conversion efficiency for dry matter production was also more pronounced, suggesting that yield may be associated with the thermal accumulation and dry matter production. Therefore, Alambert (2010) found a reduction in soybean cycle with the increase of average air temperature. However, it proportionally reduced productivities of grains and soybean oil during different sowing dates carried out in Piracicaba, São Paulo state.
Berlato et al. (1992) concluded that air temperature was not the limiting factor in soybean yield in five locations in Rio Grande do Sul state, but rather, precipitation. On the other hand, Verón et al. (2015) showed that wheat, maize, and soybean yields responded more negatively to the observed climatic trends of average and maximum air temperature than to precipitation in the Pampas region of Argentina. Yield reductions were higher for maize (5.4%) and lower for soybean (2.6%), in theory, due to greater variation in air temperature. The researchers cited other studies with opposite results regarding factors responsible for yield variation. Thus, the climate difference of studied areas and different periods and methodologies used are the probable reasons for these inconsistencies.
Although some scenarios indicate a favorable condition (air temperature increase and precipitation
Table 1: Geographic coordinates, altitude, and climatology of air temperature and rainfall for the cities of Maringá, Chapecó, and
Passo Fundo from October 1st to March 31
City Latitude (°) Longitude (°) Altitude (m) Temperature (°C) Rainfall (mm)
Maringá -23.40 -51.91 542 24.5 1058.4
Chapecó -27.90- -52.64 679 22.8 1126.6
Passo Fundo 28.21 -52.40 684 20.9 1032.6
Table 3: Semi-annual precipitation deviations (%) based on 25 and 75% projected for the southern region of Brazil by the RCP4.5 scenario of IPCC for the periods 2016-2035 and 2046-2065
Precipitation deviation (%)
Oct-Mar Apr-Sep
Period 25% 75% 25% 75%
2016-2035 -5 +5 -5 +15
2046-2065 -5 +15 -5 +15
Source: Adapted from the IPCC (2013)
Table 2: Quarterly mean air temperature deviations based on the 25 and 75% projected for the southern region of Brazil by the RCP4.5 scenario of IPCC for the periods 2016-2035 and 2046-2065
Air temperature deviation (°C)
Dec-Feb Mar-May Jun-Aug Sep-Nov
Period 25% 75% 25% 75% 25% 75% 25% 75%
2016-2035 0.5 1.0 0.5 0.7 0.7 1.2 0.5 1
2046-2065 1.0 1.7 1.2 1.7 1.0 2.0 1.0 2.0
reduction) for a lower availability of moisture in the soil, if soybeans are sown early in southern Brazil, they will not require irrigation water. Therefore, there is no tendency to suffer from water deficit as indicated by the HIaj values (Table 4).
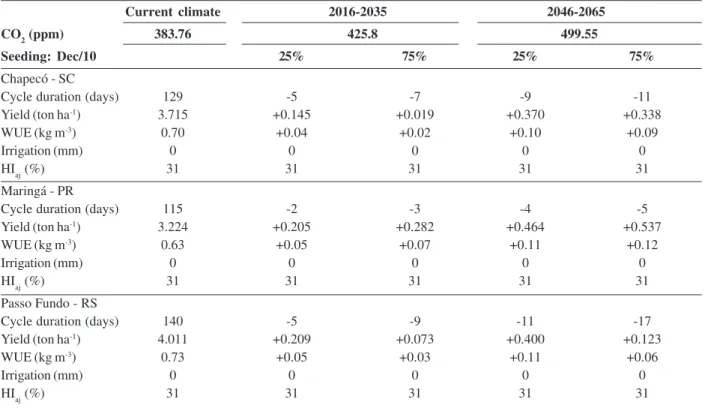
The agronomic performance of soybeans sown in early December shows the same future trend than the early sowing (October). It is worth noting that there are higher reductions in cycle length and, yield increase in the WUE is lower than the estimated for soybean planted in October, except for Chapecó and Maringá in the medium term, at 75% percentile for the last two Parameters (yield and WUE) as presented in Table 5.
Besides the eventual influence of climatic elements and WUE, in the yield variability previously discussed, an atmospheric CO2 increase has been projected by the scenarios.
The increase of CO2 promotes an increase in growth and yield in C3 plants such as soybean due to the growth of photosynthetic rate and photorespiration reduction (Long et al., 2006). Pimentel (2011) also followed that rationale; however, he warned that higher temperatures and reduction of water availability in the soil may deny the beneficial and fertilizing effect of CO2. In the north of Rio Grande do Sul state, Sgarbossa et al. (2015) found out that the greatest WUE for soybean was achieved through the highest applied irrigation (125% of evapotranspiration),
which represented the highest yield. Li et al. (2013) were more explicit by showing that height, leaf area, dry mass, WUE, and soybean yield increased over high CO2 conditions and no water deficit. Nevertheless, in dry conditions, these crop characteristics were not affected by the CO2 increase, except for the dry mass during grain filling phase and WUE, which showed a slight increase. Thus, soybean could only benefit from a CO2 enriched environment, if the crop is in a region where precipitation meets the water requirements of the crop, or if there is irrigation.
Liu & Tao (2013) also confirmed such CO2 influence on C3 plants in conditions of water deficit absence as presented in this study, in which there is no indicative of water deficit even in irrigation requirement absence (Tables 4 and 5).
In a current situation that points out irrigated agriculture as responsible for the use of approximately 70% of total water in the world, such agricultural scenario for soybean is very receptive before a future environmental and social panorama that refers to the increase in water use due to population growth. Therefore, it will demand a greater need for food, as well as the growth of irrigated areas.
Iglesias et al. (2012) highlighted that the impacts of climate change on agricultural production, in Europe, are closely associated with demand and availability of water sources. They tend to occur because of evapotranspiration
Table 4: Cycle duration after germination, yield and water use efficiency (WUE), required irrigation, adjusted harvest index (HIaj) estimated for the current climate (reference), and their respective deviations in future climatic scenarios for soybeans sown on October 10, in Chapecó, Maringá, and Passo Fundo
Current climate 2016-2035 2046-2065
CO2 (ppm) 383.76 425.8 499.55
Seeding: October 10 25% 75% 25% 75%
Chapecó - SC
Cycle duration (days) 127 -3 -6 -6 -9
Yield (ton ha-1) 3.547 +0.234 +0.126 +0.478 +0.317
WUE (kg m-3) 0.60 +0.05 +0.04 +0.11 +0.08
Irrigation (mm) 0 0 0 0 0
HIaj (%) 31 31 31 31 31
Maringá - PR
Cycle duration (days) 115 -2 -2 -2 -5
Yield (ton ha-1) 3.192 +0.206 +0.330 +0.667 +0.460
WUE (kg m-3) 0.58 +0.05 +0.07 +0.14 +0.10
Irrigation (mm) 0 0 0 0 0
HIaj (%) 31 31 31 31 31
Passo Fundo - RS
Cycle duration (days) 135 -4 -7 -7 -13
Yield (ton ha-1) 3.752 +0.199 +0.123 +0.494 +0.191
WUE (kg m-3) 0.60 +0.05 +0.04 +0.12 +0.07
Irrigation (mm) 0 0 0 0 0
growth of crops in response to the increase of temperature and water scarcity that leads to increase of irrigation requirements.
Yield increase is inserted in a context of world population imminent increase that may grow even more as new techniques of agricultural management are adopted along with the reduction of soybean cycle duration. Therefore, it will help to develop a second harvest on a larger scale and lower climatic risk for cultivation in southern Brazil.
CONCLUSIONS
Regardless of the sowing date, the soybean cycle duration tends to decrease in a colder location in southern Brazil.
In the future, soybean yield is going to increase by up to 0.330 tons ha-1 and 0.667 tons ha-1, respectively, in the
short and medium terms.
The projected rainfall in the short and medium terms for South of Brazil will still be enough to meet the water needs of soybeans.
REFERENCES
Alambert MR (2010) Estimação estocástica de parâmetros pro-dutivos da soja: uso do modelo PPDSO em um estudo de caso em Piracicaba-SP. Profissional Master’s in Agro-energy. São Paulo, São Paulo School of Economics. 108p.
Allen RG, Pereira LS, Raes D & Smith M (1998) Crop evapotranspiration. Available at: <http://www.fao.org/docrep/ X0490E/X0490E00.htm>. Accessed on: November 25th, 2009.
Berlato MA, Fontana DC & Gonçalves HM (1992) Relação entre o rendimento de grãos da soja e variáveis meteorológicas. Pes-quisa Agropecuária Brasileira, 27:695-702.
Chami DE & Daccache A (2015) Assessing sustainability of winter wheat production under climate change scenarios in a humid climate - An integrated modelling framework. Agricultural Systems, 140:19-25.
CONAB – Companhia Nacional de Abastecimento (2016) Levan-tamentos de safra. Available at: <http://www.conab.gov.br/ conteudos.php?a=1253&t=>. Accessed on: January 23rd, 2016.
COODETEC - Cooperativa Central de Pesquisa Agrícola (2006) Cultivares de soja. Cascavel, COODETEC. 55p.
Hamada E, Gonçalves RRV, Orsini JAM & Ghini R (2008) Cenári-os climáticCenári-os futurCenári-os para o Brasil. In: Ghini R & Hamada E (Eds.) Mudanças climáticas: impactos sobre doenças de plantas no Brasil. Brasília, Embrapa. p.25-73.
Iglesias A, Quiroga S, Moneo M & Garrote L (2012) From climate changes impacts to the development of adaptation strategies: Challenges for agriculture in Europa. Climatic Change, 112:143-168.
IPCC - Intergovernmental Panel on Climate Change (2013) Annex I: Atlas of Global and Regional Climate Projections Supplementary Material RCP4.5. Available at: <http:// www.climatechange2013.org e http://www.ipcc.ch>. Accessed on: May 7th, 2014.
Li D, Liu H, Qiao Y, Wang Y, Cai Z, Dong B, Shi C, Liu Y, Li X & Liu M (2013) Effects of elevated CO2 on the growth, seed yield, and water use efficiency of soybean (Glycine max (L.) Merr.) under drought stress. Agricultural Water Management, 129:105-112.
Table 5: Cycle duration after germination, yield, water use efficiency (WUE), required irrigation, adjusted harvest index (HIaj) estimated for current climate (reference), and their respective deviations in future climatic scenarios for soybeans sown on December 10, in Chapecó, Maringá, and Passo Fundo
Current climate 2016-2035 2046-2065
CO2 (ppm) 383.76 425.8 499.55
Seeding: Dec/10 25% 75% 25% 75%
Chapecó - SC
Cycle duration (days) 129 -5 -7 -9 -11
Yield (ton ha-1) 3.715 +0.145 +0.019 +0.370 +0.338
WUE (kg m-3) 0.70 +0.04 +0.02 +0.10 +0.09
Irrigation (mm) 0 0 0 0 0
HIaj (%) 31 31 31 31 31
Maringá - PR
Cycle duration (days) 115 -2 -3 -4 -5
Yield (ton ha-1) 3.224 +0.205 +0.282 +0.464 +0.537
WUE (kg m-3) 0.63 +0.05 +0.07 +0.11 +0.12
Irrigation (mm) 0 0 0 0 0
HIaj (%) 31 31 31 31 31
Passo Fundo - RS
Cycle duration (days) 140 -5 -9 -11 -17
Yield (ton ha-1) 4.011 +0.209 +0.073 +0.400 +0.123
WUE (kg m-3) 0.73 +0.05 +0.03 +0.11 +0.06
Irrigation (mm) 0 0 0 0 0
Liu Y & Tao F (2013) Probabilistic change of wheat productivity and water use in China for Global mean temperature change of 1, 2 and 3 °C. Journal of Applied Meteorology and Climatology, 52:114-129.
Long P, Ainsworth EA, Leakey AD, Nösberg J & Ort DR (2006) Food for thought: lower-than-expected crop yield stimulation with rising CO2 concentrations. Science, 312:1918-1921.
McMaster GS & Wilhelm WW (1997) Growing degree-days: one equation, two interpretations. Agricultural and Forest Meteorology, 87:291-300.
MAPA – Ministério da Agricultura, Pecuária e Abastecimento (2016) CS Soja – Anos anteriores. Available at: <http:// www.agricultura.gov.br/assuntos/camaras-setoriais-tematicas/ documentos/camaras-setoriais/soja/cs-soja-anos-anteriores>. Accessed on: January 24th, 2016.
Muller AG, Oliveira AG, Guimarães DG, Lima AS, Dias WS & Sousa CAN de (2015) Efeito das condições térmicas no crescimento e desenvolvimento da soja avaliado em sistema de plantio direto e convencional. In: 19º Congresso Brasileiro de Agrometeorologia, Lavras. Anais, SBAGRO. p.109-116.
Pimentel C (2011) Metabolismo de carbono de plantas cultivadas e o aumento de CO2 e de O3 atmosférico: situação e previsões. Bragantia, 70:01-12.
Rodrigues O, Didonet AD, Lhamby JC, Bertagnoli PF & Luz JS da (2001) Resposta quantitativa do florescimento da soja à tem-peratura e ao fotoperíodo. Pesquisa Agropecuária Brasileira, 36:431-437.
Schöffel ER & Volpe CA (2002) Relação entre soma térmica efetiva e o crescimento da soja. Revista Brasileira de Agrometeorologia, 10:89-96.
Sgarbossa J, Caron BO, Schneider JR, Schwerz F & Elli EF (2015) Lâminas de irrigação na eficiência do uso da água na cultura da soja. In: 19º Congresso Brasileiro de Agrometeorologia, Lavras. Anais, SBAGRO. p. 1299-1305.
Steduto P, Hsiao TC, Fereres E & Raes D (2002) Crop yield response to water. Available at: <http://www.fao.org/docrep/016/ i2800e/i2800e.pdf>. Accessed on August 21st, 2008.
Tao F & Zhang Z (2011) Impacts of climate change as a function of global mean temperature: maize productivity and water use in China. Climatic Change, 105:409-432.
Vanuytrecht E, Raes D, Steduto P, Hsiao TC, Fereres E, Heng LK, Vila MG & Moreno PM (2014) AquaCrop: FAO’s crop water productivity and yield response model. Environmental Modelling & Software, 62:351-360.