___________________________________________
1 Engo Agrícola, Professor, Doutor em Engenharia Agrícola, Universidade Federal de Viçosa, Viçosa –MG, Fone: (31)
3899-1912, ffpruski@ufv.br
2 Engo Agrícola, Analista de Meio Ambiente e Recursos Hídricos, Mestre em Engenharia Agrícola, Instituto Estadual de Meio
Ambiente e Recursos Hídricos, Vitória - ES, luizhenobre@hotmail.com
3 Engo Civil, Especialista em Recursos Hídricos, Doutor em Desenvolvimento Sustentável, Agência Nacional de Águas, Brasília
- DF, lmeneses@ana.gov.br
4 Engo Civil, Doutor em Engenharia Agrícola, Universidade Federal de Viçosa, Viçosa –MG, jmasilva@gmail.com
5 Engo Ambiental, Pesquisador em Geociências, Mestre em Meteorologia Agrícola, CPRM/Serviço Geológico do Brasil, Belo
Horizonte –MG, fernando.silva@cprm.gov.br
6 Meteorologista, Professor, Doutor em Meteorologia, Universidade Federal de Viçosa, Viçosa –MG, fjustino@ufv.br
Recebido pelo Conselho Editorial em: 11-9-2012
MONTHLY STREAMFLOW ON THE POTENTIAL USE OF WATER RESOURCES
FERNANDO F. PRUSKI1, LUIZ H. N. BOF2, LUCIANO M. C. DA SILVA3, JOSÉ M. A. DA SILVA4, FERNANDO S. REGO5, FLAVIO B. JUSTINO6
ABSTRACT: The consideration of the streamflow seasonality has a high potential to improve the water use. In order to give subsidies to the optimization of water use, it was evaluated the impact of the change of reference annual streamflow by the monthly streamflows in the potential water use throughout the hydrography of Paracatu sub-Basin. It was evaluated the impact on Q7,10 (lowest average streamflow during a 7-day period with an average recurrence of 10 years) and on Q95 (permanent flow present 95% of the time). The use of monthly streamflow to substitute the annual streamflow had a high potential of improvement of water resources use in the sub-Basin studied. The use of monthly Q 7,10 in substitution of annual Q 7,10 increases the potential water use that vary from about 10% in the months of lower water availability to values exceeding 200% in the months with higher availability of surface water resources. The use of monthly Q95 in substitution of the annual Q95 implies in changes oscillating from reduction of 37% in months of higher water restriction to values exceeding 100% in the months of higher availability, so the use of monthly Q95 instead of the annual Q95 enables the more rational and safe use of water resources.
KEYWORDS: seasonality of streamflow, planning and management of water resources.
IMPACTO DA SUBSTITUIÇÃO DAS VAZÕES DE REFERÊNCIA ANUAIS PELAS MENSAIS NO POTENCIAL DE USO DOS RECURSOS HÍDRICOS
RESUMO: A consideração da sazonalidade do regime de ocorrência das vazões apresenta um potencial para o aumento da disponibilidade de uso dos recursos hídricos. Visando dar subsídios à otimização do uso da água, neste trabalho avaliou-se o impacto da substituição das vazões de referência anuais pelas mensais no potencial de uso de água ao longo da hidrografia de uma sub-bacia do rio Paracatu. Foi avaliado o impacto tanto na Q7,10 (vazão mínima com sete dias de duração associada a um período de retorno de dez anos) quanto na Q95 (vazão cuja frequência de excedência é de 95%). A utilização das vazões mensais em substituição às anuais tem um alto potencial para a melhoria das condições de uso dos recursos hídricos na bacia analisada. A utilização da vazão Q7,10 mensal em substituição à Q7,10 anual implica em aumentos no potencial de uso que variam de valores de cerca de 10% nos meses de menor disponibilidade até valores que excedem os 200% nos meses de maior abundância dos recursos hídricos de superfície. A utilização da vazão Q95 mensal em substituição à Q95 anual implica em variações do potencial que oscilam de reduções de até 37% nos meses de maior restrição hídrica até valores que excedem os 100% nos meses de maior abundância, logo, seu uso possibilita uma utilização mais racional e segura dos recursos hídricos.
INTRODUCTION
The potential use of water in a river is characterized by the long-term average streamflow and by the low flows. The potential water availability is estimated by the long-term average streamflow (PRUSKI & PRUSKI, 2011) and the natural water availability by the low flows (SMAKHTIN, 2001). Knowledge of these variables is essential for a proper planning and management of water resources and to reduce the conflicts among the users (NOVAES et al., 2009).
The grant, which is the legal instrument used to permit the water use, is generally done using the annual streamflow values as benchmark (SILVA et al., 2006). The use of smaller values for the water permit reduce the environmental risk, however most of the time a considerable streamflow will not be used, what prevents a most rational water use.
The grant based in streamflows estimated considering the annual period, in regions with a great seasonal variability of streamflows, limits the use of water to a value not observed in most of the year (MAIA, 2005). Studies that present options to consider the streamflow seasonal variations can serve as a basis for management agencies to optimize the water use (GÁMIZ-FORTIS et al., 2011), once it is interesting to use the water in a fair and rational way, reducing the environmental risks and improving the economic and social benefits.
TOMER & SCHILLING (2009) reported that the variation of the streamflow is directly influenced by climate variability, mainly by intra-annual variations in climate.
The substitution of benchmarks for the water diversion permit from the annual base for one monthly base may represent a significant increase in the amount water available to use (BOF et al., 2009; BOF et al., 2012; CRUZ & SILVEIRA, 2007) without to increase the environmental risk.
In order to support the water diversion permit it is essential to know the water availability along the hydrography (FIOREZE & OLIVEIRA, 2010), but this knowledge, when available, is restricted only to the sites where the stream gages stations are located, and, consequently, in general, there are no streamflow information in the sections of the hydrography where these data are required (BAENA et al., 2004). To overcome this problem, regionalization studies have been frequently used (ESLAMIAN & BIABANAK, 2008; MASIH et al., 2010; MAMUN et al., 2010; SAMUEL et al., 2011).
RODRIGUEZ et al. (2007) reported that the main water user in the Paracatu Basin, a sub-basin of the São Francisco River, is the irrigation, and noted that the annual average water withdrawal for this sector increased 62 times from 1970 to 1996. Considering the 18 sections analyzed by PRUSKI et al. (2007) along the Paracatu's Basin hydrography, the water withdrawal for irrigation in the month of highest demand corresponded to 85.1% of the Q7, 10. However, the period of greatest demand is not the same period of the lowest availability, once there is a lag between the beginning of the rainfall season and the beginning of the streamflows increase. Thus, an adjust in the use of the annual streamflow basis criterion to a monthly basis criterion must allow a significant increase in the potential of water use (OLIVEIRA, 2011).
Considering the need for information to support the process of water diversion permit, this study evaluated, along with the hydrography of a Paracatu River sub-basin, the impact of substitution of reference annual streamflow by monthly streamflow on the potential use of the water resources.
MATERIAL AND METHODS Area of Study
Paracatu Basin (ANA, 2005). Figure 1 shows the highlight of the studied area in relation to the São Francisco Basin.
The climate is predominantly tropical-rainy. Rainfall is concentrated from October to April. Maximum rainfall occurs in November, December and January. Figure 2 shows the distribution of precipitation corresponding to period 1961-1990 for the pluviometric station of Paracatu.
Data used in the study
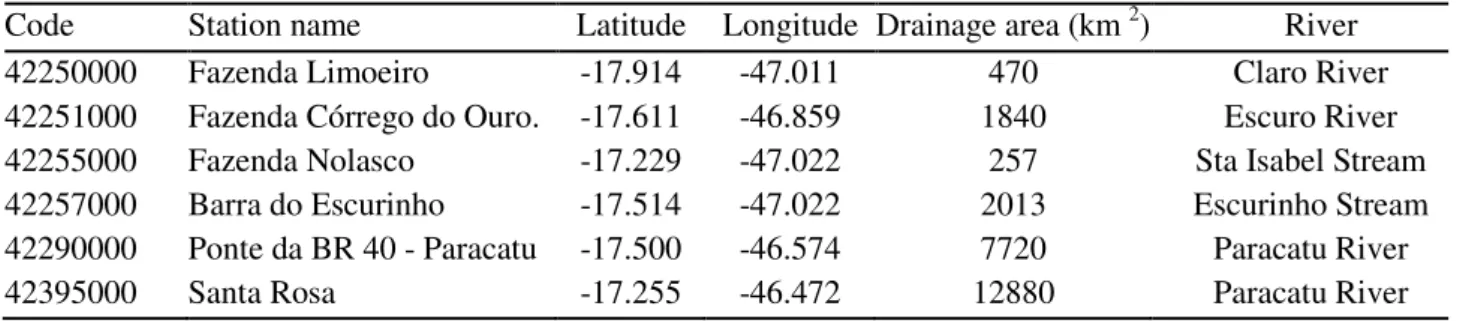
This study used data of six stream gages and 25 pluviometric stations, which are part of the hydrometeorological network of the Hydrological Information System (Hidroweb) of the National Water Agency (ANA). The stream gages used in this study are characterized in Table 1.
FIGURE 2 - Climatological normal of rainfall of Paracatu pluviometric Station.
TABLE 1 – Stream gages used in the study.
Code Station name Latitude Longitude Drainage area (km 2) River
42250000 Fazenda Limoeiro -17.914 -47.011 470 Claro River
42251000 Fazenda Córrego do Ouro. -17.611 -46.859 1840 Escuro River
42255000 Fazenda Nolasco -17.229 -47.022 257 Sta Isabel Stream
42257000 Barra do Escurinho -17.514 -47.022 2013 Escurinho Stream
42290000 Ponte da BR 40 - Paracatu -17.500 -46.574 7720 Paracatu River
42395000 Santa Rosa -17.255 -46.472 12880 Paracatu River
Comparison between monthly and annual low flows in the potential use of water
For the planning and management of water resources, and, consequently, to support the decision makers, it is essential to define properly the reference streamflows for water diversion permit.
In general, the low flows used as reference streamflows are those associated with a permanence of occurrence of 90% (Q90) or 95% (Q95) of the time and the lowest average streamflow during a 7-day period with an average recurrence of 10 years (Q7, 10) (SANTOS et al., 2006). A part of the streamflow is permitted for to the grant, and the remainder streamflow is needed for the ecosystem’s maintenance (SOUZA FILHO & CAMPOS, 1996).
After analyzing the streamflow data available, the base period 1974-2004 was selected. The analyzes performed in this study were based on consideration of the low flows Q95 and Q7, 10, and the SisCAH 1.0 software (SOUSA et al., 2009) was used to obtain these variables.
Obtaining Q7 , 10
To estimate the lowest average streamflow during a consecutive 7-day period with an average recurrence interval of ten years (Q7,10), the probability density functions (PDFs) Log-Pearson 3, Pearson 3, Normal, Lognormal 2 and Weibull were analyzed. By utilizing PDFs, the Q7,10 from an individual time series was determined as the lowest streamflow occurring in seven consecutive days (Q7) for each year by assuming a recurrent interval of 10 years. Using the Q7 for each year, the Q7,10 may be estimated.
To compute the Q7,10 on a monthly basis, the Q7 utilized was obtained for individual months of a time series, in which the Q7 events were observed in the respective month throughout the period of data collection. Afterwards, PDFs were used to compute the Q7,10 for each month.
Because five PDFs were applied to determine Q7,10, the one that showed the smallest confidence interval for the magnitude among the five estimates was selected. This procedure was performed with SisCAH 1.0 (SOUSA et al., 2009), which indicates the probability distribution that returned the best statistical adjustment associated with the period used.
Calculation of Q95
The permanence curve describes the relationship between the streamflow of a river and the frequency of occurrence of a streamflowgreater than or equal to the value of the y-coordinate. The procedure for obtaining the curve for each stream gage is based on the frequency analysis associated with data of each streamflow.
approach similar to that for Q7,10 was used. In this case, the reference analysis was performed individually for each month.
Streamflow regionalization
The dependent variables used in the streamflow regionalization were the Q7,10 and Q95, and the independent variables used were the drainage area (A), and the streamflow equivalent to the annual rainfall volume (Peq.), and that considers, in this way, both effects, the drainage area and the rainfall, in a single variable, according to equation 1.
k A P
Peq = (1)
where,
Peq - streamflow equivalent to the annual rainfall volume, m 3 s-1; P - average annual rainfall in the drainage area, mm;
A - drainage area, km 2, and
k - 31,536 is a constant that converts P to meters, A to squared meters and divided by the number of seconds per year.
The drainage area upstream from each hydrographic section was obtained using the Hydrographically Conditioned Digital Elevation Model (HCDEM) generated from planialtimetric charts of the Brazilian Institute of Geography and Statistics (IBGE) and hydrography mapped on a 1:100,000 scale.
(a) (b)
FIGURE 3 – Sites of the stream gauge stations analyzed in this study (a) and annual average spatial distribution of rainfall in the basin.
The first step in the low flows (Q7,10 and Q95) regionalization studies was the definition of homogeneous regions (MALEKINEZHAD et al., 2011) and, after that, a multiple-regression model was adjusted, when both, the linear and the potential models, were tested.
The software SisCoRV 1.0 (SOUSA, 2009) was used to obtain the multiple-regression models and, to define the best statistical adjust, the highest determination coefficient (r2) and the smallest error between the values observed and estimated were considered.
Proposal to minimize the use of extrapolation of the regionalization equations obtained
A great limitation of the regionalization is the extrapolation of the equations for basins with drainage areas smaller than those used to obtain the regionalization equations (SILVA JR. et al., 2003). Only the statistical analysis of the regionalization models is not enough to ensure an accurate estimate of the streamflow along the hydrography (LI et al., 2009). The use of procedures that allow a better understanding of the physical behavior of a process is important to extract more information from available data.
Aiming to analyze the physical behavior of the streamflow obtained in a study of regionalization, RODRIGUEZ (2008) used a threshold value for the specific low flow discharge to impose a limit on the extrapolation of the regionalization equations.
After the selection of a regionalization model, the streamflow values are reduced, when necessary, by the use of a threshold value for the specific low flow discharge. The threshold value is defined as the highest value of specific low flow discharge obtained from several stream gages in the hydrologically homogenous region considered. Thus, if the specific low flow discharge estimated in the section of the hydrography is higher that the threshold value, the low flow (Q7,10 or Q95_adj) is estimated by equation
Q_adj = A q_thr where,
Q_adj - low flow (Q7,10 and Q95) adjusted according to the threshold specific low flow discharge value, m 3 s-1;
q_thr - highest value of specific low flow discharge (q95 and q 7, 10) obtained from several stream gages in the hydrologically homogenous region considered, m 3 s-1 km-2, and
A - drainage area, km2.
Assessing the impact of substitution of annual low flows by monthly along the hydrography The comparison between the monthly streamflows and the annual streamflow was performed for each stretch of hydrography. The relative differences (DH %) between the monthly streamflows and the annual streamflow was performed for both, Q7,10 and Q95, by equation.
100 Q
Q Q
DH
annual annual monthly
%
−
= (3)
The data from DH% were divided into five intervals of classes and the rivers were colored according to these classes. A frequency analysis was also performed relating the DH% classes with its frequency of occurrence in the sections of hydrography.
RESULTS AND DISCUSSION Equations of regionalization
The regionalization equations for Q7,10 and Q95, for both, the annual and the monthly basis, are presented in Table 2. The selected variable was the drainage area, a fact that is due, mainly, to the small amplitude of variation of the annual rainfall over the basin. So, the consideration of the effect of the rainfall changes over the basin does not improve the statistical adjustment for the regionalization model.
TABLE 2 - Equations used for the regionalization of monthly and annual Q7,10 (m³ s-1) and Q95 (m³s-1) using drainage area as explanatory variable, as well as their determination coefficient (r ²)
Q7,10 r² Q 95 r ²
November Q 7, 10 = 0.0085 Área 0.8001 0.982 Q 95 = 0.0062 Área 0.9008 0.987 December Q 7, 10 = 0.0034 Área 0.9784 0.987 Q 95 = 0.0058 Área 0.9563 0.987
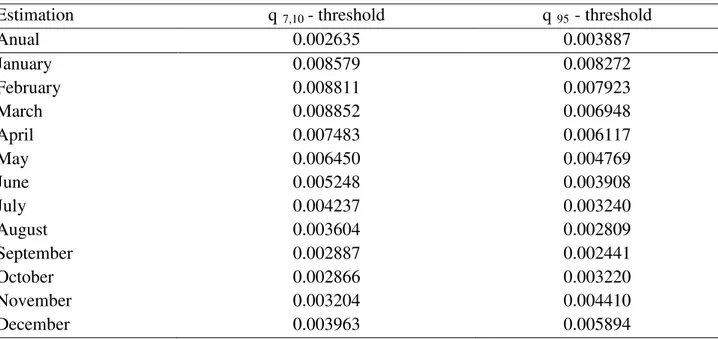
Table 3 shows the values of threshold specific low flow discharge used for reducing the risk of overestimation in regions of extrapolation of the regionalization equations, as proposed by Rodriguez (2008).
TABLE 3 - Specific low flows (m3 s-1 km-2) used as threshold for reducing the risk of overestimation of the streamflows in the regions of extrapolation
Estimation q 7,10 - threshold q 95 - threshold
Anual 0.002635 0.003887
January 0.008579 0.008272
February 0.008811 0.007923
March 0.008852 0.006948
April 0.007483 0.006117
May 0.006450 0.004769
June 0.005248 0.003908
July 0.004237 0.003240
August 0.003604 0.002809
September 0.002887 0.002441
October 0.002866 0.003220
November 0.003204 0.004410
December 0.003963 0.005894
As evidenced on Table 3, while the threshold specific low flow discharge values in the annual analysis are 0.002635 and 0.003887 m 3 s-1 km-2 for the q
7 , 10 and the q95, respectively, these values range from 0.002866 to 0.008852 m 3 s-1 km-2 for q7 , 10 and 0.002441 to 0.008272 m 3 s-1 km-2 for q95 for the analysis based on monthly streamflows.
Impact evaluation of the of the substitution of the annual Q7,10 by the monthly Q7,10
Maps of DH% for Q7,10, for the months of January and September, months when the variations of DH% are extreme, are shown in Figure 4. For the month of January (Figure 4a) the range of variation of DH% values was from 222.41% to 259.73%, with an increasing trend in the DH% values with the increase of drainage area. Thus, the use of the monthly values of Q7,10, in substitution to the annual value, represents a potential increase in the water use exceeding 220% across the hydrography. For the month of September (Figure 4b), although with a range of variation of DH% very lower (9.56% to 17.24%) that the corresponding to January, also there is the same tendency of increase in the DH% values with the increase in drainage area.
FIGURE 4 - Relative difference between January Q 7,10 and annual Q7,10 (a) and relative difference between September Q 7,10 and annual Q 7,10 (b).
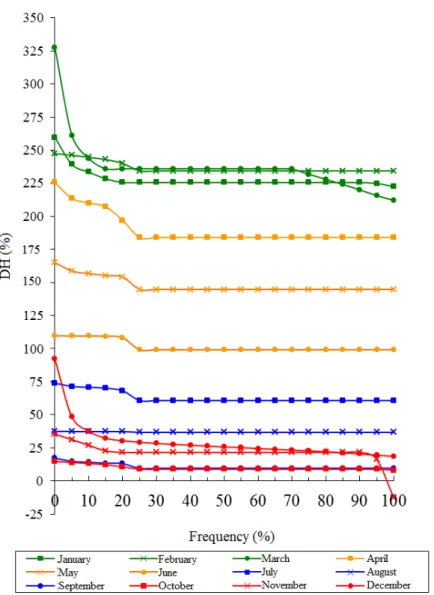
The frequency curves relating the relative differences (DH%) between Q7 , 10 monthly and Q 7, 10 annual with its frequency of occurrence in the sections of hydrography are presented in Figure 5. These curves show, for each percentage of segments of the hydrography, the DH% correspondent. Thus, for example, for the month of January, 100% of the segments of the hydrography has DH% values greater than 220%, reaching in some segments values higher than 250%.
In June and July the monthly average rainfall are very low (Figure 2), and, consequently, the irrigation becomes, during this time, the main source of water supply for crops. The increase in the potential of the water use in these months with the consideration of the monthly criterion is over 50% (Figure 5), characterizing an effective increase in the potential use of the water for the socio-economic development of the region, without any additional environmental risk, once the remaining streamflow can be maintained in the same proportion that when the Q7,10 annual is used. In January, when the potential increase for water use is maximum, and greater than 220%, obviously, does not necessarily all these additional availability it will be used.
FIGURE 5 - Frequency of occurrence of relative differences between the monthly Q 7,10 and the annual Q 7,10 considering the segments of the hydrography of the basin studied.
In November there is a reversal in the downward trend of DH% that was occurring throughout the year, reaching values higher than 20% in over 90% of the stretches. This month, however, was the only one when negative values of DH% occurred, which were associated with segments (less than 5%) with greater drainage area.
Therefore, although the rainy season in the region begins in October, only between the months of November and December there is a significant increase in Q7,10. This delay results from the fact that the soil is still very dry at the beginning of the rainy season, due to the long period of drought, and the rains that begin in October initially increases the soil moisture in the upper layers, not directly impacting the level of the water table and, therefore, do not increasing the streamflows. Therefore, there is a gap between the time when the rainy season begin and the increase in the streamflows.
The month of December had a great variation of DH% along the hydrography, and, in 5% of stretches, the DH% ranged from 48 to 92%. In more than half of the stretches the increase of DH% was greater than 25% and in all stretches the increase was greater than 18%.
Therefore, for the Q7,10, the substitution of the criterion based in the annual streamflow by the criterion based in the use of monthly streamflows allowed an increase in the water availability of about 10% in the most critical months, and in much more significant increases in other months, what, consequently, can allow a more rational use of water resources.
Considering the fact that the basin studied has a predominant use of water for irrigation, and that the main water supply is of surface water, it can be evidenced even more clearly the benefits that may result in the substitution of the criterion based in the annual streamflow by the criterion based in the use of monthly streamflows in the potential use of the water resources.
There is, in general, a negative correlation between the supply and the water demand for irrigation. The months with lower rainfall, and, consequently, with higher water deficits are the months from May to September, in which the average monthly rainfall is generally less than 30 mm. There is, therefore, a great demand to supply the crop water requirements by irrigation. Even in these months, in which the values of DH% are smaller, the increase in the potential water use by substitution of the annual criterion by the monthly criterion may allow an increase up to 150% in the water withdrawn for use by irrigation. This analysis can also be extended for an approach related to water quality, when the seasonality of launch of effluents does not coincide with the period of lowest water availability.
Therefore, the use of a criterion based on the use of a single streamflow, corresponding to an annual restriction, leads to a double jeopardy to the users. The first resulting from the imposition of a restriction of a single value of water availability for the whole year, and the second the fact that the period of highest demand for water resources does not always coincide with the period of lower water availability.
In regions such as the basin studied, where the water availability is limited and the temperature is not a factor of restriction for crop growth, the increase in the water availability is essential, and, in this scenario even the adjust of the periods with higher water requirement by the crop to not overlap with the lower availability of surface water resources can be a good option.
Considering that the water resources management agencies already grant water permit based on values variable month to month, and, considering the experience acquired in this study, we believe that the monthly criterion, respecting the seasonality of variation in streamflows along the hydrograph, can be an excellent option to improve the water use in order to reduce the conflicts among the users.
Impact evaluation of the of the substitution of the annual Q95 by the monthly Q95
Maps of DH% for Q95 for the months of January and September, months when the variations of DH% are extreme, are shown in Figure 6.
FIGURE 6 - Relative difference between Q95 of January and annual Q95 (a) and relative difference between Q95 of September and annual Q95 (b).
For January (Figure 6a) the range of variation of DH% was from 112.40 to 192.20%, and these differences showed a trend, as occurred for the Q7,10, of the DH% increase with the increase of the drainage area. September (Figure 6b), however, shows negative values of DH%, which are even more negative for the smaller drainage areas. The range of values of DH% for September was -37.20 to -27.87%.
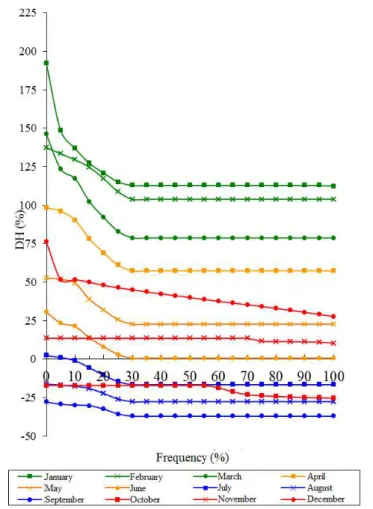
In Figure 7 are presented the frequency curves linking the relative differences (DH%) between monthly Q95 and annual Q95 with their frequency of occurrence in the stretches of the hydrography. In general, there is a significant increase in the DH% from November to June, however, in the period from July to October, negative values of DH% were observed.
The highest values of DH% for Q95 occurred in the months of the first quarter (green curves), ranging from 103 to 193%. In the second quarter (orange curves) the DH% ranges from 0 to 98% and in the third quarter (blue curves) DH% was negative, except in 10% of stretches in July, featuring a greater restriction of water use in this quarter when replacing the annual criterion by the monthly criterion. In this quarter DH% values ranged from -37 to 2%.
In October there is a reversal in the downward trend of DH% that was occurring throughout the year, but the DH% values continue negative, ranging from -25 to -17%. In November the DH% values became positive again ranging from 10 to 13%, and, in December, DH% ranged from 27 to 76%.
Compared with DH% for Q7,10, the DH% values related with the Q95 showed lower values, but, even for this variable, there is a significant increase in the water availability when considering the monthly Q95 in many months of the year.
FIGURE 7 - Frequency of occurrence of relative differences between the monthly Q95 and the annual Q95 considering the segments of hydrographic of the basin studied.
Considering the maximum withdraw permit by the National Water Agency, responsible for the water resources management of the Federal rivers in Brazil, and corresponding to 70% the annual Q95, it was verified that this value is often higher than the Q7,10. So, the use of this criterion besides to limit the water use during periods of high water availability to a restriction evidenced only in periods with low water availability, is excessively permissible in months with lower availability, when there is a high risk to the dry of the river (especially, in the case of this study, in the months of September and October). Using the criterion of 70% of the monthly Q95 this risk decreases significantly (BOF et al., 2012).
The use of a criterion based on monthly streamflows permit a better plan for water use, as it allows a greater use in the period when the water availability is higher and imposes a more realistic restriction on the critical period of water availability.
It is clear that the consideration of the estimated streamflow on a monthly basis will bring a significant increase in the work required for the quantification of water availability; however, this study has shown a high potential in the increase of the maximum allowable streamflow for the grant what justify this increase in the work necessary to quantify the water availability in a monthly basis. CONCLUSIONS
The use of criteria based on monthly low flows, instead the annual low flow, has a great potential to increase the water resources use;
The use of monthly Q95, replacing the annual Q95 value, implies changes in water resources potential use that range since reductions of 37% (months with lower water availability) until increases greater than 100% (months with higher availability);
The use of monthly Q95 enables a more rational and safe use of water resources in comparison to the annual Q95.
REFERENCES
ANA - AGÊNCIA NACIONAL DE ÁGUAS. Diagnóstico da outorga de direito de uso de recursos hídricos no país. Diretrizes e prioridades. 2005. Disponível em:
<http://www.ana.gov.br/pnrh_novo/documentos/07%20Outorgas/VF%20Outorga.pdf>. Acesso em: 20 out. 2009.
BAENA, L. G. N.; SILVA, D. D.; PRUSKI, F. F.; CALIJURI, M. L. Regionalização de vazões com base em modelo digital de elevação para a bacia do Rio Paraíba do Sul. Engenharia Agrícola,
v.24, n.3, pp. 612-624, 2004.
BOF, L. H. N.; PRUSKI, F.F.; SILVA, L. M. C.; JUSTINO, F. Analysis of Appropriate Timescales for Water Diversion Permits in Brazil. Environmental Management, New York, v.1, p. 1-11, 2012.
doi 10.1007/s00267-012-9982-7
BOF, L. H. N.; PRUSKI F.F.; SOUZA, W. A. M. Impacto do uso de diversos critérios para a concessão de outorga. In: SIMPÓSIO BRASILEIRO DE RECURSOS HÍDRICOS, 18., 2009, Campo Grande - MS. Anais... Campo Grande: Associação Brasileira de Recursos Hídricos, 2009. 1
CD.
CRUZ, J. C.; SILVEIRA, G. L. Disponibilidade hídrica para outorga (I): avaliação por seção hidrológica de referência. REGA, v. 4, n. 2, p. 51-64. 2007.
ESLAMIAN, S., BIABANAKI, M. Low streamflow regionalization modeling. International Journal of Ecological Economics & Statistics, set./nov. 2008. Disponível em:
<http://findarticles.com/p/articles/mi_6925/is_12/ai_n28516608/>. Acesso em: 24 mar. 2010. FIOREZE, A. P.; OLIVEIRA, L. F. C. Usos dos recursos hídricos da Bacia Hidrográfica do Ribeirão Santa Bárbara, Goiás, Brasil. Pesquisa Agropecuária Tropical, v.40, n.1, p.28-35, 2010.
GÁMIZ-FORTIS, S.R.; HIDALGO-MUÑOZ, J.M.; ARGÜESO, D.; ESTEBAN-PARRA, M.J.; CASTRO-DÍEZ, Y. Spatio temporal variability in Ebro river watershed (NE Spain): Global SST as potential source of predictability on decadal time scales. Journal of Hydrology, 409, p.759-775.
2011.
LI, Z., LIU, W., ZHANG, X., ZHENG, F. Impacts of land use change and climate variability on hydrology in an agricultural catchment on the Loess Plateau of China. Journal of Hydrology, v.
377, p.35- 42, 2009.
MAIA, J.L ; MAUAD, F. F. ; BARBOSA, A. A. . Estabelecimento de vazões de outorga na Bacia Hidrográfica do Alto Sapucaí, com a Utilização de Sazonalidade. In: SIMPÓSIO BRASILEIRO DE RECURSOS HÍDRICOS, 16., 2005, João Pessoa - PB. Anais... 2005.
MALEKINEZHAD, H., NACHTNEBEL, H. P., KLIK, A. Comparing the index flood and multiple regression methods using L-moments. Physics and Chemistry of the Earth, 36, 54-60. 2011.
MAMUN, A. A.; HASHIM, A.; DAOUD, J. I. Regionalisation of low streamflow frequency curves for the Peninsular Malaysia. Journal of Hydrology, v. 381, p.174-180, 2010.
NOVAES, L. F.; PRUSKI, F. F.; QUEIROZ, D. O. de; RODRIGUEZ, R. del G.; SILVA D. D.; RAMOS M. M. Modelo para a quantificação da disponibilidade hídrica: parte 1 – obtenção da equação de recessão. Revista Brasileira de Recursos Hídricos, v.14, n.1, p.15-26, 2009.
OLIVEIRA, J. R. S. Otimização do aproveitamento da disponibilidade de águas superficiais na
bacia do ribeirão Entre Ribeiros. 2011. 86 f. Dissertação (Mestrado em Engenharia Agrícola) –
Universidade Federal de Viçosa, Viçosa, 2011.
PRUSKI, F.F.; PRUSKI, P.L. Tecnologia e inovação frente a gestão de recurso hídricos. In: MEDEIROS, S. DE S.; GHEYI, H.R; GALVÃO, C. DE O.; PAZ, V.P.S. (Eds). Recursos hídricos
em regiões áridas e semiáridas. Instituto Nacional do Semiárido, Campina Grande, p.27-58. 2011.
PRUSKI, F. F.; RODRIGUEZ, R. del G.; NOVAES, L. F.; SILVA D. D.; RAMOS M. M.; TEIXEIRA A. F. Impacto das vazões demandadas pela irrigação e pelos abastecimentos animal e humano, na bacia do Paracatu. Revista Brasileira de Engenharia Agrícola e Ambiental, v.11, n.2,
p.199-210, 2007.
RODRIGUEZ, R. del G.; PRUSKI,, F. F.; NOVAES, L. F.; RAMOS M. M.; SILVA D. D.; TEIXEIRA A. F. Estimativa da demanda de água nas áreas irrigadas da bacia do rio Paracatu.
Engenharia Agrícola, v.27, n.1, p.172-179, 2007.
RODRIGUEZ, R. del G. Proposta conceitual para a regionalização de vazões. 2008. 254 f. Tese
(Doutorado em Engenharia Agrícola) – Universidade Federal de Viçosa, Viçosa, 2008.
SAMUEL, J.; COULIBALY, P.; METCALFE, R. A. Estimation of continuous streamstreamflow in Ontario ungauged watersheds: comparison of regionalization methods. Journal of Hydrologic
Engeneering, v.16, p.447 (13 pages). 2011
SANTOS, E. H. M.; GRIEBELER, N. P.; OLIVEIRA, L. F. C. Relação entre uso do solo e comportamento hidrológico na Bacia Hidrográfica do Ribeirão João Leite. Revista Brasileira de
Engenharia Agrícola e Ambiental, v.14, n.8, p.826–834, 2010.
SILVA, A.M., DE OLIVEIRA, P.M., De Mello, C.R., PIERANGELI, C. Vazões mínimas e de referência para outorga na região do Alto Rio Grande, Minas Gerais. Revista Brasileira de
Engenharia Agrícola e Ambiental, 10(2), p. 374-380. 2006.
SILVA JÚNIOR, O.B.; BUENO, E.O.; TUCCI, C.E.M.; CASTRO, N.M.R. Spacial extrapolation in discharge regionalisation. Revista Brasileira de Recursos Hídricos, Porto Alegre: ABRH. 8 (1)
Jan./Mar., 21-37. 2003.
SMAKHTIN, V.U. Low streamflow hydrology: a review. Journal of Hydrology. 240, 147-186.
2001.
SOUSA, H. T. Sistema computacional para regionalização de vazões. 2009. 86 f. Dissertação
(Mestrado em Engenharia Agrícola) – Universidade Federal de Viçosa, Viçosa – MG, 2009. SOUSA, H. T.; PRUSKI, F. F.; BOF, L. H. N.; CECON, P. R.; SOUZA, J. R. C. SisCAH: Sistema
computacional para análises hidrológicas. Brasília, DF, Agência Nacional de Águas, 2009. 60 p. SOUZA FILHO, F.A.; CAMPOS, J. N. B. A outorga como instrumento de gestão: estudo de caso. In: SIMPÓSIO DE RECURSOS HÍDRICOS DO NORDESTE, 3., 1996, Salavador. Anais...
Salvador: ABRH, 1996. p. 327-333.