https://doi.org/10.1007/s10329-019-00724-1
ORIGINAL ARTICLE
A comparison of methods to determine chimpanzee home‑range
size in a forest–farm mosaic at Madina in Cantanhez National Park,
Guinea‑Bissau
Wilson F. Vieira1,2 · Chris Kerry3 · Kimberley J. Hockings1,4
Received: 30 March 2018 / Accepted: 1 April 2019 / Published online: 13 April 2019 © The Author(s) 2019
Abstract
Human activities impact the distribution of numerous species. Anthropogenic habitats are often fragmented, and wildlife must navigate through human-influenced and ‘natural’ parts of the landscape to access resources. Different methods to determine the home-range areas of nonhuman primates have not considered the additional complexities of ranging in anthro-pogenic areas. Here, using 6 months of spatial data on the distribution of chimpanzee presence (feces, feeding traces, nests, opportunistic encounters; n = 833) collected across the wet and dry seasons, we examine different analytical techniques to calculate the home-range size of an unhabituated chimpanzee (Pan troglodytes verus) community inhabiting a forest–farm mosaic at Madina, Cantanhez National Park in Guinea-Bissau. The minimum convex polygon method and the grid cell (500 m × 500 m cell size) method estimated the chimpanzees home-range size at 19.02 and 15.50 km2, respectively with kernel analysis calculating a lower value of 8.52 km2. For the grid cell method, home-range estimates varied with cell size, with larger cells producing larger estimates. We compare our home-range estimates with other chimpanzee research sites across Africa. We recommend the use of kernel analysis for determining primate home ranges, especially for those groups exploiting fragmented habitats including forest–farm mosaics, as this method takes account of inaccessible or infrequently used anthropogenic areas across the complete home range of the primate group. However, care must be taken when using this method, since it is sensitive to small sample sizes that can occur when studying unhabituated communities, resulting in underestimated home ranges.
Keywords Primate home-range analysis · Chimpanzees · Anthropogenic habitats · Habitat fragmentation · Human–wildlife interactions
Introduction
An animal’s home range is an area used to forage for food, search for mating partners, and raise offspring (Burt 1943). Home-range sizes can fluctuate over time (seasonally or
yearly) depending on environmental conditions (e.g., cli-mate) and habitat type, among other things (Newton-Fisher 2003; Wingfield 2005). Home-range size can also be influ-enced by anthropogenic changes to the environment and human presence. For example, habitat loss and fragmenta-tion have reduced movements in numerous mammal spe-cies worldwide (Tucker et al. 2018). The abundance of food items in certain anthropogenic landscapes (e.g., urban or agricultural habitats) has led to some species reducing their home ranges due to high resource abundance and lack of natural competitors [e.g., raccoon (Procyon lotor): Prage et al. (2004); Badger (Meles meles): Šálek et al. (2015)]. However, some anthropogenic disturbance factors (e.g., commercial logging and road networks) reduce natural food availability and drive some species to increase their home range to meet their nutritional needs [e.g., woodland caribou * Kimberley J. Hockings
1 Centre for Research in Anthropology (CRIA NOVA FCSH),
Lisbon, Portugal
2 Faculty of Social Sciences and Humanities, New University
of Lisbon, Lisbon, Portugal
3 Environment and Sustainability Institute, University
of Exeter, Penryn, Cornwall, UK
4 Centre for Ecology and Conservation, University of Exeter,
(Rangifer tarandus caribou): Leblond et al. (2013); black grouse (Tetrao tetrix): Baines and Richardson (2007)].
Some of the most threatened nonhuman primate (hereaf-ter primate) species inhabit fragmented forest habitats that are impacted by human activities (Estrada et al. 2017). It is crucial that scientific research examines how habitats are altered by humans (including changes to food supply) and how primates respond (including how their home ranges are impacted), to implement long-term and effective conserva-tion measures (McLennan et al. 2017). In primate species, home-range size is positively associated with body size, with omnivores and frugivores generally having larger home ranges than folivores (Milton and May 1976). Additionally, for a given species, home-range size varies inversely with habitat quality and food abundance [e.g., Cebus capucinus: McKinney (2011); Macaca fascicularis: Sha and Hanya (2013)]. On the other hand, due to the accessibility of energy-rich food resources and a lack of competitors, pri-mate home ranges are often smaller for groups inhabiting agricultural-forest mosaics than those in more intact habi-tats [e.g., Cercopithecus albogularis labiatus: Nowak et al. (2014); Chlorocebus pygerythrus: Saj et al. (1999); Papio
cynocephalus: Altmann and Muruthi (1988); Papio ursinus: Hoffman and O’Riain (2011); Pongo abelli: Campbell-Smith et al. (2011a, b)].
Chimpanzees (Pan troglodytes) are behaviorally flexible and are able to exploit human-influenced habitats (Hock-ings et al. 2012; 2015; McLennan and Hill 2012; McLen-nan et al. 2017; Sousa et al. 2011). They are large-bodied primates with broad diets that consist mostly of ripe fruit, but also include other plant parts in their diet, such as leaves, pith, and flowers, plus both vertebrate and invertebrate prey (Goodall 1986; Morgan and Sanz 2006; Pruetz 2006; Stan-ford and Nkurunungi 2003; Tutin et al. 1997; Watts et al. 2012; Wrangham et al. 1991). Chimpanzees inhabiting forest–farm mosaics often incorporate cultivated foods as part of their feeding strategy [e.g., Bossou in Guinea: Hock-ings et al. (2009); Bulindi in Uganda: McLennan (2013); Cadique-Caiquene in Guinea-Bissau: Bessa et al. (2015)]. Chimpanzees live in social groups (“communities”) charac-terized by high fission–fusion dynamics, forming temporary parties that vary in size, composition, and duration (Goodall 1986; Lehmann et al. 2007; Wrangham 1986) with indi-viduals sharing a common home range. This social strategy allows them to respond quickly by adjusting party sizes to environmental change, including anthropogenic processes (Hockings et al. 2012; Lehmann and Boesch 2004).
Despite numerous studies of chimpanzee flexibility in response to humans and their activities (see, Hockings et al. 2015), little is known about home-range sizes in chim-panzee communities inhabiting anthropogenic habitats. Chimpanzees inhabiting farm–forest mosaics might have smaller home ranges compared to those inhabiting more
intact forests as: (1) energy-rich agricultural crops, which are clumped in distribution, might minimize travel distances in search of food; and (2) roads, settlements, and large agri-cultural areas might act as barriers to movement. On the other hand, under certain conditions (e.g., no neighboring chimpanzee communities, and travel routes with sufficient vegetation cover), chimpanzees might range further in search of additional food resources.
Chimpanzee home-range sizes are large, on average, compared to those of most other primates (Harvey and Clutton-Brock 1981), and typically fall between 10 and 40 km2 (Amsler 2009). However, significant variability has been found in chimpanzee home-range sizes, from 3.1 km2 for the Taï Middle community (lowland forest, Ivory Coast) (Herbinger et al. 2001) to 63 km2 for the Fongoli community (savannah habitat, Senegal) (Pruetz 2006). Various social and ecological factors, including the distribution and avail-ability of food, predation risk, and community size and com-position, affect chimpanzee ranging and home-range size (Bertolani 2013; Lehmann and Boesch 2003).
Numerous methods have been used to examine primate home-range size and distribution, including minimum con-vex polygon (MCP) method, grid cell (GC) method, and kernel analysis.
MCP is a simple and frequently used method to estimate home-range size (Hayne 1949; Powell 2000). It is a non-sta-tistical method that consists of creating a polygon with inter-nal angles lower than 180º from the GPS points, producing an empirical estimate of the home-range size (Mohr 1947). Although widely used, which enables comparisons amongst study sites, this method presents several disadvantages: (1) it is highly sensitive to the sample size, resulting in home-range estimates increasing incrementally with the number of GPS locations collected, (2) it is sensitive to “outliers”, consequently occasional excursions can significantly influ-ence the estimated home range, (3) it assumes that the home range is a convex polygon, which includes areas unused by the animals, thus overestimating their home range (Anderson 1982; Barg et al. 2005; Börger et al. 2006; Herbinger et al. 2001; Worton 1995a).
GC is another widely used method. It superimposes a grid with a mesh of a chosen size over the area in which traces of a species are found. The area is calculated by multiply-ing the sum of cells that contain traces by the area of a sin-gle cell (Chapman and Wrangham 1993; Montanari 2014). In contrast to MCP, this method can reveal the intensity of utilization of areas within the home range (Bailey and Gatrell 1995; Mizutani and Jewell 1998). However, it can be chal-lenging to select an appropriate cell size. Although large-sized cells help to identify home-range patterns, information on the internal utilization of the habitat might be lost. Conversely, smaller cell sizes can reveal areas of intense utilization, but the high variability of quadrat counts might lead to difficulties in
interpretation (Bailey and Gatrell 1995; Herbinger et al. 2001; Mizutani and Jewell 1998). A large cell size of 500 m × 500 m is frequently used to examine home-range patterns in large-bodied mammals, including chimpanzees, and is also appro-priate for small sample sizes (Amsler 2009; Basabose 2005; Lehmann and Boesch 2003, 2005; Mizutani and Jewell 1998; Thompson et al. 2007).
Kernel analysis is based on the concept of utilization dis-tribution (Van Winkle 1975). It determines the probability of finding a particular individual or group at a particular location by systematically collecting GPS data on observed locations, then using these data to calculate how intensively the group or individual use each area over time. It generates isopleths (areas demarcating regions on the map with a given probability of finding individuals) that indicate specific areas that together account for a given percentage of overall home-range occupa-tion time (Anderson 1982; Seaman and Powell 1996; Worton 1987; Worton 1995b). Thus, the main function of this method is the probability of finding a positional point. The area is cal-culated using percentage isopleths indicating the intensity of utilization of an area and uniting a set of location points into a continuous surface.
Some authors suggest that statistical methods of home-range estimation, like kernel analysis, must follow the assump-tion that all the locaassump-tions are independent (Swihart and Slade 1985a, b), which can be overcome by sub-sampling the dataset (Herbinger et al. 2001; Newton-Fisher 2003). However, since ranging is not an independent phenomenon, subsampling can have a substantial influence on the results (e.g., changes on distribution of locations) leading to loss of important informa-tion on animals’ distribuinforma-tion (Barg et al. 2005; Blundell et al. 2001; Cushman et al. 2005; De Solla et al. 1999). There is an ongoing debate regarding the importance of independent locational data; however, an agreed solution to improve the accuracy of kernel analysis is to increase sample size (Amsler 2009; Bertolani 2013; Montanari 2014).
Here, we test three different spatial analytical techniques (minimum convex polygon; grid cell analysis and kernel analy-sis) to examine the home-range size of an unhabituated and unstudied chimpanzee community living in a forest–agricul-tural mosaic habitat at Madina in Cantanhez National Park, Guinea-Bissau. We then compare the home-range size of this community to that of other chimpanzee communities inhabit-ing different habitat types with varyinhabit-ing degrees of anthropo-genic exposure, to better understand how this species might respond to human-induced change.
Methods
Study Site
Cantanhez National Park (CNP) is located in the south-western region of Tombali (northeast limit 11°22′58″, 14°46′12″W and southwest limit 11º02′18″N, 15º15′58″W) in Guinea-Bissau, covering an area of approximately 1067 km2 (Cantanhez National Park Management Plan 2017). There are two main seasons in this region; the dry season occurs from November to mid-May and the wet season from mid-May to October. Seven species of pri-mate inhabit CNP: western chimpanzee (Pan troglodytes
verus), red colobus (Procolobus badius temminckii), black
and white colobus (Colobus polykomos), Guinea baboon (Papio papio), green monkey (Chlorocebus aethiops
sabaeus), Campbell’s monkey (Cercopithecus campbelli);
and Senegalese bushbaby (Galago senegalensis) (Da Silva et al. 2014; Gippoliti and Dell’Omo 1996; Minhós et al. 2013). From the availability of suitable chimpanzee habi-tat in the Tombali region (CNP, Catio and Cacine), it is estimated that there are between 376 and 2632 chimpan-zees (Torres et al. 2010). CNP has an estimated total of 400 chimpanzee (Casanova and Sousa 2007; Hockings and Sousa 2012) and marked-nest analysis suggests that between 17 and 106 of these are present in four forest areas in the central-southern part of the NP (Lauchande, Cadique, Caiquene, and Madina) (Sousa et al. 2011).
In CNP, the local human density is approximately 21 people/km2, with a population of around 24,000 people, distributed across 110 villages (Cantanhez National Park Management Plan 2017; Hockings and Sousa 2013). Deforestation and habitat fragmentation caused by slash-and-burn agriculture and clearing fields for cashew plan-tations is one of the main threats to the survival of pri-mate species living in CNP (Hockings and Sousa 2012). Despite this, CNP includes some of the most well-pre-served patches of primary sub-humid forests in the country (Oom et al. 2009; Temudo 2009), along with savannah, mangroves, evergreen, and semi-deciduous forests (Cata-rino 2004; Gippoliti and Dell’Omo 2003). Furthermore, some local ethnic groups, including the Nalu, hold tradi-tional protective beliefs toward chimpanzees that prevent them from being hunted (Sousa and Frazão-Moreira 2010; Sousa et al. 2014). All ethnic groups (except the Balanta) hold Islamic beliefs that prohibit the killing and eating of primates (Parathian et al. 2018).
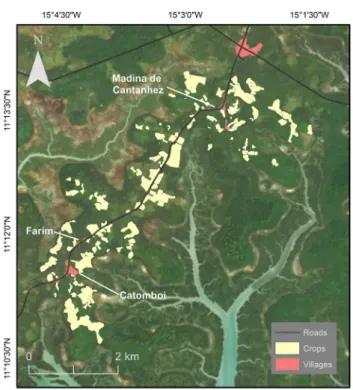
The study area of Madina de Cantanhez (here-after Madina), Farim and Catomboi (lati-tude: 11°13′N–11º19′N–11º11′N; longi(lati-tude: 15 03′W–15º07′W–15º04′W) (Fig. 1) was selected based on preliminary research that estimated the location of
potential chimpanzee communities in central-southern CNP (Hockings and Sousa 2013). The area is ethnically diverse: most inhabitants of Madina are Madinga or Fula, although members of other groups (e.g., Susso, Balanta) are also present, while most inhabitants of Farim and Catomboi are Nalu (Sousa et al. 2014). Based on surveys carried out during this study, there are approximately 554 inhabitants in the three villages. The surveyed area repre-sents a highly fragmented landscape with at least 175 cul-tivated fields (mapped during this research) and sub-humid mature forest, secondary forest, and mangroves (Fig. 1). It is divided by a main road, which is frequently used by pedestrians and vehicles.
The Madina chimpanzee community is unhabituated to researchers. However, encounters between chimpanzees and local people occur on a daily basis especially when chimpan-zees’ cross roads and enter agricultural areas or the village to feed on crops.
Survey area and study period
The survey area was chosen and delineated based on (1) knowledge acquired through our long-term presence in the area, (2) reports from local people, and (3) natural and anthropogenic barriers to the chimpanzees (e.g., forest–river interface, villages). A total area of 16 km2 was available to this community. We conducted recces outside of this main
survey area and no chimpanzee signs were found. We sur-veyed 13 km2 of this area looking for direct and indirect signs of chimpanzee presence (Fig. 2). Of the surveyed area, 3.3 km2 is classified as anthropogenic including villages and cultivated fields, and 9.7 km2 is classified as ‘natural’, including mature forest, young forest, palm grove, and man-grove (Catarino et al. 2012; Fig. 1).
Human impacts on the landscape vary along a continuum (Hockings et al. 2015) and areas now under forest cover have been subjected to past use by people (e.g., for slash-and-burn farming). However, at the time of our study, chim-panzees could range in villages and cultivated areas (i.e., extensively modified) as well as areas covered by mature forest (i.e., not extensively modified). Below, we refer to these two general landscape types as “anthropogenic” and “natural”, respectively.
Data collection
We collected 6 months of data over two periods (Febru-ary–May and October–December 2017) including both dry and wet seasons. We marked the location of indirect signs of chimpanzee presence (i.e., feces, nests, and feeding traces) and direct encounters using a Garmin GPSMap 64 s device. We mostly found indirect signs during surveys while direct encounters were opportunistic. Due to the already frag-mented habitat, we avoided clearing vegetation to establish linear transects. We followed pre-existing paths and crossed open areas of forest to search for chimpanzee signs. A local
Fig. 1 Locations of Madina de Cantanhez, Farim and Catomboi
vil-lages, cultivated areas, and main roads. Different shades of green and blue represent forest blocks and streams, respectively
research assistant with training in identification of wildlife traces assisted with the research.
Chimpanzee feces are usually found on chimpanzee trails, under fresh nests or in recently used areas (McGrew et al. 1988). The feces of this species are distinguishable from those of other primate species by size, color, form, and odor (Bessa et al. 2015; McLennan 2013). When we found sev-eral feces in the same area (usually along trails), which we considered to be from the same individual or party (e.g., same color and age), we marked it as a single GPS location to avoid over-estimation (McLennan 2013).
We collected data from feeding traces (e.g., fruit remains, marks on tree bark) only when we were certain that the trace belonged to chimpanzees. On most occasions, we confirmed a sign to belong to chimpanzees whenever they were asso-ciated with other evidence of chimpanzee presence (e.g., feces, knuckle prints), and when it was associated to species-specific signs (e.g., fruit wadge, tool use), or whenever it was known that an individual or a feeding party had been in the area recently (McLennan 2010; Morgan and Sanz 2006; Pruetz 2006). We recorded feeding traces that we considered to be recent (i.e., less than 3 days old) and that were not in an advanced stage of decay, except when found in a new area. This ensured that we recorded all confirmed traces found in areas not frequently exploited by the chimpanzees. For each feeding trace, we marked a GPS location. When we found several feeding traces of the same age and in the same loca-tion that could be associated with larger feeding parties, we recorded only one GPS location for independence of data (McLennan 2010).
When we located a new chimpanzee nest, we searched the surrounding area to identify nest clusters (i.e., a group of nests of the same age that lie within a radius of 30 m) (Furuichi et al. 2001). If those nests were fresh, they were likely to have been built by a chimpanzee party on the same night. For each identified cluster, we marked a single GPS point. Care was taken to not sample the same nest repeat-edly by using previous GPS points to identify recorded trees. Encounters with chimpanzee individuals were mainly opportunistic. When we heard a chimpanzee party or when-ever we knew the location of the party (e.g., through local reports), we would follow signs left by the chimpanzees. We only approached chimpanzees when we could ensure that we would cause minimal disturbance. We marked the GPS location of each encounter.
Data analysis
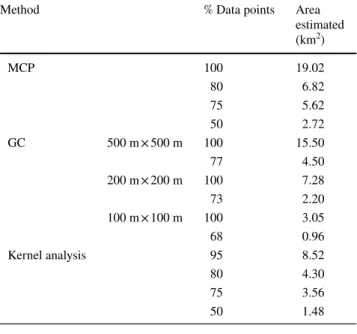
Home-range calculations with MCP and GC used 100% of the data points collected while kernel analysis used 95% of the data points (Herbinger et al. 2001; Newton-Fisher 2003; Powell 2000; Wrangham and Smuts 1980). To cal-culate core areas, we used 50%, 75%, and 80% of the data
points. For MCP analysis, we created polygons using the mcp function from the ADEhabitatHR package in Rstudio with Rv3.4.3 software. We calculated the areas of the poly-gon using the Calculate Geometry Tool of ArcMap 10.2.2. For GC analysis, we used the Create Fishnet feature of the Data Management tools in ArcMap 10.2.2. to create the grid cells with 500 m × 500 m, 200 m × 200 m and 100 m × 100 m each. We created a spatial join between the grid cell and the data on chimpanzee signs. We calculated the home range by identifying all grid cells with at least one observation recorded. The core area was established by finding cells with observations above the mean number of observations from the home-range grid cells (Montanari 2014). For kernel analysis, we calculated a kernel density raster layer using the kernel density feature from the Spatial Analyst Tool in ArcMap 10.2.2. We calculated the home range using the Iso-pleth command with 0.95 quantiles in Geospatial Modelling Environment 0.7.3. while we calculated the core areas using 0.5, 0.75, and 0.8 quantiles.
Results
Home‑range and core‑area estimates
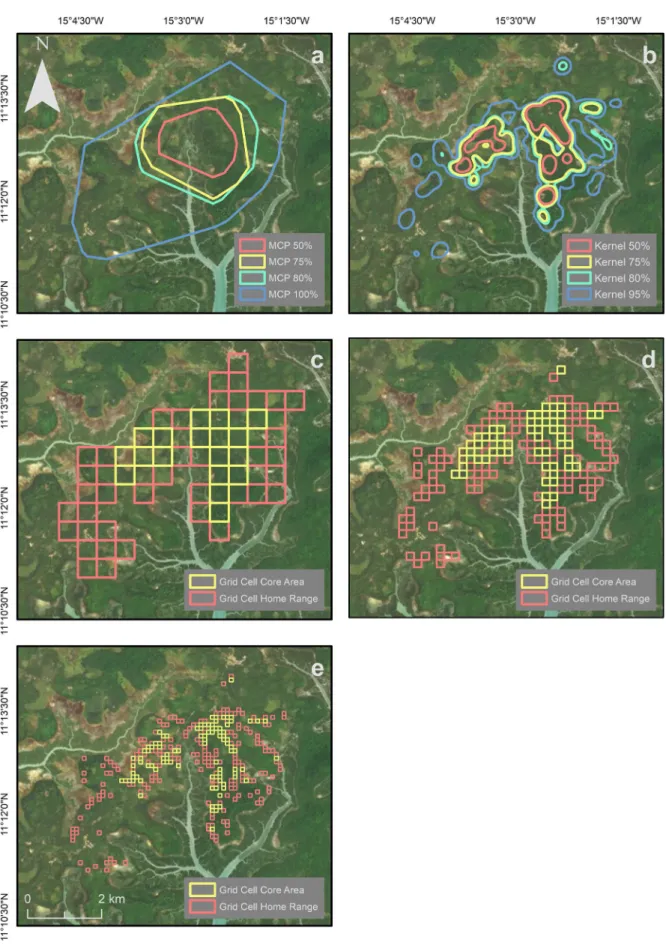
We found 833 chimpanzee traces across the study area in both natural and anthropogenic habitats. On the days that we found traces (N = 77 of 137 days), the number of traces varied with a mean of 10.8 (± SD 9.4) per day. The MCP method yielded the largest estimated home-range size, fol-lowed by the GC (500 m × 500 m) method, then kernel anal-ysis, which estimated a home-range size of less than half that of MCP (Table 1; Fig. 3). Kernel analysis more clearly demonstrates the use of habitat fragments by chimpanzees at a finer scale than the other two methods. GC method with 200 m × 200 m and 100 m × 100 m cell size provided smaller estimates than the other methods. The home-range estimate using GC 200 m × 200 m was most similar to the estimate generated using kernel analysis (Table 1; Fig. 4). Estimates for core-area sizes followed the same rank order but vary less.
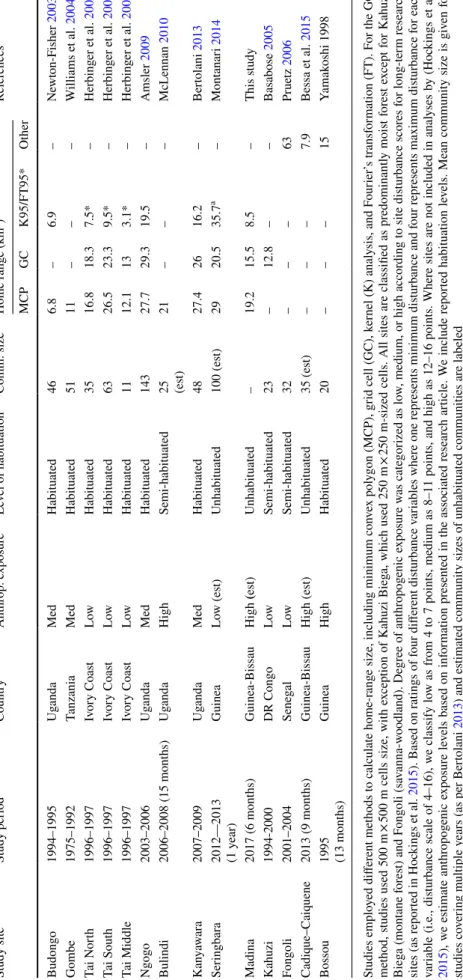
Comparison of chimpanzee study sites
The results of the home-range analysis for chimpanzees at Madina were compared with 13 other chimpanzee study sites across Africa (Table 2). Six sites were characterized as low anthropogenic exposure, four as medium anthropo-genic exposure, and three as high anthropoanthropo-genic exposure. For most sites, MCP or GC methods generated the largest estimates of home-range size, with smaller estimates using kernel analysis (but see Budongo and Seringbara) (Table 2). Home-range estimates using kernel analysis for habituated
and unhabituated chimpanzee communities inhabiting predominantly forested areas averaged 10.4 km2 (range, 3.1–19.5, N = 6 habituated communities). Chimpanzees at
Madina have a slightly smaller-than-average home-range size of 8.5 km2 compared to other chimpanzee communities.
Discussion
The methods (MCP, GC, and kernel analysis) we used to calculate the Madina chimpanzees’ home-range size produced different estimates. However, the core-range area estimates varied less. MCP method revealed an area twice the size of that calculated using kernel analysis. GC results varied according to the cell size used. Using a cell size of 500 m × 500 m, the estimated home-range area was similar to estimates generated through MCP. However, 200 m × 200 m and 100 m × 100 m cell sizes generated much smaller home-range estimates. Like most home-range esti-mates for other chimpanzee communities, at Madina kernel analysis revealed the smallest area estimates compared to other methods, except when smaller cell sizes were used for the GC method.
The landscape inhabited by chimpanzees at Madina is a mosaic of roads, villages, and cultivated fields, as well as rivers and small streams that surround the forest, giving it an irregular shape. MCP method incorporates anthropogenic and natural areas that chimpanzees cannot use. By using the peripheral points to create a polygon that represents the community’s territory, MCP overestimates home-range size. These “outliers” will have a strong effect on the home-range estimate by “stretching” the polygon (Barg et al. 2005; Har-ris et al. 1990). This issue can be overcome by eliminat-ing the “outliers” and recalculateliminat-ing the home range with a given percentage of the original dataset (Mizutani and Jewell 1998; Worton 1987; Worton 1995a), creating an area of high-density GPS locations (core areas). However, MCP cannot calculate core areas because it does not statistically identify areas of high levels of utilization.
The variation in cell size used in GC analysis influenced the overall home-range size of the chimpanzee community (Table 1). Like MCP, GC is also likely to include areas not utilized by the chimpanzees, especially with large cell sizes. Cells of 500 m × 500 m are commonly used in chimpanzee studies (Amsler 2009; Lehmann and Boesch 2005; Herbin-ger et al. 2001). However, considering the fragmented and mosaic landscape at Madina, this cell size is too large. The smallest cell size used in this research (100 m × 100 m) is ideal for determining areas of high utilization by the chim-panzees but makes it difficult to identify a home range. The 200 m × 200 m cell size seems most appropriate since it includes fewer areas that are not used by the chimpanzees (compared to 500 m × 500 m cells), but cells outside of core areas are more likely to be connected allowing better visu-alization of home ranges (compared to 100 m × 100 m cells).
Table 1 Estimates of core-range areas (km2) and home-range size
(km2) using 100% of data points for MCP and GC (with
differ-ent sized grid cells), and 95% for kernel analysis for chimpanzees at Madina, Cantanhez NP
Method % Data points Area
estimated (km2) MCP 100 19.02 80 6.82 75 5.62 50 2.72 GC 500 m × 500 m 100 15.50 77 4.50 200 m × 200 m 100 7.28 73 2.20 100 m × 100 m 100 3.05 68 0.96 Kernel analysis 95 8.52 80 4.30 75 3.56 50 1.48
Fig. 3 Home ranges calculated using three different methods:
ker-nel analysis (95%), minimum convex polygon (100%), and grid cell (500 m × 500 m)
Fig. 4 Home range and core areas calculated using a minimum convex polygon (100%, 80%, 75% and 50%); b kernel analysis (95%, 80%, 75% and 50%); c grid cell 500 m × 500 m; d grid cell 200 m × 200 m; e grid cell 100 m × 100 m
Table 2 Home-r ang e sizes of 14 c him
panzee communities, including Madina (adap
ted fr om Ber tolani 2013 ) Studies em plo yed differ ent me thods t o calculate home-r ang
e size, including minimum con
ve x pol ygon (MCP), g rid cell (GC), k er nel (K) anal ysis, and F our ier ’s tr ansf or mation (FT). F or t he GC me thod, s tudies used 500 m × 500
m cells size, wit
h e xcep tion of K ahuzi Bieg a, whic h used 250 m × 250
m-sized cells. All sites ar
e classified as pr edominantl y mois t f or es t e xcep t f or K ahuzi Bieg a (mont ane f or es t) and F ongoli (sa vanna-w oodland). Deg ree of ant hr opog enic e xposur e w as categor ized as lo
w, medium, or high accor
ding t o site dis turbance scor es f or long-ter m r esear ch sites (as r epor ted in Hoc kings e t al. 2015 ). Based on r atings of f our differ ent dis turbance v ar iables wher e one r epr
esents minimum dis
turbance and f
our r
epr
esents maximum dis
turbance f
or eac
h
var
iable (i.e., dis
turbance scale of 4–16), w
e classify lo
w as fr
om 4 t
o 7 points, medium as 8–11 points, and high as 12–16 points. Wher
e sites ar e no t included in anal yses b y (Hoc kings e t al. 2015 ), w e es timate ant hr opog enic e xposur e le
vels based on inf
or mation pr esented in t he associated r esear ch ar ticle. W e include r epor ted habituation le
vels. Mean community size is giv
en f
or
studies co
ver
ing multiple y
ears (as per Ber
tolani
2013
) and es
timated community sizes of unhabituated communities ar
e labeled a Alt hough no t specified in Mont anar i ( 2014 ), t his high v
alue could be due t
o t he c hoice of smoo thing par ame ter whic h is leas t sq uar es cr oss v
alidation (i.e., a calculation f
or ho w big eac h cell is wit hin the ker nel and ho w neighbor ing cells influence the focal cell). If ther e w er e f ew dat a, this could ha ve resulted in lar ge cell sizes and str etc hing of the dat a, especiall y if dat a points wer e sk ew ed t ow ar ds t he edg e of t he ter rit or y * F our ier ’s tr ansf or mation Study site Study per iod Countr y Ant hr op. e xposur e Le vel of habituation Comm. size Home r ang e (km 2) Ref er ences MCP GC K95/FT95* Ot her Budongo 1994–1995 Ug anda Med Habituated 46 6.8 – 6.9 – Ne wt on-F isher 2003 Gombe 1975–1992 Tanzania Med Habituated 51 11 – – – W illiams e t al. 2004 Tai N or th 1996–1997 Iv or y Coas t Low Habituated 35 16.8 18.3 7.5* – Herbing er e t al. 2001 Tai Sout h 1996–1997 Iv or y Coas t Low Habituated 63 26.5 23.3 9.5* – Herbing er e t al. 2001 Tai Middle 1996–1997 Iv or y Coas t Low Habituated 11 12.1 13 3.1* – Herbing er e t al. 2001 Ngogo 2003–2006 Ug anda Med Habituated 143 27.7 29.3 19.5 – Amsler 2009 Bulindi 2006–2008 (15 mont hs) Ug anda High Semi-habituated 25 (est) 21 – – – McLennan 2010 K an ya war a 2007–2009 Ug anda Med Habituated 48 27.4 26 16.2 – Ber tolani 2013 Ser ingbar a 2012––2013 (1 y ear) Guinea Lo w (es t) Unhabituated 100 (es t) 29 20.5 35.7 a – Mont anar i 2014 Madina 2017 (6 mont hs) Guinea-Bissau High (es t) Unhabituated – 19.2 15.5 8.5 – This s tudy K ahuzi 1994-2000 DR Congo Low Semi-habituated 23 – 12.8 – – Basabose 2005 Fongoli 2001–2004 Seneg al Low Semi-habituated 32 – – – 63 Pr ue tz 2006 Cadiq ue–Caiq uene 2013 (9 mont hs) Guinea-Bissau High (es t) Unhabituated 35 (es t) – – – 7.9 Bessa e t al. 2015 Bossou 1995 (13 mont hs) Guinea High Habituated 20 – – – 15 Yamak oshi 1998
Kernel analysis has been proposed as the most accurate method to calculate home-range sizes (Seaman and Powell 1996; Worton 1987, 1989, 1995b), although issues of small datasets and the independence of data points must be care-fully considered (Bertolani 2013). In this study, we suggest that MCP and GC using large-sized cells of 500 m × 500 m might be inappropriate for understanding primate home ranges in anthropogenic mosaic landscapes. Although we show that smaller-sized cells can better represent chimpan-zees’ home ranges, we do not advise the use of this method due to the subjectivity of choosing the “ideal” cell size for a given habitat. Kernel analysis more accurately represented the locations of traces found during this study and hence provides a more realistic estimation of the home-range size of this community. This research recommends that the home range of the Madina chimpanzees is taken as approximately 8.5 km2 with a core area (using kernel analysis of 75% of the data points) of 3.6 km2.
We recognize some issues that may influence our results. Increasing sample size maximizes the reliability of kernel analysis (Amsler 2009; Montanari 2014). Our results rely on 833 chimpanzee locations collected on 77 days (although the overall study period was longer). This small sample size may have led to an underestimation of the chimpanzees’ home-range area. A longer study period would ultimately increase the amount of data collected and the accuracy of estima-tions. Approximately 3 km2 of the forest at Madina (which the chimpanzees were likely to use) was not surveyed due to inaccessibility. Complementary data collection methods (e.g., camera–traps) might solve this problem and ensure all parts of the landscape are included in home-range estimates.
The home range of the Madina chimpanzee community was compared to 13 other studies of chimpanzee home-range areas across Africa. Although three sites (Caiquene-Cadique, Bulindi, and Bossou) provide information on home-range size for chimpanzees inhabiting sites with high human impact, kernel analyses were not used. This makes comparisons difficult. The home-range estimate for Madina is similar to some other sites including Budongo, Tai North, and Tai South (Table 2). The use of different analytical tools and environmental factors might limit the reliability of com-parisons between study sites (De Luca et al. 2010; Kolodzin-ski et al. 2010; Newton-Fisher 2003). Different factors, such as sampling effort, level of habituation to human observers, and study length, make comparisons between sites prob-lematic (Börger et al. 2006). Also, categorizing the degree of anthropogenic exposure at any site is complex, and our measure of anthropogenic exposure (as taken from Hock-ings et al. 2015) is crude. Different sites will have histori-cally been impacted and continue to be impacted by human activity in different ways, which will affect chimpanzee ranging. Without a standardization of methods to estimate home-range size across chimpanzee sites, the influence of
environmental and anthropogenic factors on chimpanzee distribution is difficult to predict in the face of increasing human pressure. This is important, as increasing human populations and human activity across tropical Africa will continue to force chimpanzee communities into more frag-mented and disturbed habitats.
Acknowledgements We thank the field assistants Dula Camará and
Mamadu Cassamá for their contribution to this project, and the local community at Madina for being so welcoming during our stay. We also thank Amélia Frazão-Moreira who shared her knowledge about local traditions, and Joana Bessa and Hellen Bersacola who offered practical advice during fieldwork. We are grateful to the Instituto da Biodiversidade e das Áreas Protegidas (IBAP) for support with field logistics. The authors were supported by a fellowship and research grant (IF/01128/2014) from Fundação para a Ciência e a Tecnologia (FCT), Portugal, to Kimberley Hockings. All research involving wild chimpanzees was non-invasive and strictly adhered to ethics guidelines detailed by the Association for the Study of Animal Behaviour (UK). Permission to carry out this fieldwork was granted by the Instituto da Biodiversidade e das Áreas Protegidas (IBAP) and adheres to the legal requirements of Guinea-Bissau in which the research was conducted. In this study we used the World Imagery Basemap from ArcGIS 10.2.2. Sources: Esri, DigitalGlobe, GeoEye, i-cubed, USDA FSA, USGS, AEX, Getmapping, Aerogrid, IGN, IGP, swisstopo, and the GIS User Community.
Funding The authors were supported by a fellowship and research
grant (IF/01128/2014) from Fundação para a Ciência e a Tecnologia (FCT), Portugal, to Kimberley Hockings.
Compliance with ethical standards
Conflict of interest The authors declare that they have no conflicts of
interest.
Open Access This article is distributed under the terms of the
Crea-tive Commons Attribution 4.0 International License (http://creat iveco
mmons .org/licen ses/by/4.0/), which permits unrestricted use,
distribu-tion, and reproduction in any medium, provided you give appropriate credit to the original author(s) and the source, provide a link to the Creative Commons license, and indicate if changes were made.
References
Altmann J, Muruthi P (1988) Differences in daily life between semipro-visioned and wild-feeding baboons. Am J Primatol 15:213–221 Amsler SJ (2009) Ranging behavior and territoriality in chimpanzees
at Ngogo, Kibale National Park, Uganda. Doctoral Dissertation, University of Michigan
Anderson DJ (1982) The home range: a new nonparametric estimation technique: ecological archives E063–001. Ecology 63:103–112 Bailey TC, Gatrell AC (1995) Interactive spatial data analysis, vol 413.
Longman Scientific and Technical, Essex
Baines D, Richardson M (2007) An experimental assessment of the potential effects of human disturbance on Black Grouse Tetrao tetrix in the North Pennines, England. Ibis 149:56–64
Barg JJ, Jones J, Robertson RJ (2005) Describing breeding territories of migratory passerines: suggestions for sampling, choice of esti-mator, and delineation of core areas. J Anim Ecol 74:139–149
Basabose AK (2005) Ranging patterns of chimpanzees in a montane forest of Kahuzi, Democratic Republic of Congo. Int J Primatol 26:33–54
Bertolani MP (2013) Ranging and travelling patterns of wild chimpan-zees at Kibale, Uganda: a GIS approach. Doctoral Dissertation, University of Cambridge
Bessa J, Sousa C, Hockings KJ (2015) Feeding ecology of chim-panzees (Pan troglodytes verus) inhabiting a forest-mangrove-savanna-agricultural matrix at Caiquene-Cadique, Cantanhez National Park, Guinea-Bissau. Am J Primatol 77:651–665 Blundell GM, Maier JA, Debevec EM (2001) Linear home ranges:
effects of smoothing, sample size, and autocorrelation on kernel estimates. Ecol Monogr 71:469–489
Börger L, Franconi N, Ferretti F, Meschi F, Michele GD, Gantz A, Coulson T (2006) An integrated approach to identify spatiotem-poral and individual-level determinants of animal home range size. Am Nat 168:471–485
Burt WH (1943) Territoriality and home range concepts as applied to mammals. J Mammal 24:346–352
Campbell-Smith G, Campbell-Smith M, Singleton I, Linkie M (2011a) Apes in space: saving an imperilled orangutan popula-tion in Sumatra. PLoS ONE 6:e17210
Campbell-Smith G, Campbell-Smith M, Singleton I, Linkie M (2011b) Raiders of the lost bark: orangutan foraging strategies in a degraded landscape. PLoS One 6:e20962
Cantanhez National Park Management Plan (2017) Plano de Gestão
do Parque Nacional de Cantanhez (2017–2022). https ://ibapg
bissa u.org/PDFS/legis lacao /plano sgesta oap/Plano
-de-Gesta o-de-PNC.pdf. Accessed 10 July 2017
Casanova C, Sousa C (2007) Plano de acção nacional para a con-servação das populações de chimpanzés, colóbus vermelhos ocidentais e colóbus brancos e pretos ocidentais na República da Guiné-Bissau. Instituto da Biodiversidade e das Áreas Pro-tegidas (IBAP), Guinea-Bissau
Catarino L (2004) Fitogeografia da Guiné‐Bissau. Doctoral Disserta-tion, Technical University of Lisbon
Catarino L, Cassamá V, Vasconcelos MJ, Temudo M (2012) As flo-restas do Cantanhez (Guiné-Bissau)—Vegetação, alterações do coberto do solo e utilização dos recursos naturais. Ecologia 4:43–58
Chapman CA, Wrangham RW (1993) Range use of the forest panzees of Kibale: implications for the understanding of chim-panzee social organization. Am J Primatol 31:263–273 Cushman SA, Chase M, Griffin C (2005) Elephants in space and
time. Oikos 109:331–341
Da Silva MF, Godinho R, Casanova C, Minhós T, Sá R, Bruford MW (2014) Assessing the impact of hunting pressure on population structure of Guinea baboons (Papio papio) in Guinea-Bissau. Conserv Genet 15:1339–1355
De Luca DW, Picton Phillipps G, Machaga SJ, Davenport TR (2010) Home range, core areas and movement in the ‘critically endan-gered’ kipunji (Rungwecebus kipunji) in southwest Tanzania. Afr J Ecol 48:895–904
De Solla SR, Bonduriansky R, Brooks RJ (1999) Eliminating auto-correlation reduces biological relevance of home range esti-mates. J Anim Ecol 68:221–234
Estrada A, Garber PA, Rylands AB, Roos C, Fernandez-Duque E, Di Fiore A, Rovero F (2017) Impending extinction crisis of the world’s primates: why primates matter. Sci Adv 3:e1600946 Furuichi T, Hashimoto C, Tashiro Y (2001) Extended application of
a marked-nest census method to examine seasonal changes in habitat use by chimpanzees. Int J Primatol 22:913–928 Gippoliti S, Dell’Omo G (1996) Primates of the Cantanhez Forest
and the Cacine Basin, Guinea-Bissau. Oryx 30:74–80
Gippoliti S, Dell’Omo G (2003) Primates of Guinea-Bissau, West Africa: distribution and conservation status. Primate Conserv 19:73–77
Goodall J (1986) The chimpanzees of Gombe: patterns of behavior. Harvard University Press, Cambridge
Harris S, Cresswell WJ, Forde PG, Trewhella WJ, Woollard T, Wray S (1990) Home-range analysis using radio-tracking data–a review of problems and techniques particularly as applied to the study of mammals. Mammal Rev 20:97–123
Harvey PH, Clutton-Brock TH (1981) Primate home-range size and metabolic needs. Behav Ecol Sociobiol 8:151–155
Hayne DW (1949) Calculation of size of home range. J Mammal 30:1–18
Herbinger I, Boesch C, Rothe H (2001) Territory characteristics among three neighboring chimpanzee communities in the Taï National Park, Côte d’Ivoire. Int J Primatol 22:143–167 Hockings KJ, Sousa C (2012) Differential utilization of cashew—a
low conflict crop by sympatric humans and chimpanzees. Oryx 46:375–381
Hockings KJ, Sousa C (2013) Human-chimpanzee sympatry and interactions in Cantanhez National Park, Guinea-Bissau: cur-rent research and future directions. Primate Conserv 26:57–65 Hockings KJ, Anderson JR, Matsuzawa T (2009) Use of wild and
cultivated foods by chimpanzees at Bossou, Republic of Guinea: feeding dynamics in a human-influenced environment. Am J Primatol 71:636–646
Hockings KJ, Anderson JR, Matsuzawa T (2012) Socioecological adaptations by chimpanzees, Pan troglodytes verus, inhabiting an anthropogenically impacted habitat. Animal Behav 83:801–810 Hockings KJ, McLennan MR, Carvalho S, Ancrenaz M et al (2015) Apes in the Anthropocene: flexibility and survival. Trends Ecol Evol 30:215–222
Hoffman TS, O’Riain MJ (2011) The spatial ecology of chacma baboons (Papio ursinus) in a human-modified environment. Int J Primatol 32:308–328
Kolodzinski JJ, Tannenbaum LV, Osborn DA, Conner MC, Ford WM, Miller KV (2010) Effects of GPS sampling intensity on home range analyses. Proc. Annu. Conf. Southeast. Assoc. Fish. and Wildl. Agencies 64:13–17
Leblond M, Christian D, Jean-Pierre O (2013) Impacts of human dis-turbance on large prey species: do behavioral reactions translate to fitness consequences? PLoS One 8:e73695
Lehmann J, Boesch C (2003) Social influences on ranging patterns among chimpanzees (Pan troglodytes verus) in the Tai National Park, Cote d’Ivoire. Behav Ecol 14:642–649
Lehmann J, Boesch C (2004) To fission or to fusion: effects of com-munity size on wild chimpanzee (Pan troglodytes verus) social organization. Behav Ecol Sociobiol 56:207–216
Lehmann J, Boesch C (2005) Bisexually bonded ranging in chimpan-zees (Pan troglodytes verus). Behav Ecol Sociobiol 57:525–535 Lehmann J, Korstjens AH, Dunbar RIM (2007) Fission–fusion social systems as a strategy for coping with ecological constraints: a primate case. Evol Ecol 21:613–634
McGrew WC, Baldwin PJ, Tutin CEG (1988) Diet of wild chimpanzees (Pan troglodytes verus) at Mt. Assirik, Senegal: I. Composition. Am Journal Primatol 16:213–226
McKinney T (2011) The effects of provisioning and crop-raiding on the diet and foraging activities of human-commensal white-faced capuchins (Cebus capucinus). Am J Primatol 73:439–448 McLennan MR (2010) Chimpanzee ecology and interactions with
people in an unprotected human-dominated landscape at Bulindi, western Uganda. Doctoral Dissertation, Oxford Brookes University
McLennan MR (2013) Diet and feeding ecology of chimpanzees (Pan troglodytes) in Bulindi, Uganda: foraging strategies at the for-est–farm interface. Int J Primatol 34:585–614
McLennan MR, Hill CM (2012) Troublesome neighbours: changing attitudes towards chimpanzees (Pan troglodytes) in a human-dom-inated landscape in Uganda. J Nat Conserv 20:219–227 McLennan MR, Spagnoletti N, Hockings KJ (2017) The implications
of primate behavioral flexibility for sustainable human-primate coexistence in anthropogenic habitats. Int J Primatol 38:105–121 Milton K, May ML (1976) Body weight, diet and home range area in
primates. Nature 259:459–462
Minhós T, Wallace E, Silva MJF, Sá RM, Carmo M, Barata A, Bruford MW (2013) DNA identification of primate bushmeat from urban markets in Guinea-Bissau and its implications for conservation. Biol Conserv 167:43–49
Mizutani F, Jewell PA (1998) Home-range and movements of leop-ards (Panthera pardus) on a livestock ranch in Kenya. J Zool 244:269–286
Mohr CO (1947) Table of equivalent populations of North American small mammals. Am Midl Nat 37:223–249
Montanari D (2014) Ranging patterns of Seringbara chimpanzees: methodological insights. Doctoral Dissertation, University of Utrecht
Morgan D, Sanz C (2006) Chimpanzee feeding ecology and compari-sons with sympatric gorillas in the Goualougo Triangle, Republic of Congo. In: Hohmann G, Robbins M, Boesch C (eds) Feeding ecology in apes and other primates. Cambridge University Press, Cambridge, pp 97–122
Newton-Fisher NE (2003) The home range of the Sonso community of chimpanzees from the Budongo Forest, Uganda. Afr J Ecol 41:150–156
Nowak K, le Roux A, Richards SA, Scheijen CP, Hill RA (2014) Human observers impact habituated samango monkeys’ perceived landscape of fear. Behav Ecol 25:1199–1204
Oom D, Lourenço P, Cabral AIR, Vasconcelos MJP, Catarino L, Cas-samá V, Moreira J (2009) Quantification of deforestation rates in Guinea-Bissau: a baseline for carbon trading under REDD. In 33rd International symposium on Remote Sensing of Environ-ment, 4–8 May 2009, Stresa, Italy
Parathian H, McLennan MR, Hill CM, Frazao-Moreira A, Hockings KJ (2018) Breaking through disciplinary barriers: human-wildlife inter-actions and multispecies ethnography. Int J Primatol 39:749–775 Powell RA (2000) Animal home ranges and territories and home range
estimators. In: Boitani L, Fuller TK (eds) Research techniques in animal ecology: controversies and consequences. Columbia Uni-versity Press, New York, pp 65–110
Prange S, Gehrt SD, Wiggers EP (2004) Influences of anthropogenic resources on raccoon (Procyon lotor) movements and spatial dis-tribution. J Mammal 85:483–490
Pruetz JD (2006) Feeding ecology of savanna chimpanzees (Pan trog-lodytes verus) at Fongoli, Senegal. In: Hohmann G, Robbins MM, Boesch C (eds) Feeding ecology in apes and other primates. Cam-bridge University Press, CamCam-bridge, pp 326–364
Saj T, Sicotte P, Paterson JD (1999) Influence of human food consump-tion on the time budget of vervets. Int J Primatol 20:977–994 Šálek M, Drahníková L, Tkadlec E (2015) Changes in home range sizes
and population densities of carnivore species along the natural to urban habitat gradient. Mammal Rev 45:1–14
Seaman DE, Powell RA (1996) An evaluation of the accuracy of kernel density estimators for home range analysis. Ecology 77:2075–2085
Sha JCM, Hanya G (2013) Diet, activity, habitat use, and ranging of two neighboring groups of food-enhanced long-tailed macaques (Macaca fascicularis). Am J Primatol 75:581–592
Sousa C, Frazão-Moreira A (2010) Etnoprimatologia ao serviço da con-servação na Guiné-Bissau: o chimpanzé como exemplo. In: lves A, Souto F, Peroni N (eds) Etnoecologia em perspectiva: natureza, cultura e conservação, Recife, Brasil, NUPEEA, pp 189–200
Sousa J, Barata AV, Sousa C, Casanova CC, Vicente L (2011) Chim-panzee oil-palm use in southern Cantanhez National Park, Guinea-Bissau. Am J Primatol 73:485–497
Sousa J, Vicente L, Gippoliti S, Casanova C, Sousa C (2014) Local knowledge and perceptions of chimpanzees in Cantanhez National Park, Guinea-Bissau. Am J Primatol 76:122–134
Stanford CB, Nkurunungi JB (2003) Behavioral ecology of sympatric chimpanzees and gorillas in Bwindi Impenetrable National Park, Uganda: diet. Int J Primatol 24:901–918
Swihart RK, Slade NA (1985a) Influence of sampling interval on esti-mates of home-range size. J Wildl Manag 49:1019–1025 Swihart RK, Slade NA (1985b) Testing for independence of
observa-tions in animal movements. Ecology 66:1176–1184
Temudo MP (2009) A narrativa da degradação ambiental no Sul da Guiné-Bissau: uma desconstrução etnográfica. Etnográfica 13:237–264
Thompson ME, Kahlenberg SM, Gilby IC, Wrangham RW (2007) Core area quality is associated with variance in reproductive suc-cess among female chimpanzees at Kibale National Park. Animal Behav 73:501–512
Torres J, Brito JC, Vasconcelos MJ, Catarino L, Gonçalves J, Honrado J (2010) Ensemble models of habitat suitability relate chimpanzee (Pan troglodytes) conservation to forest and landscape dynamics in western Africa. Biol Conserv 143:416–425
Tucker MA, Böhning-Gaese K, Fagan WF, Fryxell JM, Van Moorter B et al (2018) Moving in the Anthropocene: global reductions in terrestrial mammalian movements. Science 359:466–469 Tutin CE, Ham RM, White LJ, Harrison MJ (1997) The primate
com-munity of the Lopé Reserve, Gabon: diets, responses to fruit scar-city, and effects on biomass. Am J Primatol 42:1–24
Van Winkle W (1975) Comparison of several probabilistic home-range models. J Wildl Manage 39:118–123
Watts DP, Potts KB, Lwanga JS, Mitani JC (2012) Diet of chimpan-zees (Pan troglodytes schweinfurthii) at Ngogo, Kibale National Park, Uganda, 1. Diet composition and diversity. Am J Primatol 74:114–129
Williams JM, Oehlert GW, Carlis JV, Pusey AE (2004) Why do male chimpanzees defend a group range? Animal Behav 68:523–532 Wingfield JC (2005) The concept of allostasis: coping with a capricious
environment. J Mammal 86:248–254
Worton BJ (1987) A review of models of home range for animal move-ment. Ecol modell 38:277–298
Worton BJ (1989) Kernel methods for estimating the utilization distri-bution in home-range studies. Ecology 70:164–168
Worton BJ (1995a) A convex hull-based estimator of home-range size. Biometrics 51:1206–1215
Worton BJ (1995b) Using Monte Carlo simulation to evaluate kernel-based home range estimators. J Wildl Manag 59:794–800 Wrangham RW (1986) Ecology and social relationships in two species
of chimpanzee. In: Rubenstein D, Wrangham R (eds) Ecological aspect of social evolution. Princeton University Press, New Jersey, pp 352–378
Wrangham RW, Smuts BB (1980) Sex differences in the behavioural ecology of chimpanzees in the Gombe National Park, Tanzania. J Reprod Fertil Suppl 28:13–31
Wrangham RW, Conklin NL, Chapman CA, Hunt KD (1991) The sig-nificance of fibrous foods for Kibale Forest chimpanzees. Phil Trans R Soc B 334:171–178
Publisher’s Note Springer Nature remains neutral with regard to