Eliana da Costa Guarda
Bachelor Degree in Biochemistry
Acidogenic fermentation of brewer’s
spent grain towards
polyhydroxyalkanoates production
Dissertation to obtain Master Degree in Biotechnology
Supervisor: Anouk F. Duque, Post-Doctoral Researcher,
FCT-UNL
Júri:
Presidente: Prof. Doutor Pedro Calado Simões Arguente: Prof. Doutora Leonor Amaral
Vogal: Doutora Anouk F. Duque
IV
Eliana da Costa Guarda
Bachelor Degree in Biochemistry
Acidogenic fermentation of brewer’s spent
grain towards polyhydroxyalkanoates
production
Dissertation to obtain Master Degree in Biotechnology
Supervisor: Anouk F. Duque, Post-Doctoral Researcher,
FCT-UNL
Júri:
Presidente: Prof. Doutor Pedro Calado Simões Arguente: Prof. Doutora Leonor Amaral
Vogal: Doutora Anouk F. Duque
New University of Lisbon
Faculty of Sciences and Technology
VI
“(…) E aceitas as derrotas com a cabeça erguida e olhos adiante, com a graça de um adulto e não com a tristeza de uma criança. E aprendes a construir todas as tuas estradas de hoje, porque o terreno do amanhã é incerto demais para os planos, e o futuro tem o mau hábito de cair em pleno voo. (…) aprendes que paciência requer muita prática. Descobres que algumas vezes a pessoa que esperas que te empurre, quando cais, é uma das poucas que te ajuda a levantar. Aprendes que maturidade tem mais a ver com os tipos de experiência que tiveste e o que aprendeste com elas do que com quantos aniversários já comemoraste. Portanto, planta o teu jardim e decora a tua alma, ao invés de esperares que alguém te traga flores.”
VIII
Acidogenic fermentation of brewer’s spent
grain towards polyhydroxyalkanoates
production
Copyright © Eliana da Costa Guarda, Faculdade de Ciências e Tecnologia, Universidade Nova de Lisboa
A Faculdade de Ciências e Tecnologia e a Universidade Nova de Lisboa têm o direito, perpétuo e sem limites geográficos, de arquivar e publicar esta dissertação através de exemplares impressos reproduzidos em papel ou de forma digital, ou por qualquer outro meio conhecido ou que venha a ser inventado, e de a divulgar através de repositórios científicos e de admitir a sua cópia e distribuição com objetivos educacionais ou de investigação, não comerciais, desde que seja dado crédito ao autor e editor.
X
Acknow ledgments
Este, é para mim, um espaço de agradecimentos reduzido e que não me permite, de todo, agradecer da forma mais honesta, humilde e correta, a todas as pessoas que, ao longo deste ano me ajudaram, de forma direta ou indireta, a cumprir os meus objetivos e a realizar esta que é uma das etapas mais importantes da minha vida e de formação académica. Dada a impossibilidade de descrever totalmente por palavras tudo o que reflete o meu enorme agradecimento, sinto que devo recordar algumas delas.
Em primeiro lugar, à Professora Doutora Maria Ascensão Reis, expresso o meu profundo agradecimento pela incrível oportunidade de trabalhar neste excelente grupo de investigação que é o BIOENG. O trabalho que desenvolvi neste ano, apesar de me permitir obter o mestrado, também me ajudou a desenvolver o meu sentido crítico e as minhas habilidades nesta área.
À minha orientadora Anouk, fica o meu maior e sincero agradecimento, não apenas por toda a disponibilidade, partilha de conhecimento, motivação, paciência, apoio, mas também pela pessoa maravilhosa que é e que, efetivamente, demonstrou ser. Reconheço que dei o melhor de mim, mas fui igualmente retribuída e, julgo não haver melhor sentimento que este. Obrigada pela confiança depositada em mim e por me incentivares e desafiares a querer, sempre, saber mais e fazer melhor. A ti, ficarei eternamente agradecida.
Ao Alexandre Paiva, quero agradecer pela possibilidade de realizar parte do trabalho experimental, mas também pela disponibilidade sempre demonstrada para comigo.
Às pessoas do laboratório 610, em especial à Mónica Carvalheira, fica o meu agradecimento pela constante companhia, pelo apoio, pela ajuda e pelo incentivo a nunca desistir de nada. Obrigada por teres sido a pessoa que mais me ouviu e que, ao longo deste ano, me ficou a conhecer como a palma da mão. Levo uma amiga para a vida, estou certa. Ao pessoal do BIOENG, agradeço de uma forma geral a todos, que se cruzaram comigo, independentemente da frequência ou motivo, mas também a quem me acompanhou mais de perto, Bruno Oliveira e Cláudia Henriques, obrigada pelos momentos de riso e de muita animação. À
Marta Sá, obrigada pelos momentos de descontração e de preocupação.
Às minhas colegas de mestrado e grandes amigas, Sara, Rita, Juliana e Liane, obrigada pelas horas de espera, pelos desabafos, pela ajuda e sobretudo, por caminharmos lado a lado nesta que é uma grande etapa das nossas vidas.
Ao meu projeto do coração, GASTagus, e às pessoas que nele me acompanharam, obrigada pela paciência e pela capacidade de perceberem quando efetivamente não poderia estar presente. Na realidade, este percurso também foi um pouco vosso. Obrigada por me acompanharem e por me mostrarem que, por vezes, é possível, mesmo quando pensamos que não o é.
Às minhas recentes colegas de casa, Joana Freitas e Teresa Martins, obrigada por me tranquilizarem neste último mês e por me relembrarem que sou capaz e que tudo se faz.
Aos meus amigos/as, com os quais partilhei alguns momentos, um sincero obrigada. Obrigada por me ouvirem, pelas críticas, pelos conselhos e por se manterem presentes quando na realidade, eu não podia estar mais perto.
Por último, e realmente os mais importantes, agradeço aos meus Pais e ao meu Irmão, por confiarem em mim e no meu trabalho. Por depositarem em mim, em todas as ocasiões, a sua maior confiança. Obrigada por estarem sempre ao meu lado e por fazerem de mim a pessoa que sou hoje.
XII
Resumo
Polihidroxialcanoatos (PHA) são poliésteres totalmente biodegradáveis, sintetizados por microrganismos a partir de recursos renováveis, que representam uma alternativa aos plásticos convencionais. A sua produção por culturas microbianas mistas, ao contrário das culturas puras, permite a utilização de subprodutos industriais na ausência de condições de esterilidade, reduzindo os custos do processo. O trabalho descrito focou-se na valorização de um resíduo da indústria cervejeira, a dreche, através da produção de ácidos orgânicos, visando a produção de PHA. O processo para produção de PHA por culturas mistas envolve três etapas: (1) fermentação acidogénica para a produção de ácidos orgânicos, (2) seleção das culturas mistas capazes de acumular PHA e (3) produção de PHA.
Por forma a extrair os açúcares necessários à produção de ácidos orgânicos (fase 1), foram estudados métodos de pré-tratamento, nomeadamente hidrólise ácida e água subcrítica. A hidrólise ácida foi o método selecionado dada a obtenção de um rendimento superior à água subcrítica (de 0.152 g açúcares totais g dreche-1 versus 0.008 e 0.020 g açúcares totais g dreche -1 a 200 °C e 230 °C, respetivamente).
Seguidamente, estudou-se o efeito do pH (5.0, 5.5 e 6.0) e da carga orgânica (10, 20 e 30 gCOD L-1) na fermentação acidogénica da dreche hidrolisada em batch. Verificou-se que,
independentemente da condição, os ácidos mais produzidos são o acético e butírico. Uma vez que o pH e a carga orgânica afetam o perfil dos produtos de fermentação, é possível manipular a composição do PHA.
Numa última fase, estudou-se a fermentação acidogénica da dreche hidrolisada em contínuo, usando um reator anaeróbio granular de leito expandido. Dado o período de operação demasiado curto, não foi possível atingir a estabilidade no reator. No entanto, verificou-se que os açúcares são consumidos para a produção de ácidos orgânicos, demonstrando que este reator tem potencial para a acidogénese da dreche com vista à produção de PHA.
Palavras-chave: Dreche, grânulos anaeróbios, fermentação acidogénica, ácidos orgânicos,
XIV
Abstract
Polyhydroxyalkanoates (PHA) are fully biodegradable polyesters, synthesized by microorganisms from renewable resources, which reveal an alternative to petroleum-based plastics. Its production by mixed microbial cultures, unlike pure cultures, allows the use of industrial by-products in the absence of sterility conditions, potentially reducing process costs. The study described focused on the valorization of a waste from a brewery industry, brewer’s spent grain (BSG), through organic acids production, towards PHA production. PHA production using mixed microbial cultures involves three steps: (1) acidogenic fermentation of BSG for organic acids production, (2) selection of the mixed cultures able to accumulate PHA and (3) PHA production.
In order to extract the sugars necessary to produce organic acids (phase 1), pre-treatment methods such as acid hydrolysis and subcritical water have been studied. Acid hydrolysis was selected for further experiments as the hydrolysis yield on sugars reached was higher than using subcritical water (0.152 g total sugars g BSG-1 versus 0.008 and 0.020 g total sugars g BSG-1 at
200 °C and 230 °C, respectively).
Afterwards, the pH (5.0, 5.5 and 6.0) and organic loads (10, 20 and 30 gCOD L-1) effect on the
acidogenic fermentation of hydrolyzed BSG was studied in batch. It was verified, regardless of the condition, that the most produced acids are acetic and butyric. As pH and organic load affects the fermentation products profile, it is possible to manipulate PHA composition.
At last, the acidogenic fermentation of hydrolyzed BSG was studied in a continuous mode, using an expanded granular sludge bed reactor (EGSB). Due to the reduced operating time, it was not possible to reach stability. However, it was observed that sugars were consumed to produce organic acids. This revealed the potential of EGSB to be used for BSG acidogenic fermentation towards PHA production.
Keywords: brewer’s spent grain, anaerobic granules, acidogenic fermentation, organic acids,
XVI
List of Abbreviat ions BSG - Brewer’s spent grain
C:N:P- Ratio of carbon:nitrogen:phosphorus (C-mol:N-mol:P-mol) CSTR - Continuous stirred tank reactor
CoA - Coenzyme A
COD - Chemical oxygen demand (gO2 L-1)
DF - Degree of fermentation (gCOD-FP gCOD-1)
EGSB - Expanded granular sludge bed EtOH - Ethanol
FCT - Faculdade de ciências e tecnologia F/F - Ratio feast and famine (h h-1)
FP - Fermentation products (gCOD L-1)
GC - Gas chromatography HAc - Acetic acid
HB - Hydroxybutyrate HBut - Butyric acid HIso - Isovaleric acid HOrg - Organic acids
HPLC - High-performance liquid chromatography HProp - Propionic acid
HRT - Hydraulic retention time (hours or days) HV - Hydroxyvalerate
HVal - Valeric acid
Kw - Ionic product (mol2 L-2)
MMC - Mixed microbial cultures OL - Organic load (gCOD L-1)
OLR - Organic loading rate (gCOD L-1 h-1)
PHA - Polyhydroxyalkanoate
qFP - Specific fermentation products production rate (gCOD-FP gVSS-1 h-1 or gCOD-FP gVSS-1
XVII
qS - Specific substrate uptake rate (gCOD gVSS-1 h-1 or gCOD gVSS-1 d-1)
rFP - Volumetric fermentation products production rate (gCOD-FP L-1 h-1 or gCOD-FP L-1 d-1)
rS - Volumetric substrate uptake rate (gCOD L-1 h-1 or gCOD L-1 d-1)
S - Substrate (gO2 L-1)
SBR - Sequencing batch reactor SCW - Subcritical water
SRT - Sludge retention time TCA - Tricarboxylic acid cycle TSS - Total suspended solids (g L-1)
Vup - Liquid upflow velocity (m h-1)
VFA - Volatile fatty acids
VSS - Volatile suspended solids (gVSS L-1)
YFP/S - Yield of fermentation products on substrate (gCOD-FP gCOD-1)
XVIII
List of Cont ent s
Acknowledgments ... X Resumo ... XII Abstract ... XIV List of Abbreviations ... XVI List of Contents... XVIII List of Figures ... XX List of Tables ... XXII
1. General Introduction ... 1
1.1 State of the art: how the bioplastics can reshape the plastic industry? ... 2
1.2 Bioplastics as a promising alternative to conventional plastics ... 2
1.3 Polyhydroxyalkanoates (PHA) ... 2
1.3.1 Chemical structure and properties ... 3
1.3.2 Biosynthesis ... 4
1.3.3 PHA production by MMCs ... 5
1.3.4 Metabolic pathways ... 8
1.3.5 Extraction and Purification ... 9
1.3.6 Applications ... 9
2. Motivation and Thesis Outline ... 11
2.1 Motivation ... 12
2.1.1 PHA production by mixed microbial cultures (MMCs) using waste as feedstock 12 2.1.2 Valorization of brewer’s spent grain (BSG) ... 12
2.1.3 Objetives ... 12
2.2 Thesis Outline ... 12
3. Brewer’s spent grain (BSG) pre-treatment strategies ... 13
3.1 Introduction ... 14
3.2 Materials and Methods ... 17
3.2.1 Brewer’s spent grain preparation ... 17
3.2.2 Experimental set-up ... 17
XIX
3.3 Calculations ... 19
3.4 Results and Discussion ... 20
3.4.1 Acid hydrolysate characterization ... 20
3.4.2 Characterization of BSG hydrolysate using SCW ... 22
3.4.3 Pre-treatment strategies comparison ... 24
4. Acidogenic fermentation of brewer’s spent grain (BSG): pH and organic load effects 27 4.1 Introduction ... 28
4.2 Materials and Methods ... 29
4.2.1 BSG preparation ... 29
4.2.2 Experimental set-up ... 29
4.2.3 Analytical Procedures ... 30
4.3 Calculations ... 31
4.4 Results and Discussion ... 33
5. Acidogenic fermentation of BSG in an expanded granular sludge bed reactor (EGSB) 39 5.1 Introduction ... 40
5.2 Materials and Methods ... 41
5.2.1 BSG preparation ... 41
5.2.2 Experimental set-up ... 41
5.2.3 Analytical Procedures ... 42
5.3 Calculations ... 43
5.4 Results and Discussion ... 44
6. Conclusion and future perspectives ... 49
XX
List of Figures
Figure 1.1: General chemical structure of PHA monomers. R is the variable hydrocarbon side chains, x refers to the size of the alkyl group and n represents the number of times that this monomer repeat, ranging from 100 to 30 000 ... 3 Figure 1.2: Transmission electron micrograph of thin sections of recombinant R. eutropha PHB- 4
cells containing large amounts (90% of the dry cell weight) of P(3HB-co-5 mol% 3HHx). Bar represents 0.5 mm ... 4 Figure 1.3: Common behaviour of MMC for PHA storage under fully aerobic feast and famine conditions. Blue line represents volatile fatty acids (VFA), green line corresponds to PHA and red line to the specific growth rate (µ) ... 6 Figure 1.4: Three-step process for PHA production by mixed microbial cultures from waste streams ... 6 Figure 1.5: Metabolic pathways involved in polyhydroxyalkanoate (PHA) synthesis from sugars (I) and from short-chain fatty acids (III) ... 8 Figure 3.1: Phase diagram of water presenting subcritical region (in blue colour), the triple point (1), the boiling point at ambient pressure (2) and critical point (3) ... 15 Figure 3.2: SCW apparatus used for BSG hydrolysis. ... 17 Figure 3.3: Samples collected during hydrolysis reactions using SCW at P = 65 bar. From left to right are presented the first (lower temperature) to the last sample (higher temperature). ... 23 Figure 4.1: Batch assays experimental set-up. ... 29 Figure 4.2: COD analysis of batch assays samples. ... 30 Figure 4.3: Example of one batch assay (pH = 5.0, Organic Load = 20 gCOD L-1): (a) detected
FP (HAc (■), HProp (■), HBut (■), HVal (■), HIsov (■) and sugars (glucose (▲), xylose (▲) and arabinose (▲), (b) total profile of detected FP (HOrgs) (♦) and consumed sugars (glucose + xylose + arabinose) (♦) are presented. ... 33 Figure 4.4: Fermentation products profile obtained at the three different pH (5.0, 5.5 and 6.0) and organic loads (10, 20 and 30 gCOD L-1) tested. HAc (■), HProp (■), HBut (■), HVal (■) and HIsov
(■) are presented. Error bars represents standard deviation. ... 34 Figure 4.5: Linear regression between total fermentation products obtained for the three applied organic loads at different pH (5.0 (●), 5.5 (●) and 6.0 (●)) for the same biomass concentration. ... 37 Figure 5.1: Schematic representation of EGSB reactor. ... 40 Figure 5.2: Acidogenic fermentation set-up. ... 41
XXI
Figure 5.3: EGSB overall operation: (a) total sugars (out (▲) and in (▲), (b) total detected fermentation products (■) and (c) detected FP (HAc (■), HProp (■), HBut (■), HVal (■), HIsov (■) and EtOH (■). ... 44 Figure 5.4: Biomass concentration distribution in the bottom (H1 (■)), middle (H2 (■) and top (H3
(■)) parts of the reactor. Average value is represented by a orange dashed line. ... 46 Figure 5.5: Shematic representation of volumetric rates. FP production (■), substrate uptake (▲)) rates and specific FP production (■) and substrate uptake (▲) rates, are presented. ... 47
XXII
List of Tables
Table 1.1: Several common PHA, defined by their respective R groups ... 4 Table 1.2: Applications of polyhydroxyalkanoates ... 9 Table 3.1: BSG’s chemical composition according to several studies. ... 14 Table 3.2: Initial characterization of acid hydrolyzed BSG. ... 20 Table 3.3: Hydrolyzed BSG characterization before (first column) and after Ca(OH)2 addition
(second column). ... 21 Table 3.4: Hydrolysis yield on sugars from BSG by acid hydrolysis. ... 22 Table 3.5: Influence of temperature on the BSG extraction/hydrolysis using SCW. P = 65 bar. 23 Table 3.6: Total recovered sugars and HOrg at different temperatures (200 and 230 °C) with water flow rate at 10 mL min-1 and P = 65 bar. ... 24
Table 3.7: Extracted sugars and HOrg from acid hydrolysis and SCW (T = 200 °C and T = 230 °C, respectively). ... 24 Table 3.8: Hydrolysis yield on sugars from BSG for the two pre-treatment strategies, namely acid hydrolysis and SCW (T = 200 and 230 °C). ... 25 Table 4.1: General operating conditions applied for BSG acidogenic fermentation in batch. .... 29 Table 4.2: Stoichiometric and kinetic coefficients calculated for each batch assay. ... 35 Table 5.1: General operating conditions applied to the EGSB for BSG acidogenic fermentation. ... 42 Table 5.2: Stoichiometric and kinetic coefficients calculated during the EGSB operation. Average values ± standard deviations were presented. ... 45
1
2
1.1 State of the art: how the bioplastics can reshape the plastic industry?
Currently, plastics production is continuously growing at global level (Plastics Europe, 2015), evidencing the world dependence on this synthetic plastic with an expected demand of 334.83 million tons in 2020 (Grand View Research, 2014). Plastics are polymeric molecules derived from limited fossil fuels, with a wide range of applications, due to their properties and low-cost production (Shah et al., 2008, Jain and Tiwari, 2015). However, they have been considered a serious worldwide environmental and health problem due to their non-biodegradable nature and to the lack of an appropriate treatment (Jain and Tiwari, 2015; Reddy et al., 2003). The current solutions to plastic waste, like source reduction, recycling, incineration and bio or photo-degradation appears to be insufficient and with associated disadvantages (Ben et al., 2016; Brockhaus et al., 2015; North and Halden, 2013). The increase of plastics waste makes crucial to focus on the research and development of emergent alternatives with direct association with sustainability (Alvarez-Chavez et al., 2012).
1.2 Bioplastics as a promising alternative to conventional plastics
The constant and rising demand of more sophisticated materials are responsible for the production, by bioplastics industries, of 1% of about 320 million tons of plastic produced annually, according to the European Bioplastics (Bioplastics, 2016). Bioplastics are a group of natural polymers, synthesized and catabolized by numerous organisms, considered as promising substitutes to the conventional plastics (Suriyamongkol et al., 2007). As environmental friendly, they can be produced from renewable resources (biobased) like industrial and/or agricultural wastes, reducing the dependency on limited fossil resources, decreasing greenhouse gas emissions (CO2) and producing non-toxic by-products (Reis et al., 2011; Brockhaus et al., 2015;
Gironi and Piemonte, 2011). There are three main groups of bioplastics, according to the different properties (Lackner, 2015):
1. Fully or partially biobased non-biodegradable plastics, including polyethylene (PE), polypropylene (PP) and polyethylene terephthalate (PET);
2. Polylactic acid (PLA) and polyhydroxyalkanoates (PHA) are synthesized polymers from renewable sources (biobased) and biodegraded under several conditions (biodegradable);
3. Polymers such as poly(butylene adipate-co-terphthalate) (PBAT) and polycaprolactone (PLC) based on fossil resources but are biodegradable;
Despite the achievement of the criteria of a closed loop life cycle by PHA (Reis et al., 2011), its greater weakness comparatively to conventional plastics is the production price, €9/kg of P(3HB) versus €1/kg of petroleum-based plastics (Reis et al., 2003).
1.3 Polyhydroxyalkanoates (PHA)
PHA are optically active biological polyesters (Figure 1.1) synthesized by microorganisms from renewable resources and characterized by remarkable properties such as biodegradability, biocompatibility and thermoprocessibility (Amulya et al., 2016).
3
Figure 1.1: General chemical structure of PHA monomers. R is the variable hydrocarbon side chains, x refers to the size of the alkyl group and n represents the number of times that this
monomer repeat, ranging from 100 to 30 000 (from Reddy et al., 2003).
Under aerobic or anaerobic environments, they are biodegraded into water (H2O) and carbon
dioxide (CO2) as well as into methane (CH4), respectively (Lee, 1996; Akaraonye et al., 2010;
Khanna and Srivastava, 2005). PHA are classified as good substitutes to the non-biodegradable conventional polymers, as they have similar material properties to several conventional synthetic polymers namely PP (Lee, 1996; Ntaikou et al., 2014).
1.3.1 Chemical structure and properties
Classified as water-insoluble compounds, inert, indefinitely stable in air, non-toxic and with a very high purity within the cell (Laycock et al., 2014), PHA are composed of several hydroxyalkanoates (HA) monomers and divided into three main groups according to the number of carbon atoms: short-chain length (scl-PHA) which consists up to 5 carbon atoms, medium-chain length (mcl-PHA), which comprises 6 - 14 carbon atoms and long-chain length (lcl-PHA) if contains more than 14 carbon atoms (Zinn et al., 2001). Scl-PHA have similar thermoplastics properties to the conventional plastics, such as higher crystallinity, brittle and stiff while mcl-PHAs is an amorphous material with elastic features (Suriyamongkol et al., 2007; Reddy et al., 2003). Its molecular weights ranges from 2 × 10⁵ to 3 × 10⁵ Da depending on the microorganism that produces the
polymer and from the growth conditions used: pH, fermentation conditions and type and concentration of the carbon source (Akaraonye et al., 2010; Sudesh et al., 2000; Anjum et al., 2016). PHA properties changes with monomer composition, microstructure and molecular weight distribution. The melting and glass transition temperatures and the level of crystallinity changes with length of monomers variations (Reis et al., 2011; Khanna and Srivastava, 2005).
The most common PHA is poly-3-hydroxybutyrate (P(3HB)), characterized by good thermoplastic properties, such as glass transition and melting temperatures of 4 °C and 180 °C, respectively (Reis et al., 2011). However, their high crystallinity (55 - 80%) is a limitation since the produced polymer is fairly stiff and brittle (Sudesh et al., 2000; Reis et al., 2011). Apart from homopolymers, containing only one type of hydroxyalkanoate as the monomer unit (e.g. P(3HB) and P(3HHx)), there are also copolymers, such as poly(3-hydroxybutyrate-co-3-hydroxyvalerate), P(3HB-co-3HV), and poly-(3-hydroxybutyrate-co-3-hydroxyhexanoate), P(3HB-co-3HHx), which vary in the type and proportion of monomer (Sudesh et al., 2000). Characterized by lower melting point and glass transition temperatures than P(3HB), they have good elastic properties (Reis et al., 2011). Common PHA, defined by their respective R groups, are listed in Table 1.1.
4
Table 1.1: Several common PHA, defined by their respective R groups (from Lackner, 2015).
1.3.2 Biosynthesis
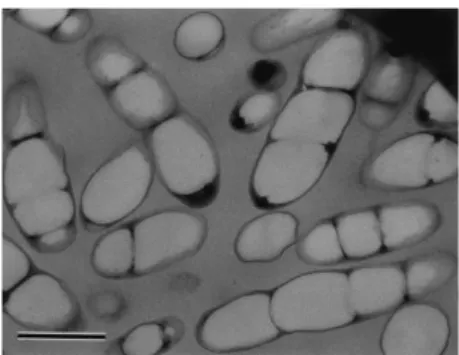
PHA are formed inside bacterial cells, in aerobic and/or anaerobic environments, and stored in a granular form of 0.2 - 0.5 µm in diameter (Figure 1.2) as a reserve material during the fermentation processes (Sudesh et al., 2000).
Figure 1.2: Transmission electron micrograph of thin sections of recombinant R. eutropha PHB- 4 cells containing large amounts (90% of the dry cell weight) of P(3HB-co-5 mol% 3HHx). Bar represents 0.5 mm (from Sudesh et al., 2000).
1.3.2.1 Pure cultures
P(3HB) was the first PHA identified in Azotobacter chroococcum (Sudesh et al., 2000). Actually, more than 300 species of Gram-positive, Gram-negative bacteria and some archae are capable of PHA accumulation with yields up to 80 - 90% of the cell dry weight (Laycock et al., 2014; Serafim et al., 2008; Reis et al., 2011). PHA accumulation by pure cultures occurs through nutrient limitation, usually performed by a two-stage process: (1) In the first stage the main goal is the growth of microorganisms. Under sterile conditions, they are inoculated into the medium solution containing the carbon source and nutrients and (2) in the second stage, PHA accumulation is promoted by an external limitation of essentials nutrients (i.e. N, P or O2). Cells are unable to
grow and increase in size and weight, since PHA intracellular accumulation occurs (Laycock et al., 2014; Chee et al., 2010). Industrially, PHA synthesis is mostly performed by pure cultures using wild or genetically modified strains with glucose or propionic acid as carbon source (Lemos et al., 2006, Reis et al., 2003). P(3HB-co-3HV) and P(3HB-co-3HHx), firstly commercialized by BiopolTM and NodaxTM, respectively, are synthesized by genetically modified strains. BiomerTM
and BiocycleTM are produced by pure cultures in their natural state, and are responsible for
production of homopolymers of HB and the latter also for copolymer of HB and HV synthesis, respectively (Laycock et al., 2014, Lemos et al., 2006).
n R chain Short Name PHA
1 H poly(3-hydroxypropionate) P(3HP) 1 CH3 poly(3-hydroxybutyrate) P(3HB) 1 CH2CH3 poly(3-hydroxyvalerate) P(3HV) 1 C2H4 poly(3-hydroxyhexanoate) P(3HHx) 2 H poly(4-hydroxybutyrate) P(4HB) 3 H poly(3-hydroxyvalerate) P(5HV)
5
The entire process of PHA production depends essentially on the substrate cost, the PHA yield on substrate and the downstream processing. Despite the high cellular density (e.g. 100 g L-1)
and volumetric productivities (up to 5 g-PHA L-1 h-1) achieved by pure cultures (Reis et al., 2011),
its high substrate and downstream process costs are its main weaknesses (Chen et al., 2015). To reduce PHA production costs, substrate behaves as a critical factor directly related to the overall fermentation stage. Thus, substrate should be renewable, inexpensive and readily available as it is the case of waste feedstock’s (Chee et al., 2010). However, the use of waste feedstock’s by pure cultures, characterized by defined metabolic pathways, is impossible due to their complex and unsterile nature (Tamis et al., 2015).
1.3.2.1 Mixed microbial cultures (MMCs)
Mixed microbial cultures (MMCs) are microbial populations with undefined composition, whose selection depends on the operational conditions applied into the biological system (Albuquerque et al., 2007). MMCs are able to consume a large range of cheap substrates, containing diverse organic chemical compounds, such as waste feedstock’s (e.g. industrial and/or agricultural wastes and by-products). Therefore, MMCs have demonstrated to be an excellent alternative to pure cultures potentially reducing PHA production costs (Gurieff and Lant, 2007). The absence of aseptic conditions, the low-cost substrate instead of a defined substrate and the lower control requirements are the main positive approaches to use MMCs (Lemos et al., 2006; Serafim et al., 2004). Several substrates can be used by MMCs for PHA production, namely sugar cane molasses (Albuquerque et al., 2007), cheese whey, (Duque et al., 2014; Bengtsson et al., 2008a), cellulose, sucrose and starch (Reddy et al., 2003) or effluents and wastewaters such as olive oil (Dionisi et al., 2005; Ntaikou et al., 2014), paper mill (Bengtsson et al., 2008b) and brewery wastewater (Ben et al., 2016).
However, lower cellular concentrations with PHA storage capacity are obtained by MMCs, rounding 55% of the dry weight using synthetic feedstocks, resulting in lower volumetric productivities instead of those obtained by pure cultures (Albuquerque et al., 2011; Jiang et al., 2012).
1.3.3 PHA production by MMCs
PHA synthesis by MMCs was firstly observed in aerobic wastewater treatment plants (WWTP) (Reis et al., 2011). Through the “Feast and Famine (FF)” strategy or aerobic dynamic feeding (ADF), culture selection occurs by transient conditions of substrate feed (Reis et al., 2003; Gurieff and Lant, 2007). Feast period comprises the culture supplementation, in a short period of time, of excess carbon. PHA storage is the dominant process, as the enzymes required to reach the maximum growth are not sufficient while enzymes needed for PHA storage are present. During the famine period, stored PHA is used for cell growth and cell maintenance (Reis et al., 2011, Dias et al., 2006, Serafim et al., 2008). The FF cycles repetition will favor the cell growth on storage products, creating a selection for organisms with high PHA-storing capacity (Dias et al., 2006; Albuquerque et al., 2011). Bacteria selection step carried out under aerobic conditions is shown in Figure 1.3:
6
Figure 1.3: Common behaviour of MMC for PHA storage under fully aerobic feast and famine conditions. Blue line represents volatile fatty acids (VFA), green line corresponds to PHA and red
line to the specific growth rate (µ) (from Reis et al., 2011).
Physical adaptation of the microorganisms to the FF strategy and selection of enriched culture with high and stable capacity of PHA accumulation results from alternate substrate availability (Albuquerque et al., 2010). Serafim et al. (2004) showed that, using a pulse substrate feeding strategy, 65% of intracellular PHA content was achieved. This simpler strategy requiring less investment and operation costs, is economically competitive with PHA production by pure cultures (M.L. Dias et al., 2006).
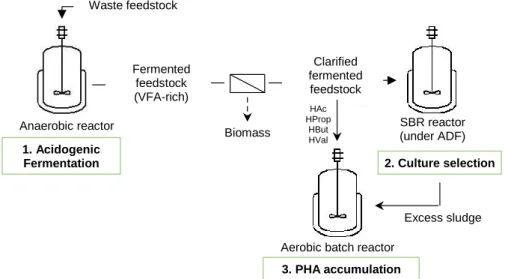
Depending on the substrate used as feedstock, PHA production can be operated in two or three-step process (Albuquerque et al., 2007; Serafim et al., 2008). Both processes involve selection of PHA-storage organisms followed by PHA accumulation (Step 2 and 3 in Figure 1.4) (Serafim et al., 2008). However, using waste feedstock’s, many being carbohydrate-rich, PHA production by MMCs is operated in three separate stage (Figure 1.4), with different optimal conditions (Lemos et al., 2006; Serafim et al., 2008): (1) acidogenic fermentation where organic content in the waste is biologically converted to organic acids and other fermentation products (FP), (2) culture selection (under FF strategy), using the fermented feedstock from stage 1 and (3) PHA accumulation using the selected culture (stage 2) and the organic acids produced in stage 1. PHA produced is then extracted and purified (Albuquerque et al., 2007, Gouveia et al., 2016).
Figure 1.4: Three-step process for PHA production by mixed microbial cultures from waste streams (from Albuquerque et al., 2007).
Anaerobic reactor Waste feedstock 1. Acidogenic Fermentation Fermented feedstock (VFA-rich) Biomass Clarified fermented feedstock
Aerobic batch reactor
2. Culture selection HAc HProp HBut HVal SBR reactor (under ADF) 3. PHA accumulation Excess sludge
7
1.3.3.1 Acidogenic Fermentation
PHA production by MMCs is mostly performed using organic acids (HOrg) as substrate. As MMCs allow the utilization of wastes aiming at organic acids production, a previous anaerobic step called acidogenic fermentation (stage 1, Figure 1.4) is required, where sugars in the wastes are converted into fermentation products including organic acids (e.g. acetic (HAc), propionic (HProp), butyric (HBut) and valeric (HVal) acids), hydrogen (H2), carbon dioxide (CO2) and
ethanol (EtOH) (Albuquerque et al., 2007, Lier et al., 2008). During this stage, CH4 production is
not desired. As such, the use of low HRT, temperature and pH or a combination of the different approaches are strategies to prevent methanogenic activity (Reis et al., 2011), resulting in PHA precursors accumulation, namely organic acids (Tamis et al., 2015).
Acidogenic fermentation can be operated using suspended biomass (e.g. cells, flocs) or immobilized biomass (e.g. biofilm, granules). Considering immobilized biomass, the microorganisms can be attached to a support (biofilm) or can be aggregated (granules) (Guiot et al., 1992). Anaerobic granules (0.5 - 3 mm) are aggregated microorganisms formed in high-rate upflow anaerobic reactors (Hickey et al., 1991). Its internal architecture promotes species to substrate transfers and increase resistance to high OLR and to toxic shocks (Amani et al., 2010;
Guiot et al., 1992).
1.3.3.2 Culture selection
Culture selection is the second stage of the three-step process for PHA production by MMCs (stage 2, Figure 1.4). The main goal is to achieve an enriched culture with high storage capacity (Reis et al., 2011). The common configuration used are sequencing batch reactors (SBR), compact systems, easily controlled and highly flexible, where selection of microorganisms with high ability for PHA storage is ideal and biomass grows under transient (unsteady) conditions (Serafim et al., 2008; Reis et al., 2011). Two sequentially disposed continuous reactors are followed by a settler is an alternative configuration (Serafim et al., 2008). Different reactor operating conditions (SRT, HRT, pH, T, cycle length, OLR, influent substrate and nutrient concentrations) and feedstocks act as the main regulatory factors on this step, providing different responses and directly influence the selective pressure in favour of PHA-storing organisms (Reis et al., 2011; Albuquerque et al., 2010).
1.3.3.3 PHA accumulation
PHA accumulation stage is the last of the three-stage process for PHA production (step 3 in Figure 1.4). It is performed in batch or fed-batch mode in an open system where the reactor is inoculated with the selected culture (step 2) and fed in the form of a pulse of substrate with a high organic acids concentration (from step 1) (Ben et al., 2016; Chen et al., 2015). Operated under growth limiting conditions (e.g. ammonia and/or phosphate limitation) or by nutrients and carbon sources continuous exposition, higher PHA cell content is achieved in the first case. The highest PHA content from waste or by-products feedstocks was obtained using fermented molasses, 74.6% (gPHA gVSS-1), under N limitation (Reis et al., 2011), whereas using pure HAc these value
8
performance is evaluated according to the PHA cell content, yield on substrate, specific storage rate and cell volumetric productivity (Reis et al., 2011).
1.3.4 Metabolic pathways
PHA production occurs under stress conditions caused by the external nutrient limitation (oxygen, nitrogen and phosphorus) or by an internal limitation in anabolic enzyme levels or activity. As a consequence, cells are unable to grow (Reis et al., 2011). Pathway I (Figure 1.5), where carbohydrate catabolic degradation occurs, is used for pure cultures resulting in pyruvate, energy and reducing equivalents synthesis (Reis et al., 2011). Without growth-limitation conditions, pyruvate conversion into acetyl-CoA is enhanced (Zinn et al., 2001). In the tricarboxylic acid cycle (TCA), this product is oxidized into CO2 generating anabolic precursors, energy and reducing
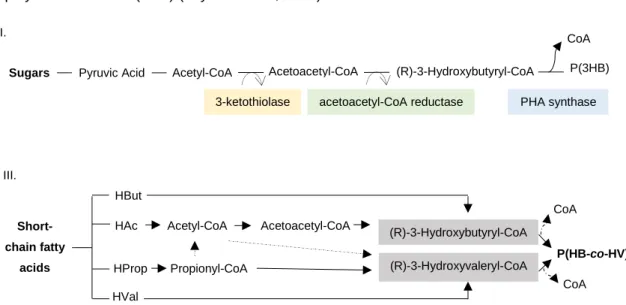
equivalents. Under growth-limitation conditions, the acetyl-CoA level is reduced due to its conversion into P(3HB) by three enzymes: 3-ketothiolase (PhaA), acetoacetyl-CoA reductase (PhaB), and PHA synthase (PhaC) (Zinn et al., 2001; Sudesh et al., 2000; Reis et al., 2011). Pathway III, involves the activation of short-chain organic acids to the corresponding acyl-CoA molecules, which are different HA monomers precursors (Figure 1.5) (Braunegg et al., 1998; Reis et al., 2011; Loo and Sudesh, 2007). When the carbon source is HAc, the process follow Pathway I. HProp is converted to propionyl-Co-A with 3-hydroxy-2-methylvalerate (3H-2-MV) synthesis, or to acetyl-Co-A with or 3HV or 3-hydroxy-2-methylbutyrate (3H-2-MB) production. HBut and HVal are converted directly to 3-hydroxybutyryl-CoA and 3-hydroxyvaleryl-CoA, with 3HB and 3HV synthesis, respectively (Reis et al., 2011; Serafim et al., 2008; Dias et al., 2006). Fatty acid β-oxidation pathway (Pathway II, not shown) is related to fatty acids uptake by microorganisms to produce mcl-PHA. Subsequent pathways (not shown) involve the synthesis of alternative copolymers such as P(4HB) (Laycock et al., 2014).
Figure 1.5: Metabolic pathways involved in polyhydroxyalkanoate (PHA) synthesis from sugars (I) and from short-chain fatty acids (III) (from Reis et al., 2011).
P(3HB) CoA (R)-3-Hydroxybutyryl-CoA
Acetoacetyl-CoA Acetyl-CoA
Sugars Pyruvic Acid
3-ketothiolase acetoacetyl-CoA reductase PHA synthase I. Short-chain fatty acids CoA CoA P(HB-co-HV) HBut HAc HProp HVal (R)-3-Hydroxybutyryl-CoA Acetyl-CoA Acetoacetyl-CoA Propionyl-CoA (R)-3-Hydroxyvaleryl-CoA III.
9
Polymer composition reflects the combination of different mixtures of substrates used by the culture (Serafim et al., 2008). PHA production can be promoted through inhibition of metabolic pathways or activation of specific enzymes that are directly or indirectly involved in PHA synthesis (Laycock et al., 2014, Gouveia et al., 2016). PHA synthesis by MMCs involves similar metabolic pathways described by pure cultures using organic acids as carbon source (Reis et al., 2011).
1.3.5 Extraction and Purification
Downstream processing is a decisive cost-determining factor in biopolymer production, regardless of the raw material costs and the fermentation process itself. To achieve a high yield in PHA extraction it is fundamental to concentrate PHA-containing cells by centrifugation, cross-flow filtration and flocculation (Zinn et al., 2001, Muhammadi et al., 2015). PHA extraction was performed using solvents, such as chloroform, methylene chloride, propylene carbonate and dichloromethane due to their simplicity and rapidity. Although the recovered PHA has a higher degree of purity, they are non-environmental friendly methods, requiring large amounts of toxic and volatile solvents, negatively affecting the total production costs (Kunasundari and Sudesh, 2011; Reis et al., 2011). Chemical and enzymatic digestion, through solubilization of cellular materials surrounding the PHA granules, can also be applied. Chemical digestion with sodium hypochlorite or surfactants to solubilize the non-PHA cellular mass (Muhammadi et al., 2015) are not a good choice due to the low purity degree and/or molecular weight (Zinn et al., 2001; Kunasundari and Sudesh, 2011). Despite of the good quality of PHA resultant from enzymatic digestion, the high cost of very specific enzymes and the complexity of the recovery process are not favourable parameters (Kunasundari and Sudesh, 2011). PHA downstream process is a constant challenge, being cost the key factor in the selection of the method, generally focusing on the minimization of using strong chemicals and solvents. Moreover, it depends on the final application, since for medical applications it must be free of bacterial endotoxins, contaminating chemicals and solvents (Kunasundari and Sudesh, 2011). If it is to be used in garbage bags production, it is not necessary such a high purity degree (Kunasundari and Sudesh, 2011).
1.3.6 Applications
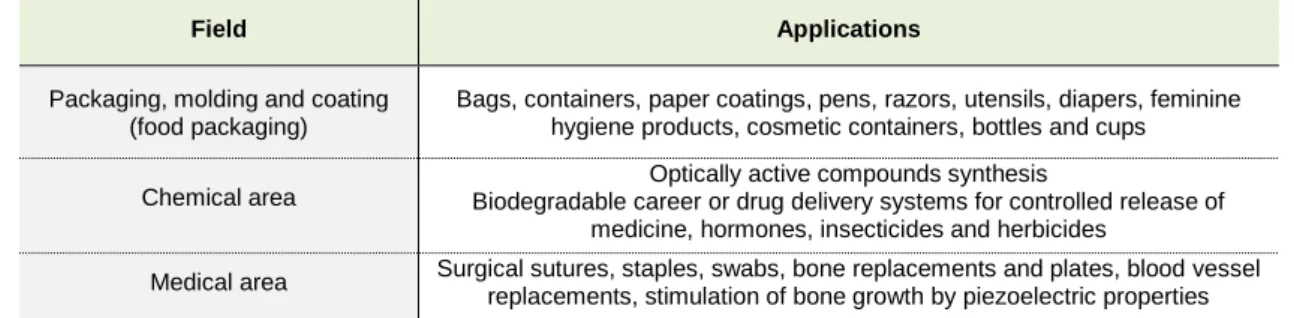
As a conceivable substitute to the conventional plastics, PHA can be applied in an extensive range of applications, some of which being listed in Table 1.2.
Table 1.2: Applications of polyhydroxyalkanoates (from Muhammadi et al., 2015).
Field Applications
Packaging, molding and coating (food packaging)
Bags, containers, paper coatings, pens, razors, utensils, diapers, feminine hygiene products, cosmetic containers, bottles and cups Chemical area
Optically active compounds synthesis
Biodegradable career or drug delivery systems for controlled release of medicine, hormones, insecticides and herbicides
Medical area Surgical sutures, staples, swabs, bone replacements and plates, blood vessel replacements, stimulation of bone growth by piezoelectric properties
Several applications are still emerging, such as a new source of small molecules or acting as tissue adhesives or sealants (Akaraonye et al., 2010).
11
12
2.1 Motivation
2.1.1 PHA production by mixed microbial cultures (MMCs) using waste as feedstock
Over the years, plastic production has been causing a huge negative impact in the environment due to its harmful effects. Bioplastics, such as polyhydroxyalkanoates (PHA), are considered as potential substitute of conventional plastics due to its biobased and biodegradable nature (Reis et al., 2011). Its industrial production, performed mostly by pure cultures, depends on expensive carbon sources and maintenance process costs (Albuquerque et al., 2011). Alternatively, mixed microbial cultures (MMCs) allow the substitution of refined carbon sources by low cost complex feedstock (e.g. agricultural/industrial residues or by-products), removing the requirement of sterile conditions, therefore potentially decreasing PHA production costs (Reis et al., 2011). This work was developed in order to simultaneous treat and valorize a raw material, using a three-stage PHA production process, firstly producing organic acids as PHA precursors.
2.1.2 Valorization of brewer’s spent grain (BSG)
Brewer’s spent grain (BSG) is the main low-value solid waste and by-product of the brewery industry, counting with about 3.4 million metric tons of spent grains produced per year in the European Union (Fărcaş et al., 2014). Being mainly composed by fibers like cellulose, hemicellulose and lignin, as well as some proteins, minerals and lipids, it is currently being used for animal feed, due to its high nutritive value (Mussatto, 2014). Additionally, BSG can be composted, incinerated, dumped or anaerobically fermented (Fărcaş et al., 2014). Hence, BSG can be used to produce an added value compound such as PHA, contributing to circular economy.
2.1.3 Objetives
The present thesis aims to investigate, at laboratory scale, a strategy for the valorization of brewery waste, brewer’s spent grain (BSG), through organic acids production, using anaerobic granular sludge. Lab scale reactors were operated and the impact of operating parameters on organic acids production, namely pH and organic load, were evaluated.
2.2 Thesis Outline
This thesis comprises six chapters - Chapter 1 is a general introduction focused on the PHA development: their importance as well as PHA properties, synthesis and applications. The current chapter (Chapter 2) describes the motivation and the outline of the work developed during the master project. Chapter 3 is dedicated to the BSG pre-treatment by acid hydrolysis and subcritical water. Chapter 4 focus on the effect of pH and organic load on the acidogenic fermentation of hydrolyzed brewer’s spent grain in batch. Chapter 5 reports brewer’s spent grain acidogenic fermentation in an expanded granular sludge bed reactor. In Chapter 6 general conclusions are summarized and future work suggestions are presented.
13
3. Brewer’s spent grain (BSG)
pre-treatment strategies
14
3.1 Introduction
In the brewery industry, barley malt is partially liquefied resulting in a liquor (wort), used for beer production, and a solid residue named as brewer’s spent grain (BSG) (Forssell et al., 2008). As the main by-product of brewery industry, BSG is a lignocellulosic material, recalcitrant and with chemical composition dependent on various factors, such as barley variety, conditions of malting and mashing, and the quality and type of adjuncts added (Mussatto et al., 2006). Despite of the fluctuations in the amount of each constituent reported, its main composition consists on fibers like cellulose, hemicellulose and lignin. Some proteins, minerals and lipids can also be found in BSG’s composition (Mussatto et al., 2006). Comprising 50% (w/w) of BSG’s composition, cellulose and hemicellulose fractions are mainly composed by sugars such as glucose, xylose and arabinose (Mussatto, 2014; Fărcaş et al., 2014). Due to its high water content (80%) it is essential a long-term storage, in order to prevent rapid microbial spoilage (Macheiner et al., 2003). In Table 3.1 several studies using different BSG with different compositions are listed.
Table 3.1: BSG’s chemical composition according to several studies.
*n.a – not available; % in dry weight matter
Currently, BSG is used for animal feed due to its high nutritive value (Mussatto and Roberto, 2005). However, other several applications can be found such as biogas production, where BSG act as a substrate with high biotechnological value. Some interesting compounds can be extracted and used as hydrocolloid, such as arabinoxylan or corresponding oligosaccharides, as antioxidant from extracted phenolic compounds and as emulsifying agents in the case of lignin and proteins extraction (Mussatto, 2014; Forssell et al., 2008; Treimo et al., 2009).
These lignocellulosic materials are currently pre-treated to convert polysaccharides present in BSG into fermentable sugars (Macheiner et al., 2003). The main pre-treatment procedures are classified as physical (crushing, grinding and microwave radiation), chemical (alkaline and organic acids solvents, oxidizing agents and ionic liquid as well), physico-chemical (auto-hydrolysis, hot water, steam and supercritical fluids) and biological (enzymes, fungi and bacteria) (Macheiner et al., 2003; Partida-Sedas et al., 2017). Low sugar yields, optimal reaction conditions, high capital investment and processing costs are some disadvantages of these methods (Partida-Sedas et al., 2017). Chemical processes are chosen as more favourable, usually involving sulphuric acid or hydrochloric acid at concentrations of 1 - 10% (v/v) and temperatures ranging from 100 to 150 °C, in order to hydrolyse hemicelluloses into xylose and arabinose and cellulose into glucose (Lenihan et al., 2010). Mussatto and Roberto (2005), who have studied acid hydrolysis of BSG under liquid/solid ratio of 8 g g-1, 100 mg g-1 of H
2SO4 and a reaction time of
17 minutes, reported an efficiency of extracted hemicellulosic fraction of 92.7% (w/w) in dry matter. Study Cellulose (% w/w) Hemicellulose (% w/w) Protein (% w/w) Ash (% w/w) Lipid (% w/w) Lignin (% w/w) Beldman et al., 1987 15.1 24.8 23.8 3.5 25.0 Carvalheiro et al., 2004 21.9 29.6 24.6 1.2 n.a 21.7 Mussatto and Roberto, 2005 16.8 28.4 15.2 4.6 n.a 27.8 Kopsahelis et al., 2007 9.0 19.0 23.0 4.0 8.0 - 9.0 16.0
15
However, from degradation of glucose and monosaccharides, some undesirable compounds can be produced such as furfural, hydroxymethylfurfural (5-HMF), HAc and phenolic compounds (Lenihan et al., 2010). The concentrations of these inhibitory compounds increases with temperature and acid concentration (Lenihan et al., 2010; Mussatto, 2014). Furthermore, acid hydrolysis results in environmental concerns and corrosion problems (Haghighi Mood et al., 2013).
Hot-compressed water (HCW) or subcritical water (SCW) is a potential greener alternative to hydrolyse lignocellulosic materials, constituted by polysaccharides, into oligomers and monomers (Pourali et al., 2009, Brunner, 2009). SCW is an environmentally friendly solvent process, being non-explosive, non-flammable, non-toxic and cheap. This process uses hot water at temperatures ranging from 100 to 374 °C, maintained in liquid state by high pressure application (Rogalinski et al., 2008, Pourali et al., 2009). The different behaviour of the water at ambient conditions is directly related to the dielectric strength and ionic product, both monitored by temperature and pressure changes (Rogalinski et al., 2008). Above the triple point (point 1 in Figure 3.1) and below the critical point (point 3 in Figure 3.1 where T = 374 °C and ρ = 22.1 MPa), water is either liquid or gaseous (Möller et al., 2011).
Figure 3.1: Phase diagram of water presenting subcritical region (in blue colour), the triple point (1), the boiling point at ambient pressure (2) and critical point (3) (adapted from Möller et al., 2011).
As mentioned above, temperature and pressure changes affect water properties. Increasing the temperature, the ionic product (Kw) is up to three orders of magnitude higher, from 10-14 mol2 L-2
at 25 °C to 10-11 mol2 L-2 at 300 °C but above the critical point it decreases drastically to 10-20 at
380 °C (Möller et al., 2011). This increase in ionic product, consequence of higher H3O+ and OH-
concentrations, enhance the reactivity of water, acting as an acid/base catalyst precursor (Kruse and Dinjus, 2007). On the other hand, dielectric constant of water decreases with temperature increase, resulting in a decrease of the number of hydrogen bonds per molecule of water due to its dissociation (Möller et al., 2011).
Due to its several properties, SCW is currently applied on extraction processes (Möller et al., 2011). Several studies using SCW have been performed for the hydrolysis of different
agro-16
industrial residues such as sugar cane bagasse (Prado et al., 2014), bean dregs waste (Zhu et al., 2011) and rice bran (Pourali et al., 2009). SCW was tested as a potential alternative to the acid hydrolysis in order to extract sugars from BSG, due to its environmentally friendly nature, quickness and to the necessity of relatively simple equipment (Pedras et al., 2017). In order to compare two possible BSG pre-treatment strategies, namely acid hydrolysis and SCW, BSG hydrolysis using SCW was investigated, at four temperatures (T = 150, 180, 200 e 230 °C) with a constant water flow rate of 10 mL min-1.
17
3.2 Materials and Methods
3.2.1 Brewer’s spent grain preparation
BSG was supplied by a Portuguese brewery industry, dried in the oven at 70 °C for one week and grinded using a hammer mill to obtain smaller particles. BSG was stored at -18 ºC.
3.2.2 Experimental set-up
Sugar extraction of BSG was performed by acid hydrolysis with sulfuric acid (95 - 98% (w/v) H2SO4, Sigma-Aldrich) under conditions previously optimized by Carvalheiro et al. (2004). To
maintain the liquid/solid ratio of 8 g g-1, 50 g of BSG was added to 388 mL deionized water and
12 mL of H2SO4. The hydrolysis was performed at 121 °C for 20 minutes. Subsequently, the
hydrolysates were centrifuged (4-16 KS, Sigma) for 15 minutes (10 000 × g, 4 °C), and the resulting supernatant was clarified through filtration. In order to improve hydrolysis yield, a second hydrolysis was performed to the pellets resultant from the first hydrolysis. Deionized water and H2SO4 were added to the pellets (ca. 388 mL and 12 mL, respectively) and the second hydrolysis
was performed using the same conditions as in the first hydrolysis. The first and second hydrolyzed BSG were mixed and stored at 4 °C. The hydrolysed BSG was neutralized (pH 7) using Ca(OH)2. After neutralization, hydrolysed BSG was centrifuged for 15 minutes (10 000 × g,
4 °C) and the supernatant was characterized.
The experimental set-up used for the hydrolysis reactions using SCW is shown in Figure 3.2. Deionized water was pumped through a heating section before entering the tubular reactor (stainless steel tube with 51 cm long, 5 cm of external diameter and 2.6 cm of internal diameter) placed in an electric oven with temperature control. BSG was placed inside the reactor and kept between porous discs to avoid biomass to pass to the pipes. A heating cable connected to a temperature controller was used. Pressure was controlled by a back-pressure regulator valve placed at the outlet of the reactor after a cooling section. Temperature and pressure of the outlet water were monitored. The outlet stream, hydrolyzed BSG, was collected for analysis.
Figure 3.2: SCW apparatus used for BSG hydrolysis.
The water flow used, 10 mL min-1, was the same for all the assays. The pressure was kept
constant, at 65 bar and four maximum temperatures were tested: 150, 180, 200 and 230 °C. Several samples were collected during the warm-up period, at different outlet stream temperatures, namely at 50 °C, 50 °C to 100 °C, 100 °C to 150 °C and 150 °C up to the maximum temperature, selected for each assay. The collected samples were stored at -18 °C for analysis.
18
3.2.3 Analytical Procedures
The characterization of acid hydrolysate for ions, sugars, furfural and 5-HMF, was performed by the analytical laboratory, LAQV-REQUIMTE. Briefly, Ca2+, Mg2+, Na+ and S2- quantification was
conducted by inductively coupled plasma atomic emission spectroscopy (ICP-AES) through ICP spectrophotometer (Horiba Jobin-Yvon Ultima) equipped with 40.68 MHz RF generator, 1.00m Czerny-Turner monochromator, AS500 automatic sampler and CMA device (Concomitant Metals Analyzer). Sugars were analyzed by high performance liquid chromatography (HPLC Dionex ICS-3000) using an amperometric detector (PAD-Pulse amperemetric detection), CarboPAC-PA10 250 x 4mm column and an Amino-trap pre-column. Sodium hydroxide (NaOH) 18 mM was used as eluent with 1 mL min-1 flow rate and T = 30 °C. SO42- was also quantified by HPLC (Dionex
ICS-3000) using a conductivity detector, ionPAC AS16 250 x 4mm column. NaOH 22 mM was used as eluent at a flow rate of 1.5 mL min-1 at T = 30 °C. Furan compounds were analyzed by
HPLC (Thermo Finnigan Surveyor) with a UV/Vis detector (Accela λ = 280 nm) through a Biorad Aminex 87H 300 x 7.8 mm column. The analysis was performed using H2SO4 10 mN as eluent
with a 0.6 mL min-1 flow rate at T = 30 °C. Organic acids of filtered samples (VWR, spin filter 0.2
μm) were measured by HPLC using a Biorad Aminex HPX-87H column (300 x 7.8 mm) and a Biorad pre-column (125-0129 30 x 4.6 mm) coupled to an IR detector. The analysis was conducted at 30 °C with sulphuric acid (H2SO4 0.01 N) as eluent at a 0.5 mL min-1 flow rate (Duque
et al., 2014). The organic acids concentrations were calculated through a standard calibration curve (31 - 1000 mg L-1 of each organic acid).
The characterization of hydrolyzed BSG from SCW in terms of sugars and organic acids were performed as described above.
19
3.3 Calculations
The hydrolysis yield on sugars was calculated according to Eq 3.1 by the dividing the amount of sugars extracted (g L-1) by the initial weight of BSG (g) used for hydrolysis:
Hydrolysis yield on sugars (g sugars g BSG-1)= Amount of sugars extractedInitial weight of BSG Eq 3.1
The extent of extraction/hydrolysis of BSG by SCW was determined by dividing the amount of BSG hydrolyzed by the initial amount of BSG placed in the reactor (Eq 3.2):
Extent of hydrolysis (%)= Initial weight of BSG - Final weight of BSGInitial weight of BSG ×100 Eq 3.2
The yield of BSG extract (Eq 3.3) using SCW strategy was calculated by dividing the amount of extract obtained by lyophilizing the samples collected throughout the assay by the initial amount of BSG placed in the reactor:
Yield of BSG extract (%)= Weight of BSG extract
20
3.4 Results and Discussion
Brewer’s spent grain, as mentioned above, is a lignocellulosic material constituted mainly by hemicellulose and cellulose. As a strategy for BSG pre-treatment, acid hydrolysis and subcritical water were performed in order to produce an extract rich in sugars, but with low inhibitory compounds concentrations (Mussatto, 2014). Both pre-treatment methods tested were compared.
3.4.1 Acid hydrolysate characterization
Acid hydrolysis was performed under optimized conditions with a liquid/solid ratio of 8 g g-1, as
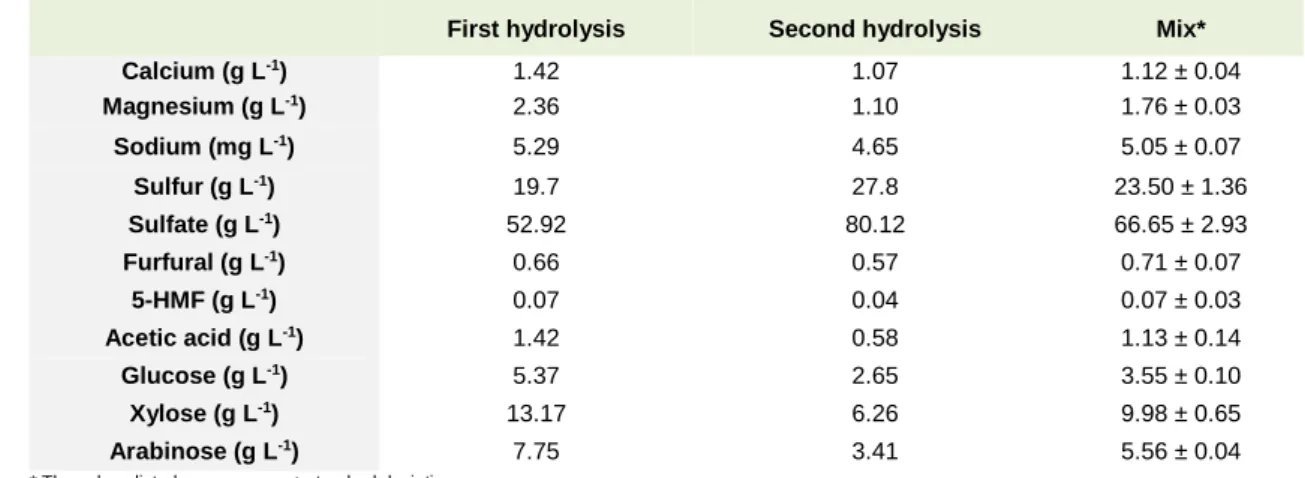
described in the Materials and Methods section. The analysis of acid hydrolyzed BSG, namely first and second hydrolysis and the mix of both hydrolysis, is presented in Table 3.2.
Table 3.2: Initial characterization of acid hydrolyzed BSG.
* The values listed are averages ± standard deviations
The main constituents identified were calcium (Ca2+), magnesium (Mg2+), sodium (Na+), sulfur
(S2-), sulfate (SO42-), acetic acid (HAc), furfural, 5-HMF as well as glucose, xylose and arabinose.
According to the literature, the presence of mineral elements such as Ca2+, Mg2+, Na2+ and S
2-was expected, although in concentrations lower than 0.5%, which 2-was also observed in the present study (Mussatto et al., 2006). From acid hydrolysis, the extracted and identified sugars were xylose, arabinose and glucose (Table 3.2). Xylose was the main extracted sugar, followed by arabinose and glucose. These results are in accordance with Mussatto (2014), which also found that the most abundant sugars in BSG’s fractions corresponds xylose, arabinose and glucose. Furthermore, pentose sugars are the main compounds formed providing a high presence of monosaccharides such as xylose and arabinose (Mussatto and Roberto, 2005).
Additionally, sugars can be degraded during the hydrolysis to some inhibitory compounds, such as HAc, furfural and 5-HMF. In this work, low concentrations of the last two compounds, furfural and 5-HMF, were detected (0.71 ± 0.07 and 0.07 ± 0.03 g L-1, respectively). These results were
similar to the reported by Mussatto and Roberto (2005) that studied acid hydrolysis of BSG at 120 °C under the same liquid/solid ratio, sulfuric acid concentration of 100 mg g-1 and at two reaction
times (0.63 and 0.09 g L-1 after 17 minutes and 0.87 and 0.07 g L-1 after 37 minutes, of furfural
and 5-HMF, respectively). Furfural is always higher than 5-HMF concentrations, providing that pentose sugars (xylose and arabinose) were more susceptible to degradation than hexose sugars
First hydrolysis Second hydrolysis Mix* Calcium (g L-1) 1.42 1.07 1.12 ± 0.04 Magnesium (g L-1) 2.36 1.10 1.76 ± 0.03 Sodium (mg L-1) 5.29 4.65 5.05 ± 0.07 Sulfur (g L-1) 19.7 27.8 23.50 ± 1.36 Sulfate (g L-1) 52.92 80.12 66.65 ± 2.93 Furfural (g L-1) 0.66 0.57 0.71 ± 0.07 5-HMF (g L-1) 0.07 0.04 0.07 ± 0.03 Acetic acid (g L-1) 1.42 0.58 1.13 ± 0.14 Glucose (g L-1) 5.37 2.65 3.55 ± 0.10 Xylose (g L-1) 13.17 6.26 9.98 ± 0.65 Arabinose (g L-1) 7.75 3.41 5.56 ± 0.04
21
(glucose), under the applied conditions (Mussatto and Roberto, 2005). Roberto et al. (1991), that studied acid hydrolysis of sugar cane bagasse to produce ethanol, reported that furfural only represents a problem at levels above 1 g L-1. HAc was also detected in a concentration of 1.13 ±
0.14 g L-1. Mussatto and Roberto (2005), under the same conditions described for furfural and
5-HMF, reported HAc concentrations of 1.20 and 1.34 g L-1 for 17 and 37 minutes of reaction time,
respectively. From a previous study, HAc concentrations above 5 g L-1, in their undissociated
form, totally inhibit growth of Saccharomyces cerevisiae (Taherzadeh et al., 1997).
As it is possible to verify in Table 3.2, most of the compounds were extracted during the first hydrolysis. At high concentrations of extracted sugars, higher concentrations of inhibitory compounds such as HAc, furfural and 5-HMF were achieved, as more extracted sugars can be degraded. In the second hydrolysis, lower concentrations of sugars and mineral elements were obtained, since much of it was already hydrolysed. The increase on S2- and SO42- was expected
as sulfuric acid was used to carry out the hydrolysis. Concerning BSG mix, slight variations were detected, since the volume obtained after each hydrolysis is quite different, due to some losses during the extraction process.
The highly acidic nature of hydrolysates can affect fermentation stage (Chandel et al., 2011). To adjust the pH, a process of neutralization in the acid hydrolysates was used, resulting in salts formation (Lenihan et al., 2010). The overall characterization before and after this step is presented in Table 3.3.
Table 3.3: Hydrolyzed BSG characterization before (first column) and after Ca(OH)2 addition (second column).
*Average values ± standard deviations are presented.
As expected, addition of Ca(OH)2 increase the calcium content of hydrolyzed BSG. Sulfur and
sulfate content decreases due to calcium sulphate precipitate formation. Furfural and 5-HMF concentrations decrease with Ca(OH)2 addition (Table 3.3). This might be due to its conversion
to other less toxic compounds (Purwadi et al., 2004). Furthermore, although a small decrease of
Before Ca(OH)2 addition* After Ca(OH)2 addition* Calcium (g L-1) 1.20 ± 0.04 4.60 ± 0.33 Magnesium (g L-1) 1.76 ± 0.03 3.90 ± 0.04 Sodium (mg L-1) 5.05 ± 0.07 4.90 ± 0.01 Sulphur (g L-1) 23.50 ± 1.36 3.14 ± 0.72 Sulphate (g L-1) 66.65 ± 2.93 4.61 ± 1.81 Furfural (g L-1) 0.71 ± 0.07 0.26 ± 0.05 5-HMF (g L-1) 0.07 ± 0.03 0.03 ± 0.005 Acetic acid (g L-1) 1.13 ± 0.14 1.52 ± 0.000 Glucose (g L-1) 3.55 ± 0.10 3.35 ± 0.31 Xylose (g L-1) 9.98 ± 0.65 9.20 ± 0.23 Arabinose (g L-1) 5.56 ± 0.04 4.94 ± 0.06 Total protein (g L-1) - 19.7 ± 2.10 NH4+ (mmol N L-1) - 45.8 ± 0.10 PO43- (mg P L-1) - 2.33 ± 0.79 Total nitrogen (mmol N L-1) - 188.7 ± 33.6 C:N:P ratio (C-mol:N-NH4+-mol:P-mol) - 100:33:2
22
sugars concentration with Ca(OH)2 addition was observed, it was not significant. To evaluate the
overall acid hydrolysis process, the hydrolysis yield on sugars from BSG was calculated and summarized in Table 3.4.
Table 3.4: Hydrolysis yield on sugars from BSG by acid hydrolysis.
*Average ± standard deviations are presented.
Comparing the hydrolysis yield on sugars from BSG using acid hydrolysis (Table 3.4) it was observed that the hydrolysis yields of each sugar were higher in the first hydrolysis than in the second hydrolysis. Consequently, higher hydrolysis yield on total sugars was obtained in the first hydrolysis (0.123 g total sugars g BSG-1 in the first hydrolysis versus 0.041 g total sugars g BSG -1 in the second hydrolysis). As the most extracted sugars were xylose and arabinose, regardless
of the hydrolysis, higher yields were obtained. Second hydrolysis was performed in order to extract sugars still present, improving hydrolysis yield. Since acid hydrolysis was performed twice, hydrolysis yield was achieved by mixing the first and second hydrolyzed BSG, resulting in a 0.152 ± 0.01 g total sugars g BSG-1.
3.4.2 Characterization of BSG hydrolysate using SCW
To evaluate a greener BSG pre-treatment strategy, SCW was selected and the effect of temperature on extraction/hydrolysis efficiency of BSG was studied. Four temperatures (T = 150, 180, 200 and 230 °C) were tested and water flow rate was maintained at 10 mL min-1 for all
assays. During the hydrolysis process, it was observed a change in the color of the samples recovered. In the beginning, samples were clear and slightly yellow but along the hydrolysis, they became darker and turbid until maximum temperature was reached, where samples became brown (Figure 3.3). Pourali et al. (2009), that used SCW to treat rice bran to produce valuable materials, observed a similar colour change to brown at moderate temperatures (i.e. 160 - 280 °C) and with 5 minutes of reaction time. Hata et al. (2008) studied extraction of defatted rice bran using SCW and reported that brown color could be a result from Maillard reaction or from carbohydrates caramelization.
First hydrolysis Second hydrolysis
Mix* (First and second
hydrolysis) Glucose (g glucose g BSG-1) 0.025 0.009 0.028 ± 0.00 Xylose (g xylose g BSG-1) 0.061 0.021 0.080 ± 0.01 Arabinose (g arabinose g BSG-1) 0.036 0.011 0.044 ± 0.00 Total sugars (g total sugars g BSG-1) 0.123 0.041 0.152 ± 0.01