Universidade do Algarve
Faculdade de Ciências do Mar e do Ambiente
The Cape Verde Coastal Ecosystem
A Study of Community Structure, Trophic
Interactions and Exploitation Pattern
Kim Araújo Stobberup
Doctor of Philosophy Dissertation in Fisheries Science and Technology
Doutoramento em Ciências e Tecnologias das Pescas
Universidade do Algarve
Faculdade de Ciências do Mar e do Ambiente
The Cape Verde Coastal Ecosystem
A Study of Community Structure, Trophic Interactions
and Exploitation Pattern
O Ecossistema Costeiro de Cabo Verde
Estudo sobre a Estrutura de Comunidades, Interacções
Tróficas e Padrão de Exploração
by / por
Kim Araújo Stobberup
Supervised by / Orientado por
Professor Karim Erzini
Dissertation submitted for the degree of Doctor of Philosophy in Fisheries Science
and Technology
Dissertação apresentada à Universidade do Algarve para obtenção do grau Doutor em
Ciências e Tecnologias das Pescas
iii
Abstract
A mass-balance trophic model was created to describe the coastal ecosystem of the Cape Verde Archipelago for the time period from 1981 to 1985, using available estimates on biomass and catches. This time period was characterised by predominantly artisanal fisheries and a low level of motorisation; the initial phase of a more intensive fishery development. Subsequently, a dynamic simulation model, using Ecopath with Ecosim, was used to simulate from 1986 to 2000, incorporating time series information on biomass, catches and catch per unit of effort (CPUE). Using this approach, a number of problems were detected in model specification such as incompatible biomass estimates for small pelagics and various demersal fish groups. Measures of fishing effort in fishing days or trips were found to be unreliable, in particular for the artisanal fishery. Available biomass estimates for small pelagic resources from acoustic surveys were questionable. Conventional biomass dynamic modelling was therefore applied to estimate biomass of small pelagics and provide indications for management purposes, including parameter estimation and risk assessment using the “frequentist” and Bayesian approaches. After a number of adjustments applied to the initial model, the approach used in simulation was to fit the model to observed catch estimates by adjusting effort, placing less emphasis on fitting to CPUE and biomass estimates. A reasonable overall fit to time series of catches was obtained for 18 fish groups, using only two overall trends for artisanal and industrial effort and three specific trends for small pelagics, yellowfin, and skipjack, which are the main targets of the indutrial fisheries. The observed decrease in abundance of important predators such as yellowfin and skipjack tuna resulted in decreased predation on neritic pelagic species and some demersal fish groups, but this was compensated by higher fishing mortality over the study period. Consequently, the model estimated an almost constant biomass of neritic fish species from 1986 to 2000. Overall fish biomass decreased by 10 percent, including pelagic migratory species. Relative fishing effort was assumed to have almost tripled over the time period from 1986 to 2000 (effort directed towards small pelagics was assumed to have increased by a factor 5), but this resulted in only a 19 per cent increase in catches. Thus, previous assessments of potential fish harvest, ranging from 25 000 to 58 000 tonnes, appear to have been overly optimistic.
Alternative methodologies were applied to assess the fishery resources in Cape Verde in order to gain further understanding on the dynamics of the system and the effects of fishing over time as well as to validate the results of ecosystem modelling. This included non-parametric multidimensional scaling (MDS), generalized linear models (GLM), size spectra analysis, and a type of time series analysis (MAFA). The changes observed over time in the size structure and species composition/abundance of demersal fish communities were slight or even negligible. There was a tendency for lower abundance of demersal fish in recent years, but a decreasing trend was not apparent. It is however important to note that these
results were based on trawl survey data, which concern a limited area of trawlable grounds in Cape Verde. In contrast, time series analysis of catch data indicates that a shift has occurred with decreasing catches of important pelagic species such as yellowfin and skipjack tuna and increasing catches of small pelagics and neritic tuna as well as some demersal species. Simulation with Ecosim gave similar results as they were based on the same catch data, but this is nevertheless reassuring as alternative methods gave consistent results. We believe that this study has been successful in taking the first steps towards an ecosystem approach to assess the effects of fishing in Cape Verde, but further research is necessary to resolve some crucial issues such as the conflicting results on demersal fish biomass and the possible over-exploitation of demersal predators and moray eels. Priority should also be given to the definition of fleet components, effort and CPUE estimation, and the study of increasing efficiency, using the available catch and effort data.
v
Resumo (Português)
Foi criado um modelo trófico para descrever o ecossistema costeiro do arquipélago de Cabo Verde para o período de 1981 a 1985, utilizando estimativas disponíveis de biomassa e capturas. Este período pode ser considerado a fase inicial de desenvolvimento das pesquerias, sendo de carácter artesanal predominante e com baixo uso de motores na pesca. Verifica-se que as capturas têm variado ao longo do tempo do estudo, entre 1986 e 2000, mas existe uma evolução de aumento gradual de 7 000 a 10 000 toneladas composto maioritariamente por pequenos (cavala preta) e grandes (atuns) pelágicos.
Subsequentemente, um modelo dinâmico de simulação (Ecopath com Ecosim) foi utilizado para simular as séries temporais de biomassa, capturas e captura por unidade de esforço (CPUE) no período de 1986 a 2000. Como resultado desta abordagem foram detectados vários problemas na especificação dos parâmetros do modelo tal como estimativas incompatíveis de biomassa para os pequenos pelágicos e vários grupos demersais de peixes. Determinou-se que as medidas do esforço da pesca em dias ou viagens de pesca não são fiáveis, particularmente no caso da pesca artesanal. As estimativas disponíveis de biomassa para os pequenos pelágicos, baseados em campanhas acústicas, parecem ser pouco fiáveis. Portanto, um modelo dinâmico de produção geral foi aplicado para obter estimativas de biomassa para os pequenos pelágicos e mais ainda, indicadores e recommendações para a gestão deste recurso, utilizando métodos “bootstrap” e Bayesianos. Depois de aplicar um número de ajustes ao modelo ecossistémico inicial, o método utilizado na simulação foi a de ajustar às capturas como objectivo principal, dando menos ênfase às observações de CPUE e biomassa. Conseguiu-se um ajuste razoável às 18 séries temporais de captura de peixes, utilizando dois padrões de evolução do esforço para a frota artesanal e industrial e três padrões específicos para os pequenos pelágicos, rabil, e gaiado, sendo estes os principais alvos da pesca industrial.
A diminuição observada na abundância de predadores importantes tais como a albacora e o gaiado resultou numa diminuição da predação em peixes costeiros, tanto pelágicos como demersais. No entanto, esta diminuição de mortalidade foi compensada por um aumento da mortalidade por pesca durante o período em estudo. Consequentemente, o modelo estimou uma biomassa quase constante de espécies costeiros entre 1986 e 2000. A biomassa total dos peixes diminuiu em 10 por cento, incluindo os grandes migradores pelágicos. É suposto que o esforço relativo de pesca quase triplicou durante o período de 1986 a 2000 (em relação aos pequenos pelágicos o esforço é suposto ter aumentado com um factor 5), mas este aumento significativo de esforço resultou apenas num aumento de 19 por cento nas capturas.
Várias metodologias alternativas foram aplicadas para avaliar o estado dos recursos marinhos em Cabo Verde a fim de melhorar o conhecimento sobre a dinâmica do sistema e determinar os efeitos da pesca como também proceder à validação dos resultados do modelo ecossistémico. Estes métodos incluiram análise multivariada (MDS), modelos lineares
generalizados (GLM), análise de estrutura de tamanhos (size spectra), e análise de séries temporais (MAFA). Não foram observadas alterações significativas em relação à estrutura de tamanhos e na composição/abundância de comunidades demersais de peixes durante o período em estudo. Verificou-se uma tendência para a diminuição na abundância de peixes demersais em anos recentes, mas o padrão não era significativo. É de salientar que estes resultados foram baseados em dados de campanhas de arrasto, o que abrange uma área limitada de fondos adequados em Cabo Verde. Por outro lado, a análise de séries temporais de capturas indicam uma alteração importante com a diminuição dos grandes migradores pelágicos, nomeadamente a albacora e gaidao, e um aumento nas capturas de pequenos pelágicos, atuns costeiros e algumas espécies demersais. A simulação com Ecosim deu resultados similares, com base nos mesmos dados de capturas, o que demonstra resultados consistentes apesar de utilizar métodos alternativos.
Considera-se que este estudo foi bem sucedido como primeira tentativa de fazer um abordagem ecossistémica para avaliar os efeitos da pesca em Cabo Verde, mas é necessário investigar e ressolver alguns assuntos cruciais tais como os resultados contraditórios referente à biomassa dos peixes demersais e a possível sobre-exploração de predadores demersais e moreias. Considera-se de prioridade a definição de componentes da frota, melhorar as estimativas de esforço e CPUE, e o estudo da eficiência crescente, utilizando os dados disponíveis de captura e esforço.
vii
Acknowledgements
When undertaking a study that has to do with the ecosystem approach to fisheries, it is only natural that such a study builds upon the work undertaken by and collaboration of many persons and institutions.
First of all, I would like to thank Karim Erzini for accepting to supervise a “wild card” such as myself, and for being an excellent supervisor, providing inspiration, guidance, support, and for always being able to spare some time to help. I would like to thank Lucília Coelho without whom I would not have embarked on this study and for always being ready to give me inspiration during the work. I would also like to thank Graça Pestana for creating the conditions for me to survive and become part of IPIMAR as well as for her support in carrying out the work.
My sincere gratitude to my friends and colleagues in Cape Verde; particularly Vito Ramos, Carlos Monteiro, Vanda Marques, and Oksana Tariche, for being so forthcoming and willing to work together with me. I would also like to acknowledge the work undertaken by Norwegians and Icelanders in Cape Verde such as several historical surveys, which were essential for this study.
I would like to gratefully acknowledge the Fisheries Institutes in Portugal, INIAP-IPIMAR, and Cape Verde, INDP, for supporting this study and providing me with the conditions to make it possible. This study would not have been possible without the financial support from the “Fundação para a Ciência e a Tecnologia”, Portugal. I would also like to thank the European Commission for providing me with a two-year Marie Curie Individual Fellowship to pursue much of the work undertaken in preparation for this study and for believing in my research potential. The European Commission also provided an ideal setting in the form of the “Fisheries Information and Analysis System” project for Northwest Africa. This project gave me the opportunity to receive training and guidance from prominent scientists such as Daniel Pauly, Villy Christensen, and Didier Gascuel and the possibility of embarking on interesting collaborative research with my fellow colleagues in the Northwest African region. I am grateful to all that participated in the project, particularly Cheikh Inejih, Djiby Thiam, Seco Mané, Sory Traoré, François Domain, and Alain Cavarivière.
Also, I would like to express my gratitude to Patrícia Amorim, in particular, as well as the other members of the Portuguese “African” group such as Ana Moreira, Aida Campos, Cristina Ribeiro, Miguel Santos, Paulo Fonseca, and Ernesto Jardim for being helpful and for their listening ear and encouragement.
I dedicate this to
Cecilia and Sara
for their devotion, inspiration, patience, and for pulling me
away from work to play and breath fresh air.
ix
Contents
Abstract ...iii
Resumo (Português) ... v
Acknowledgements ... vii
Chapter 1. General Introduction ... 1
1.1
Ecosystem Approach to Fisheries ... 3
1.2
Science and Tools for the Ecosystem Approach ... 4
1.3
Tropical Fisheries in (Mostly) Developing Countries... 5
1.4
The Cape Verde Archipelago ... 6
Biogeography... 7
The North Atlantic Tropical Gyral Province ... 8
1.5
Objectives and Relevance ... 10
Chapter 2. Fisheries and Survey Data... 12
2.1 Introduction ... 12
2.2
Materials and Methods ... 13
Fisheries data ... 13
Survey data... 14
Data standardisation... 15
2.3
Results and Discussion... 15
Fisheries data ... 15
Survey data... 21
Large pelagic resources ... 21
Small pelagic resources ... 23
Demersal fish resources ... 23
2.4 Concluding
Remarks ... 26
Chapter 3. Model of the Coastal Ecosystem: first attempts with Ecopath ... 30
3.1 Introduction ... 30
3.1
Materials and Methods ... 31
The Modelling Approach ... 31
The Cape Verde Model ... 32
Ecological Groups ... 32
Migration ... 36
Parameter Estimation ... 36
3.3
Results and Discussion... 38
Chapter 4. Changes in the Coastal Ecosystem over the Last Two Decades: a simulation
study using Ecosim ... 45
4.1 Introduction ... 45
4.2
Materials and Methods ... 46
Parameter estimation... 47
Simulation with Ecosim... 49
4.3
Results and Discussion... 51
Chapter 5. Assessing small pelagic resources in Cape Verde: a comparison of the
“frequentist” and Bayesian approaches to biomass dynamic modelling. ... 59
5.1 Introduction ... 59
5.2
Materials and Methods ... 61
Standardised Abundance Index... 61
Biomass dynamic model ... 63
Specifying r ... 63
Dynamic fitting process ... 64
Bayesian modelling... 66
BSP implementation ... 68
5.3 Results ... 68
Comparison with the Bayesian modelling approach ... 70
5.4 Discussion ... 74
To be Bayesian or to bootstrap?... 77
Chapter 6. Quantitative Ecosystem Indicators: applications in Cape Verde ... 81
6.1 Introduction ... 81
6.2
Materials and Methods ... 82
Multivariate analysis ... 83
Generalized linear models... 84
Time series analysis ... 85
6.3 Results ... 86
Structure of demersal fish assemblages ... 86
Demersal fish abundance over time ... 89
Time series analysis ... 92
6.4 Discussion ... 93
Abundance and CPUE over time ... 95
6.5 Conclusions ... 97
Chapter 7. General Conclusions and Discussion... 99
7.1 Working
Hypotheses ... 100
7.2
The Ecosystem Model: improvements and projections ... 105
Improvements to the Model ... 106
Major Sources of Uncertainty ... 109
Projections with the Ecosystem Model... 110
7.3
Priorities for Future Research ... 111
8.
References ... 114
9.
Appendices... 128
Appendix A.
Catches (tonnes) by species in Cape Verde... 128
xi
Appendix C. List of fish species by ecological group... 130
Appendix D. Diet References... 133
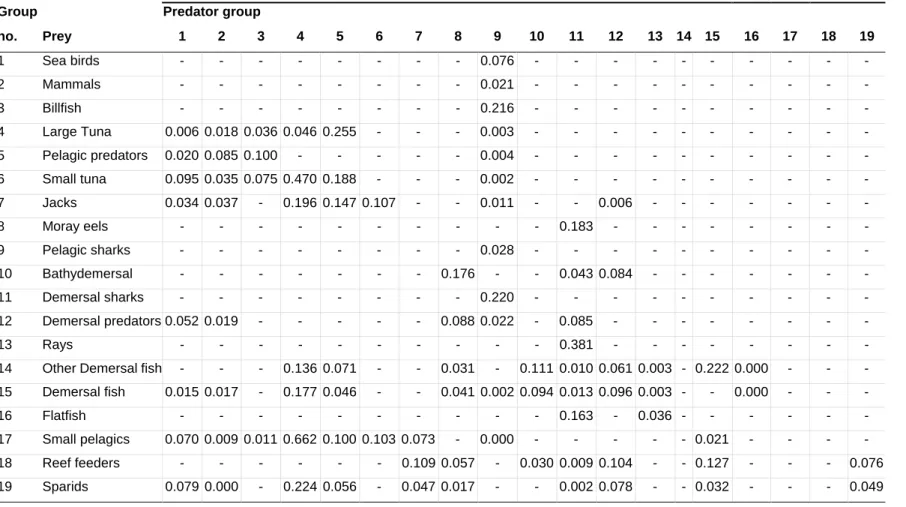
Appendix E. Diet matrix referring to Chapter 3 ... 135
Appendix F. Diet matrix referring to Chapter 4... 137
Appendix G. Species considered in each of the eight families (BVSTEP) ... 138
Appendix H. SIMPER results ... 139
Appendix I. Ecosim simulation results ... 140
List of Figures
Page
Figure 1.1. Map of the Cape Verde Archipelago. 7 Figure 2.1. Total catch estimates in Cape Verde based on different sources. 17 Figure 2.2. Revised total catches for the period 1981 to 2001. 18 Figure 2.3. Artisanal and industrial fishery catches in Cape Verde. 18 Figure 2.4. Artisanal and industrial catch per unit of effort (CPUE). 19 Figure 2.5. Artisanal and industrial effort. 19 Figure 2.6. Composition of artisanal catches by species groups. 20 Figure 2.7. Industrial catches by species groups. 21 Figure 2.8. Motorisation in the artisanal fisheries. 21 Figure 2.9. Map of sampling by bottom trawl, including surveys and commercial fishing. 25 Figure 2.10. Biomass over time in the total survey area. 26 Figure 2.11. Atlantic catches of skipjack and yellowfin tuna. 28 Figure 2.12. Map of skipjack and yellowfin tuna catches. 29 Figure 3.1. Mixed trophic impacts of model groups. 45 Figure 4.1. Trends in relative fishing rate used for simulating from 1986 to 2000. 55 Figure 4.2. Comparison of simulated and observed abundance of important large pelagics. 56 Figure 4.3. Comparison of simulated and observed abundance of neritic groups. 57 Figure 4.4. Comparison for Small pelagics and Small tuna. 58 Figure 4.5. Comparison for Demersal fish, Sparids and Herbivores. 58 Figure 4.6. Comparison for Demersal predators and Moray eels. 59 Figure 5.1. Artisanal and industrial catches of small pelagics. 61 Figure 5.2. CPUE (kg per fishing day) of small pelagics. 65 Figure 5.3. Estimated probability density function for r. 66 Figure 5.4. Plot of catch against standardised effort. 71 Figure 5.5. Estimated biomass levels (bootstrap Model 3) for the time period 1987 to 2001. 72 Figure 5.6. Observed and predicted CPUE values, using the Bayesian and bootstrap models. 73 Figure 5.7. The marginal posterior distribution and prior of r. 74 Figure 5.8. The marginal posterior and prior of K and the bootstrap K. 74 Figure 5.9. The marginal posterior distribution of YMSY and the bootstrap YMSY . 75
Figure 5.10. Estimated biomass levels using the Bayesian model. 75 Figure 6.1. Two-dimensional MDS plot based on the similarity of haul stations. 89 Figure 6.2. MDS plots based on averaged catches by Year and Depth. 90 Figure 6.3. Mean abundance of eight families over Year and Depth. 91 Figure 6.4. Abundance of demersal fish over time. 93 Figure 6.5. Plot of the first MAFA axis showing the trend over time. 94 Figure 6.6. Plot of the canonical correlations between species groups and the first MAFA axis. 95 Figure 7.1. Sea surface temperatures during the cold and warm seasons in Cape Verde. 103 Figure 7.2. Precipitation in Cape Verde. 103 Figure 7.3. Artisanal and industrial catches of small tuna. 105 Figure 7.4. Estimated biomass of small pelagics using various methods. 106 Figure 7.5. Catch and effort of demersal fish groups. 107 Figure 7.6. Trends in fishing effort, expressed as relative fishing rate, used in the revised model. 109 Figure 7.7. Observed and simulated catches using Ecosim. 110
xiii
List of Tables
Page
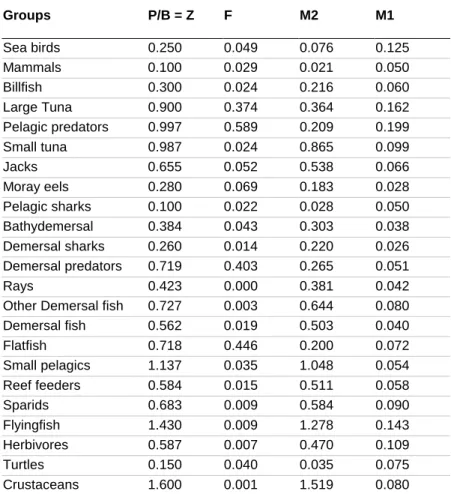
Table 2.1. List of surveys undertaken in Cape Verde. 15 Table 2.2. Gear characteristics used in the standardisation of surveys catches. 16 Table 2.3. Estimated catch rates in the artisanal fishery given for each island. 18 Table 2.4. Species composition of longline survey catches. 23 Table 2.5. Catch rates and abundance of demersal fish over time in Cape Verde. 26 Table 3.1. Estimated fisheries catch by ecological group and fishing fleet. 34 Table 3.2. Basic input and estimated parameters of the Ecopath model. 35 Table 3.3. Dominating species by “higher” groups. 36 Table 3.4. Type of weighting procedure adopted for parameter estimates. 38 Table 3.5. The resulting predation mortalities for the higher trophic levels of the model. 42 Table 3.6. Estimated total mortality. 43 Table 4.1. Comparison of parameter estimates, 1986-2000, of the simulation. 52 Table 5.1. Catch and CPUE of small pelagics in the artisanal and industrial fishery. 64 Table 5.2. Parameter and management reference estimates from in the dynamic fitting process. 71 Table 5.3. Parameter and management reference estimates, bootstrap and Bayesian models. 73 Table 5.4. Consequences of alternative TAC policies for the stocks of small pelagics. 76 Table 5.5. Results of previous assessments on mackerel scad, Decapterus macarellus. 77 Table 6.1. Trawl surveys considered in the study. 84 Table 6.2. Results of ANOSIM for the various combinations of Year, Area and Depth. 89 Table 6.3. GLM results for Cape Verde. 92 Table 6.4. GLM results for trawl survey data only. 93 Table 6.5. Number of haul stations by Area and Depth strata over time. 96 Table 7.1. Basic parameters used for small pelagics in the original and revised model. 108 Table 7.2. Changes applied to the diet matrix of the original Ecopath model. 108 Table 7.3. Summary of results of the simulation in terms of biomass and catch changes over the
Chapter 1. General Introduction
Our perception of the bountiful seas has changed much over time. In 1883, one of the best-known scientists, Thomas Huxley (Huxley, 1884 in Haddon, 2001), stated that:
“I believe then that the cod fishery, the herring fishery, pilchard fishery, the mackerel fishery, and probably all the great sea-fisheries are inexhaustible; that is to say nothing we can do seriously affects the number of fish. And any attempt to regulate these fisheries seems consequently, from the nature of the case to be useless.”
This view by Huxley was countered by Ray Lankester, who voiced his concerns for the removal of spawning stock and called for consideration of non-target species, since all species had their place in the complex interactions of living beings within their area (Botsford et al., 1997). Despite appeals for ecosystem management at the end of the 20th Century and the development of multispecies models, few fisheries are actually managed on this basis (Sainsbury, 1998; Christensen, 2004).
Overall abundance was considered to be essentially unlimited and renewal from year to year constant. The explanation for the large fluctuations in catches from the traditional fishing grounds in northern European waters was the “migration theory” (Ulltang, 1998). According to the theory, change in adult migration behaviour in relation to physical oceanographic variability generated fluctuations in landings. Johan Hjort made a fundamental contribution to fishery science by explaining the fluctuations in landings by “year class” variations in stocks with a limited geographical distribution (local stocks), which was in contrast to the migration theory (Hjort, 1914 in Ulltang, 1998). The stage was set for a long debate on the relative importance of environmental effects and climate for the fluctuations of fish stocks (Botsford et al., 1997; Jackson et al., 2001; Jacobson et al., 2001; Klyashtorin, 2001; Pauly et al., 2002).
Regarding the effects of fishing on the ecosystem, the first known incident is in 1376 when the British Parliament received protests from fishermen concerned about the damage being done to their fisheries by trawling (Groot, 1984 in Humborstad, 2004). Centuries would pass until the first scientific survey in 1938 concluded that there was no evidence of long-term effects of trawling (Graham, 1955 in Humborstad, 2004). This view prevailed until recently, at least until the early 1990s, when trawling was considered to have little detrimental impact, or even a beneficial impact, analogous to the ploughing of fields. Recent results suggest that a more appropriate analogy would be the clear cutting of forests in the course of hunting for deer (Pauly et al., 2002).
Present day reality is quite different in that many important fisheries resources world-wide can be characterised as seriously depleted or in danger of depletion due to poor management
Introduction
2
practices and excessive fishing pressure (Pauly et al., 1995, 1998, 2002; Grainger and Garcia, 1996; Botsford et al., 1997; Jackson et al., 2001; FAO, 2002-a; Baum et al., 2003; Christensen et
al., 2003; Myers and Worm, 2003). A recent assessment by the FAO found that around a
quarter of the world’s fisheries resources are considered “overexploited” and half are “fully exploited” (Garcia and Moreno, 2001; FAO, 2002-b). Unsustainable fishing practices coupled with an excessive level of investment in fishing capacity have resulted in serious degradation and low yields in the stocks of developed countries, creating new pressures on the resources of developing countries (Pauly et al., 2002). These pressures are largely trans-national, highlighting the importance of regional and international aspects for resource management (Bonfil et al., 1998; FAO, 2002-b; Pauly and Palomares, 2002).
The concept of sustainability has become an integral part of modern day fisheries management, but this concept has been criticised on numerous occasions. The reasoning behind these criticisms has been that it is difficult, if not impossible, to define sustainable harvest levels in highly complex and dynamic ecosystems (e.g. Sainsbury, 1998). Criticisms appear to be associated with the common practice, at present, of managing fisheries at the limit of collapse, maximizing resource utilisation and maintaining effort relatively stable. Another criticism stresses that the concept is fundamentally flawed, because there is little point in sustaining stocks whose biomass is but a small fraction of its value at the onset of industrial fishing (Pauly et al., 2002). Rebuilding of marine ecosystems to previous historical levels is considered more important by these authors (Pitcher, 1996; Pauly et al., 2002), but defining the previous level (e.g. the shifting baseline syndrome) and whether it is possible (e.g. habitat changes, regime shifts, catastrophic shifts, alternate states) is under debate. There is however no doubt that a drastic reduction of fishing capacity is necessary, globally.
So what is the reason for the numerous failures in spite of considerable efforts and investments in fisheries research and management? Two classical examples of collapses are the Peruvian anchovy fishery and the northwestern Atlantic cod stocks. But there is still much debate about the driving force that led to these and other collapses, although there is consensus that incorrect assessment advice and poor management procedures played a role (Walters and Maguire, 1996; Botsford et al., 1997; Gascuel et al., 1998; Longhurst, 1999; Sainsbury, 1998; Ulltang, 1998; Pauly et al., 2002). A fundamental flaw in the management process has been termed the ratchet effect (Botsford et al., 1997), where managers under political pressure will allow harvests to increase for their short-term benefits to society (jobs and profits) when fishery scientists cannot specify with certainty that the next increase will lead to over-fishing and collapse.
Stock assessment methods range from simple to highly complex approaches, depending on the type of data available or the school of thought (Sparre and Venema, 1992; Hilborn and Walters, 1992; Funk et al., 1998; Quinn II and Deriso, 1999; see also1). Recent developments in
1
“Assessment and Management of New and Developed Fisheries in Data-Limited Situations”, 21st Lowell Wakefield Fisheries Symposium, 22-25 October 2003, Anchorage, Alaska;
stock assessment methods have placed much emphasis on uncertainty and risk analysis as this has been identified as a weak point (Punt and Hilborn, 1997; Hilborn and Liermann, 1998; Sainsbury, 1998). Another interesting aspect has been the development of meta-analytic, comparative and demographic approaches used in a Bayesian (or not) context in order to reduce uncertainty in stock assessment (Cortés, 1998; Hilborn and Liermann, 1998; McAllister et al., 2001; Myers, 2001; MacKenzie et al., 2003). Concurrently, procedures for the evaluation of a management process through simulating and testing have been developed (Punt and Hilborn, 1997; Sainsbury, 1998; Butterworth and Punt, 1999; McAllister et al. 1999; Sainsbury et al., 1999). This includes a range of key aspects of the process such as the monitoring programme, data collection, stock assessment model and alternative hypotheses regarding the population dynamics of the stock in question. Other aspects considered are the specification of alternative management strategies, selection and evaluation of performance measures, feed-back system and decision rules and the evaluation of all these through simulation in order to create a robust operational management strategy.
1.1 Ecosystem Approach to Fisheries
The concept of fish stock became the core concept of theoretical developments and empirical studies during much of the 20th Century, referring to a basic population of fish that can be
represented by life history parameters relating to the population rather than its individuals. Johan Hjort´s theory of “year classes”, whose success dictated the observed fluctuations in landings, implied a basic population that led to the concept of stock (Degnbol, 2001). Research was generally structured according to species at the national and international level. The researchers involved became advocates of methods and measures that seemed best adapted for particular species that they studied, and the overfishing problem became thus divided (Graham, 1948 in Degnbol, 2001). Fisheries science focussed on maximising the yield of single species or stocks and Maximum Sustained Yield (MSY) became the central goal of management, ignoring the wider impacts of fishing such as accidental bycatch, habitat degradation and ecosystem attributes such as functionality and productivity (Botsford et al., 1997; Jennings and Kaiser, 1998; Degnbol, 2001; Pauly et al., 2002).
However, the scope of international fisheries management changed in the early 1990s when two new considerations entered the scene: the precautionary approach and the need to include considerations on the ecosystem effects of fishing into management (Degnbol, 2001). The need to reduce the alarming trend of depletion and degradation was recognized in many international fora, most recently at the 2002 World Summit for Sustainable Development (WSSD) in Johannesburg, which pledged to maintain or restore stocks to levels that can produce the maximum sustainable yield with the aim of achieving these goals for depleted stocks on an urgent basis and where possible not later than 2015 (FAO, 2003; Garcia et al., 2003). This choice of the MSY as a goal is unfortunate, because it is in conflict with another resolution by the WSSD: to encourage the application by 2010 of the ecosystem approach to fisheries, noting the Reykjavik Declaration on Responsible Fisheries in the Marine
Introduction
4
Environment (Article 30d). The problem is that MSY as a goal has been associated with many failures in management (Botsford et al., 1997; Mace, 2001; Pauly et al., 2002) and it appears not to be a good management objective in an ecosystem context, because it is achieved by eliminating the large predators and simplifying the system (Mendelssohn, 1980; Gislason, 1999; Hollowed et al., 2000).
The term ecosystem approach to fisheries (EAF) implies the goal of conserving the structure, diversity and functioning of ecosystems through management actions that focus on the biophysical components of ecosystems (including protected areas) as well as fisheries management, which aims to meet the goals of satisfying societal and human needs for food and economic benefits through management actions that focus on the fishing activity and the target resource (not only maximising yield!) (FAO, 2003). Unfortunately, objectives such as maintaining high employment, high profits, and high stock sizes are often in conflict with one another in an ecosystem context (Gislason, 1999; Mace, 2001), thus the importance and difficulty of defining operational objectives and reference points.
1.2 Science and Tools for the Ecosystem Approach
According to Degnbol (2001), fisheries science is now facing two fundamental problems in order to adapt to current management requirements in the context of EAF.
• “Fisheries research is approaching the limits of cost efficiency relative to the value of
fisheries and can still not deliver the goods in terms of numerical predictions.”
• “The models and concepts of fishery biologists are becoming increasingly alien to
stakeholders. This gap is not just a question of lack of understanding or education on the side of fishers but is rather associated with the basic scales at which the resource basis for fisheries is observed and understood.”
Concerning the latter point, Degnbol (2001) refers to the global or large-scale approach by fisheries science in contrast to the detailed spatial and temporal scale of fishing activities. Degnbol (2001) puts forward two alternatives:
• “To internalise the issue in the same way as was done before when species
interactions and uncertainty was internalised, that is by developing models with new layers of complexity which include all relevant processes and effects and thus enables ecosystem effects to be predicted within stochastic predictability.”
• “To develop a fundamentally new approach which does not pretend to understand
or measure causal relationships and all relevant processes in detail but identifies specific features which can be measured and indicate the pressures on the system.” It is quite obvious from the line of reasoning above that Degnbol considers the second alternative (e.g. ecosystem indicators) the most viable. However, the middle path with a
blending of the two schools of thought, reductionist and holistic represented by these two alternatives, respectively, is another way forward and there are some examples of this. The developments of methods and tools for the implementation of EAF has been an intensive field of research in recent years (Gislason et al., 2000; Cury and Christensen, 2004). Multispecies and system models of varying complexity have been developed (Hollowed et
al., 2000). Many studies have dealt with the ecosystem effects of fishing in order to gain a
better understanding of ecosystem dynamics and develop new complementary management tools, quantitative ecosystem indicators (Jennings and Kaiser, 1998). Current efforts are underway to develop the theory behind these indicators, considering changes in marine ecosystems from environmental, ecological and fisheries perspectives, including the robustness and usefulness of these proposed indicators (Jennings et al., 2002; Rochet and Trenkel, 2003; Trenkel and Rochet, 2003). The goal is to define innovative or conjugate reference points that can serve as effective EAF management objectives and thus improve on the current state of fisheries resources.
Many question however whether it is possible to incorporate ecosystem objectives in management, as this would increase the uncertainty involved and predictions would be extremely difficult. Instead, it has been suggested that modelling efforts should include only crucial trophic interactions, indicators, or climate proxies and only if this decreases uncertainty (Livingston and Methot, 1998; Sainsbury, 1998; Beamish and McFarlane, 1999; Collie and DeLong, 1999; Hollowed et al., 2000). A convincing argument by Christensen and Pauly (2004) is that ecosystem modelling is not intended to replace stock assessment, but rather complement it. In fact, ecosystem modelling often feeds on conventional single-species stock assessment results. The complementary use of these two types of tools, stock assessment and ecosystem modelling, represent tactical (setting of TACs) and strategic (policy exploration) thinking, respectively (Christensen and Pauly, 2004). It appears that this is also a question of changing paradigms amongst the stakeholders, including the people in industry, management and research.
1.3 Tropical Fisheries in (Mostly) Developing Countries
Fisheries science includes few contributions to the specific problems of tropical fisheries and the contribution of scientists from western industrialised countries can be characterised as the “tropicalization” of Beverton and Holt (Pauly, 1998), which is applying the same concepts and methods from temperate areas. However, as ageing of fish is difficult and prohibitively costly in most tropical fisheries, age-based models were converted to length-based models (Sparre and Venema, 1992). The most commonly used model (Jones Length Cohort Analysis) is nevertheless considered a poor alternative to age-based methods (Hilborn and Walters, 1992; Smith and Addison, 2003).
Introduction
6
The relatively large number of species present in tropical fisheries and the importance of artisanal fishers in developing countries using a variety of gears and targeting numerous species is another problem, posing serious difficulties in terms of methodology. One approach used has been multispecies ecosystem modelling with Ecopath (Christensen and Pauly, 1993), which considers ecological groups rather than age structured population dynamics. This has resulted in numerous models that have been excellent as structuring tools, for hypothesis testing, identifying major gaps and research priorities as well as policy exploration, but their use in management is limited if not non-existent at present (Christensen, 2004).
Considering these limitations and difficulties in tropical fisheries, it is urgent to start on the application of management that is strongly precautionary and that can succeed in data-free or data-poor situations (Caddy and Mahon, 1995; Die and Caddy, 1997; Sainsbury, 1998; Caddy, 2002). It is particularly true that monitoring and research should be cost effective in developing countries. Putting this in simplified terms, a robust holistic approach would be more suitable rather than a complex reductionist approach. The developments in the field of quantitative ecosystem indicators for the formulation of new management rationality appear to be promising. Research in developing countries can make important contributions in this pioneering development, including experiences in the implementation of EAF management strategies.
1.4 The Cape Verde Archipelago
Ten major islands and various small islets, situated about 650 km west off the coast of Senegal, comprise the Cape Verde Archipelago. The total land area is 4033 km2, consisting of
a northern (Barlavento: windward) group of islands and a southern group (Sotavento: leeward) (Figure 1.1). The islands are of volcanic origin, rising from a depth of at least 3 000 metres and the continental shelves, generally narrow and irregular, are limited to a total area of 5 394 km2 (Bravo de Laguna, 1985). The eastern islands Sal, Boavista, and Maio, form one
system with a more extensive continental shelf compared to the other islands. On the other hand, the EEZ of Cape Verde covers an extensive area of 789 400 km2 (Froese and Pauly,
2000), much of which is exploited by foreign fishing fleets only. The climate of Cape Verde is characterised by warm, relatively even temperatures (22º - 27ºC) and very low and variable values of precipitation (about 400 mm per year).
Cape Verde became independent from Portugal in 1975 and has achieved a strong development performance record in areas such as health, education, economic growth and the establishment of a well-functioning democracy. Per capita GDP was estimated at US$1 260 in 2002 (population 440 000), one of the highest in Africa (www.worldbank.org). In 2000, agriculture and fisheries accounted for 10.9 percent of GDP, but these activities involved 53 percent of the active population (FAO/WFP, 2002). Fisheries accounted for 7 percent of export earnings and 1 percent of GDP. Agriculture is hampered by arid climatic conditions
and erratic rainfall with production rarely covering more than 15 percent of the country's needs. 17ºN 22.5ºW 15ºN 22ºW BRAVAFOGO S. ANTÃO S. NICOLAU S. VICENTE SAL SANTIAGO MAIO BOAVISTA Cape Verde Azores Canaries Madeira
Africa
Figure 1.1 Map of the Cape Verde Archipelago including bathymetric lines corresponding to depths of 200, 1000, and 3000 metres.
Biogeography
The review by van der Land (1993) gives a general overview of the marine biota of the Cape Verde Islands, which provided most of the characteristics given in the following. The Archipelago is situated in the tropics and is rather isolated, far from the African mainland and separated by great depths. Moreover, marine habitats around the Cape Verde Islands are generally different from those along the West African coast, which are highly productive upwelling areas. These factors hamper the immigration of many organisms. On the other hand the Canary Current and the equatorial currents (North Equatorial Counter Current – NECC / North Equatorial Current – NEC) are expected to play an important role in immigration and colonisation. However, these distinct water masses result in occasionally adverse conditions (for either tropical or subtropical/temperate species), thus hampering the development of rich tropical biota.
There is some disagreement on the origins and age of Macaronesian2 islands, but the shallow
water fauna of the Cape Verde Islands is considered to be of relatively young age (less than 1 million years). Every island is considered to have risen independently from the ocean floor. In the case of Cape Verde, the eastern islands Sal and Boavista are older and much of the
2 Macaronesia: biogeographical province or region commonly accepted in ecology comprising Azores, Cape Verde, Canaries, and Madeira Islands.
Introduction
8
volcanic topography has been eroded away by wind and time, resulting in more sandy sediments. Depending on what organisms are being considered, Cape Verde may be considered a biodiversity “hotspot” with a high level of endemism (e.g. Merino et al., 2002; Roberts et al., 2002).
Shelf conditions are characterised by predominantly sandy bottoms with rocky outcrops of volcanic rock, but there are also regions with carbonate rocky bottom sometimes shaped like reefs. In some places the bottom is more or less densely covered with calcareous nodules. The extensive shelf regions around Boavista and between Boavista and Maio would present ideal trawling grounds were it not for these outcrops of sharp rocks and nodules that fill up the trawls in minutes.
No true coral reefs exist along the West African coast or in the archipelagos of the Gulf of Guinea and Cape Verde, but there are a number of sites with rich coral communities (Longhurst and Pauly, 1986). In Cape Verde, “Bahia das Gatas” in the S. Vicente Island is one such example of a shallow protected lagoon with an abundant coral growth, but this is actually one of few exceptions to the rule. The exposure to strong northeasterly winds and associated turbulence as well as oceanic swells appear to restrict the growth of coral as well as seagrasses. Instead, calcareous algae cover large areas from the littoral zone down to great depth. Demersal fish fauna is remarkably similar to other tropical islands with coral reefs (van der Land, 1993).
The biogeographical unit Macaronesia is widely accepted in ecology, characterised by its relic laurisilva vegetation (Lloris et al., 1991). There is some disagreement on the status of region or province whether it concerns botany or zoology, respectively. However, from the ichthyological point of view the term Macaronesia does not constitute a biogeographical unit, but rather a segment or faunistic transition zone where organisms of diverse source meet (amphiatlantic, cosmopolitan, circumglobal), having a clear component of durable species of northern origin (Atlanto-Mediterranean) and others of meridional origin (Equato-Guinean) (Lloris et al., 1991). In relation to Cape Verde, this area is considered a “branch” of the Equato-Guinean province with some connection to the Madeira District (the Canaries and Madeira Islands primarily) (Lloris et al., 1991). As referred above, this is in complete agreement with the expected influence of the Canary Current and equatorial currents (both NEC and NECC) in immigration and colonisation.
The North Atlantic Tropical Gyral Province
Longhurst (1998) pointed out the inadequacies of classical biogeography of the marine environment, because of the inherent difficulties and conflicting viewpoints depending on the approach used. The preceding section is an example of the difficulty in reaching consensus and achieving operational concepts in classical biogeography. The availability of remote sensing data was a major factor in reactivating the search for a satisfactory way of
defining ecological biogeochemical provinces (BGCPs), which is the approach used by Longhurst (1998).
Using this approach, the Cape Verde Islands are classified as part of the North Atlantic Tropical Gyral Province (NATR), which is a region with a consistently low and uniform surface chlorophyll field with a seasonal cycle of small magnitude. This region includes the continuation of the offshore Canary Current south of the Canaries and the flow into the North Equatorial Current (NEC). Only in the Canary Basin do we find patches of enhanced chlorophyll values, caused by the island effect downstream of the individual Canary Islands and in a few detached eddies and jets of upwelled water from the inshore Canary Current. There are indications that these island effects exist also in Cape Verde, but further studies are necessary (Stroemme et al., 1982; Almada, 1993, 1994).
Where the Canary Current detaches from the coast, the convergence zone between it and poleward flow from the south is characterised by the persistent giant filament often observed seawards from Cape Blanc at about 21º (Mauritania). This giant filament off Mauritania, reaching as much as 450 km offshore, may appear as a persistent chlorophyll feature or it may be seen principally in the temperature field. The influence of this giant filament is seen to reach the Cape Verde Islands, possibly leading to an import of nutrients and chlorophyll production. Nevertheless, the primary production is relatively low with a mean daily estimate of 675 mgC m-2 day-1, based on remote sensing data (www.seaaroundus.org).
Almada (1994) gives a good characterisation of oceanographic conditions in Cape Verde, which vary seasonally as a result of the displacement of the Azores and Santa Helena anticyclones. From December to June, the Azores anticyclone diminishes in strength and shifts to a more southerly position and the St. Helena anticyclone increases in strength. Under these conditions, the northerly winds intensify and the whole Cape Verde Archipelago is under stronger influence from the Canary Current. These waters are generally colder (≤ 23° C), transporting nutrients from the upwelling areas in northern Africa and creating more favourable conditions for primary production around the islands most affected by this north-eastern current (Barlavento). From July to November, the St. Helena anticyclone diminishes in strength and the Azores anticyclone intensifies and shifts position to a more northerly position (about 5º). As a result of these seasonal changes only the northern islands remain under the influence of the Canary Current (but somewhat weaker). The southern islands (Sotavento) come under the influence of the North Equatorial Current (NEC) and North Equatorial Counter Current (NECC), causing warmer waters to reach these southern islands (24° - 27°C). These warmer waters create ideal conditions for pelagic fish such as tuna, skipjack tuna in particular, coinciding with the season for the baitboat fishery. Thus, during the second half of the year the Archipelago may be divided in a northern and southern area of distinct oceanographic characteristics.
Introduction
10
1.5 Objectives and Relevance
Marine life has often been studied in Cape Verde since the visit by Darwin onboard the vessel H.M.S. Beagle. Most of the studies have been undertaken from shore or on board vessels during their typically short visits. The position of the islands on the transatlantic route, as the ships took advantage of the trade winds, benefited Cape Verde on many occasions. In recent decades, this changed somewhat as several extensive surveys have been undertaken specifically to explore fisheries resources. An introduction will be given on the existing fisheries information in the following chapter, but this is to indicate that there are numerous studies and characterisations. Thus, groups of organisms such as corals, molluscs, algae, and fish are reasonably well known (Franca and Vasconcelos, 1962; van der Land, 1993; Reiner, 1996; Froese and Pauly, 2000). Phytoplankton and zooplankton communities have also been studied on several occasions (Paiva, 1963, 1971; Ribeiro, 1964; Marques, 1974; Neto and Paiva, 1981; Marques et al., 1997). However, it has generally been difficult to identify and locate many of these studies as they have often been published as “grey” literature and are dispersed worldwide, depending on the institution that carried out the study. Emphasis was placed on fisheries related sources and references, which were more easily accessible. In this respect, the compilation of studies by Carvalho et al. (1999) is an excellent introduction to the current state of knowledge in Cape Verde.
A considerable part of this study consisted in compiling existing information on the coastal ecosystem in Cape Verde in order to apply an ecosystem approach to fisheries assessment. The purpose was to take advantage of existing data and carry out analysis using alternative tools and methods. More importantly, the present study includes the first attempts to undertake ecosystem modelling and the application of various ecosystem indicators (e.g. size spectra, biomass, etc.) to determine their usefulness for management in tropical areas such as Cape Verde. Assessment of small pelagic (bulk biomass) was also undertaken with conventional production modelling in order to complement the results of ecosystem modelling.
Cape Verde is a tropical scenario with the usual problems related to limited data and inconsistent, irregular sampling procedures and intensity. Hence, a pragmatic approach was adopted of using various methods comparatively, contributing to existing knowledge in Cape Verde and tropical areas in general. Also important was the identification of major gaps in our knowledge and priorities for future fisheries research. Emphasis was placed on studying ecosystem dynamics, including possible changes that have occurred since 1964, the year of the first quantitative trawl survey, and the possible effects of fishing. Thus, the null working hypothesis is that there has been no change over recent decades. If there has been change, then we attempt to answer the following questions:
a) Is the change observed due to fishing or environmental effects or possibly a combination of both?
b) Has there been a change (decrease or increase) in biomass for specific species or groups?
c) What have been the consequences of these changes in terms of trophic interactions? d) What is the current level of fishing pressure on the ecosystem and the different
fishery resources and what are the implications for potential harvest?
These are essential questions in order to improve on the present understanding of the Cape Verde coastal ecosystem, its form and functioning, with the prime objective of contributing to the sustainable management of its resources, bearing in mind the crucial importance that fisheries has in an island country such as Cape Verde.
Chapter 2. Fisheries and Survey Data
2.1 Introduction
Fishing activities in Cape Verde probably started together with its discovery and settlement by African slaves in the 15th Century. Historical accounts of frequent attacks by English,
French, and Dutch pirates were occasions for slaves to run away to the remote interior regions of Santiago Island where communities of free Africans were formed as early as the mid 16th Century (Almeida, 1997). These people became known as “badius” from the
Portuguese word for vagabond or runaway. They survived on subsistence agriculture, which is possible on Santiago Island, probably supplemented with seasonal fishing activities. On a larger scale, the American whaling industry began to recruit Cape Verdeans as early as the 18th Century, starting an all-male pattern of immigration to America. Before 1750, many
crewmen aboard Nantucket whaling ships were Cape Verdeans and during the period from 1825 to 1875, an average of 100 American whaling ships called at Cape Verde each year (Almeida, 1997). Many of the best harpooners, steersmen, and all-round whalemen had for long been Portuguese-speaking Africans (Almeida, 2004).
At the local level, the first tuna fishing and canning company was established in 1927 and since then, several small companies were established in various islands, producing canned tuna, lobster and dried fish for domestic and export markets (Massuti, 1965-a). The method used for catching tuna was fishing with live bait using pole and line from relatively small and ill-equipped vessels. In 1963, Castro and Bastos (1967) undertook a mission to Cape Verde and mention that several French vessels exploited the abundant lobster resources using traps. They expressed concern about the fact that many of the French vessels were exploiting these resources illegally as only 3 vessels were authorised to do so. Vieira (1985) refers to the exploitation of coral over the period from 1850 to 1900, which was initiated by the Spanish and continued by the Italians. Apparently, this exploitation was intense and quickly became unprofitable due to the limited resources and unsustainable fishing methods (van der Land, 1993).
In relation to artisanal fisheries, an estimated 1 443 fishermen and 345 boats were active in the beginning of the 1960s (Massuti, 1965-a). The methods employed were primitive, consisting in handline fishing from small wooden boats powered by oars and sails, with few having motors. However, the interest in this sector of the fisheries and the livelihood of the people involved was limited. Instead, the primary goal was to develop industrial fisheries and overcome the existing limitations in relation to lobster and tuna fisheries, in particular (Frade, 1954; Postel, 1954; Massuti, 1965a; Castros and Bastos, 1967). The situation changed in
the early 1980s in the context of a FAO/UNDP technical assistance project, which gave priority to artisanal fisheries (Hanek et al., 1984).
Oceanographic studies concerning Cape Verde date back to historical times. For example, the Cape Verde Archipelago has been the target or on the route of numerous international surveys. These visits started with the famous ocean expeditions of the 19th Century,
including the H.M.S.3 Beagle with Charles Darwin as the expedition naturalist (1832), the
United States Expedition (1838), the English vessel H.M.S. Herald (1852), the English vessel H.M.S. Challenger (1873), the French vessel Talisman (1883), Yacht Princesse Alice of Monaco (1901), and the French vessel President Théodore Tissier (1936) (Reiner, 1996). Generally, the objective was to gain a better understanding of the oceans and the living and non-living resources therein. More recently, more emphasis has been placed on the study of fishing possibilities in Cape Verde, specifically.
In the following, an introduction is given on the fishery resources in Cape Verdean waters, making use of the available information from surveys and fisheries statistics.
2.2 Materials and Methods
Fisheries data
Fisheries statistics are available starting in 1981 with the implementation of a national statistical collection system for fisheries (Shimura, 1980, 1984). The FAO played a key role in establishing this system as well as providing technical assistance. One of the first major tasks was a nation-wide census survey covering fishermen, boats, gears, catches, and effort as well as a variety of socio-economical factors (Hanek et al., 1984).
The methodology used for subsequent estimation of catch and effort has been regular census surveys (not as complete as the first one) and random stratified sampling for artisanal catch and effort estimates, considering gear, landing site, island, and month. This is the classical approach of estimating mean catch by gear and extrapolating to total catch by landing sites using effort information (Stamatopoulos, 2002), adopted to the conditions in Cape Verde, which has been implemented by the FAO in numerous countries. Sampling coverage has improved progressively over time in an attempt to cover both the larger and smaller landing sites in each island (Hanek et al., 1984; Tavares, 1989, 1994; Monteiro, 1999-a; Bellemans and Monteiro, 2000). It is important to point out that not all islands were sampled in the beginning. In the case of industrial or semi-industrial fisheries, the method of obtaining statistics has been by full enumeration, where information on catch and effort has been compiled for every fishing trip.
3 Her Majesty’s Ship
Fisheries and Survey Data
14
The responsibility for the collection, processing, and dissemination of fisheries statistics was given to the “Instituto Nacional de Investigação das Pesca,” created in 1986, which was substituted by the “Instituto Nacional de Desenvolvimento das Pescas (INDP)” in 1992. For previous statistics on fisheries catches, Watanabe (1981) made a compilation for the period from 1956 to 1979 based on various sources.
Table 2.1. List of surveys undertaken in Cape Verde waters, indicating the survey objective and gear used as well as the main reference.
Research
Vessel Year Objective Method Reference
Gérard Trèca 1952 Exploratory survey:
tuna Trolling Postel, 1954
Baldaque da Silva 1957 1958 1959 Exploratory survey: fishery resources
Pole and line, handlines, nets, lobster traps
Costa, 1962; Franca et al., 1962; Soares and Vasconcelos, 1962
Walter Herwig 1964 Exploratory survey: fishery resources
Pelagic and bottom
trawls Massuti, 1965-b
Ernst Haeckel 1976 Exploratory survey:
demersal fish Bottom trawl Danke and Koch, 1987 Dr. Fridtjof
Nansen 1981
Exploratory survey: fishery resources
Acoustics, pelagic
and bottom trawls Stroemme et al., 1982 Playa de
Tamaris 1982
Exploratory survey:
large pelagics Longline Torres, 1982
Fengur 1984 1985 Demersal fish survey Bottom trawl and handline
Magnússon and Magnússon, 1985, 1987-a, 1987-b Fengur 1988 Demersal fish survey Bottom trawl Palsson, 1989
Islândia 1994 Demersal fish survey Bottom trawl Thorsteinsson et al., 1994
Islândia 1994 1995 1996 1997
Commercial fishing:
demersal fish Bottom trawl INDP
Islândia 1995 1996 1997
Exploratory survey:
small-scale resources Handline
Oddson and Monteiro, 1995; 1996; 1997
Islândia 1997 Exploratory survey:
tuna Longline Giani et al., 1999
Capricórnio 1997 Acoustic survey: small
pelagics Acoustics Marques et al., 1997 Arquipélago 2000 Deep-water resources Deep longline Menezes et al., 2001
Survey data
During the great oceanic expeditions of the 19th Century and early 20th Century, Cape Verde
was visited on a number of occasions. As a result of these explorations, descriptions of the findings were made available, but the surveys that took place after 1950 started to explore fishing possibilities in the Cape Verde Archipelago as the main objective. A list of these
surveys is given in Table 2.1, but this should not be regarded as complete as various international oceanographic surveys were not included such as the Capricorne and CANCAP surveys (van der Land, 1987; Almada, 1994). Instead, emphasis is placed on surveys that consider fishery resources.
Data standardisation
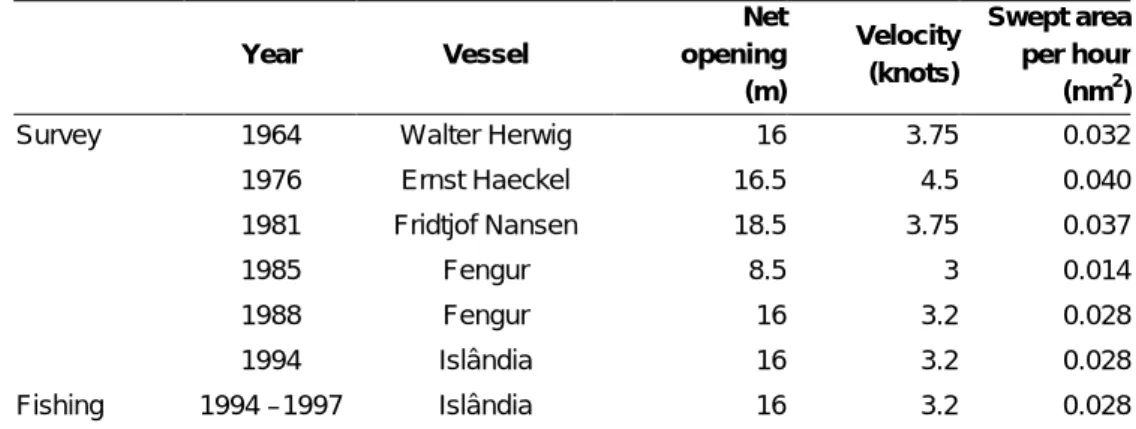
Trawl survey catches were standardised (kg/nm2) using the swept-area method taking into consideration haul duration, average trawling speed, and a fixed value for the horizontal net opening (Table 2.2). This standardisation was not possible on a haul-by-haul basis, as data on speed was often lacking and the net opening was not measured.
Table 2.2. Gear characteristics used in the standardisation of survey catches.
Year Vessel Net opening (m) Velocity (knots) Swept area per hour (nm2)
Survey 1964 Walter Herwig 16 3.75 0.032 1976 Ernst Haeckel 16.5 4.5 0.040 1981 Fridtjof Nansen 18.5 3.75 0.037 1985 Fengur 8.5 3 0.014 1988 Fengur 16 3.2 0.028 1994 Islândia 16 3.2 0.028 Fishing 1994 –1997 Islândia 16 3.2 0.028
2.3 Results and Discussion
Fisheries data
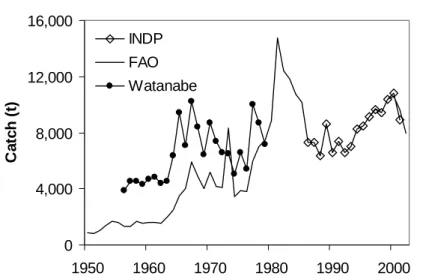
The evolution of total catches in Cape Verde show an increasing trend over the period from 1950 to the present, but it is difficult to assess how strong this increase has been (Figure 2.1). For the period before 1980, the estimates from Watanabe (1981) appear to be more reliable, compared to the FAO estimates, as these were based on a compilation from various sources. FAO total catch estimates for the period from 1981 to 1985 were relatively high and were based on the results of the project that was implementing a statistical collection system (Hanek et al., 1984). These high catch estimates appear to have been the result of extrapolation errors for the catches of S. Antão and S. Vicente Islands between 1981 and 1983, in particular (Carlos Monteiro4, pers. comm.). From 1986 onwards, the INDP estimates are
considered reliable, providing the FAO with the same estimates.
4 Head of the Statistics Department, INDP
Fisheries and Survey Data
16
0 4,000 8,000 12,000 16,000 1950 1960 1970 1980 1990 2000 Ca tc h ( t) INDP FAO WatanabeFigure 2.1. Total catch estimates in Cape Verde based on different sources (see text for explanation).
The total catch estimates for the period from 1981 to 1985 were revised in an attempt to correct them. This was important as the first extensive demersal surveys were undertaken in this period, making it essential to have a reliable source of fisheries data for the same period. Estimated catch rates in the artisanal fishery show that these were much higher in S. Antão by a factor of two to three in relation to the other islands (Hanek et al., 1984) (Table 2.3). Tavares (1989) showed that total catch estimates were sensitive to extrapolation on the basis of boats, ports, or island, which shows that sampling coverage was not adequate for this time period. Various sources were consulted (Hanek et al., 1984; INDP, 1986; Tavares, 1989; Medina and Tavares, 1992; Carvalho, 1994), but as the raw data were not available, a pragmatic and simple approach was used to correct the series. The overall average catch rate for the period 1981 to 1984 was 7.2 tonnes per boat per year and this was used to adjust the catches in S. Antão in 1981, 1982, and 1983 as well as the catches in S. Vicente in 1983, based on the number of boats fishing. Figure 2.2 shows that this approach had a strong impact on the total catch estimates between 1981 and 1983, but these are still relatively high considering that fisheries were under-developed at the time.
Based on the revised time series, catches have varied from about 7 000 to 10 000 tonnes per year over the last two decades. Artisanal catches account for a substantial proportion of the total catches (≈ 62%), but this has varied over time (Figure 2.3). The increasing trend for the period 1986 to 2000 was initially the result of increasing industrial catches, but the importance of artisanal catches has increased in recent years.
Table 2.3. Estimated catch rates in the artisanal fishery given for each island (tonnes per boat per year). Values given in parenthesis were considered erroneous and adjusted using an overall average of 7.2 tonnes per boat per year. Island 1981 1982 1983 1984 S. Antão (16.9) (12.4) (12.9) 7.6 S. Vicente 6.9 5.8 (14.4) 7.4 S. Nicolau 7.0 6.4 9.4 6.7 Sal 7.1 6.8 7.4 6.2 Boavista 6.4 3.1 3.1 6.9 Maio 7.1 9.5 16.4 6.7 Santiago 3.9 2.7 4.8 4.3 Fogo 1.4 2.5 7.2 5.8 Brava 7.1 6.7 7.6 5.9 0 4,000 8,000 12,000 16,000 1981 1986 1991 1996 2001 C a tc h (t) FAO Revised INDP
Figure 2.2. Revised total catches for the period 1981 to 2001.
0 4,000 8,000 12,000 1981 1986 1991 1996 2001 C a tc h (t ) Artisanal Industrial Total
Fisheries and Survey Data
18
Catch per unit of effort (CPUE) has been relatively stable in the artisanal fisheries, but this was not the case in the industrial fisheries (Figure 2.4). It is important to note that effort is measured differently for these two categories. In the artisanal fisheries effort is measured as fishing trips that are usually, but not always, equivalent to fishing days. In the industrial fisheries effort is measured in fishing days as trips have a longer duration. There was a clear decrease in industrial CPUE at the same time as effort was increasing (Figure 2.5). Also, the decrease in catches in 2001 (Figure 2.2 & 2.3) was the result of less effort in both the artisanal and industrial fisheries (Figure 2.5).
0 400 800 1200 1600 2000 1986 1989 1992 1995 1998 2001 CP UE I N D (k g pe r da y ) 0 10 20 30 40 50 CP UE A R T (k g pe r t rip) Industrial Artisanal
Figure 2.4. Artisanal (Art) and industrial (Ind) catch per unit of effort (CPUE). 0 40 80 120 160 200 1981 1985 1989 1993 1997 2001 Tr ip s 0 2 4 6 8 Da y s Artisanal Industrial
Figure 2.5. Artisanal and industrial effort (in thousands). In the artisanal fisheries effort is measured as fishing trips, while in the industrial fisheries it is measured in fishing days.
Catches are dominated by pelagic and/or migratory species such as tuna and various small pelagic species, accounting for around 80 percent. Important large pelagic species are yellowfin tuna, Thunnus albacares, and skipjack tuna, Katsuwonus pelamis, as well as wahoo,
Acanthocybium solandri. Small pelagics are dominated by Decapterus macarellus, Selar crumenophthalmus, and Spicara melanurus in order of decreasing importance, although catches
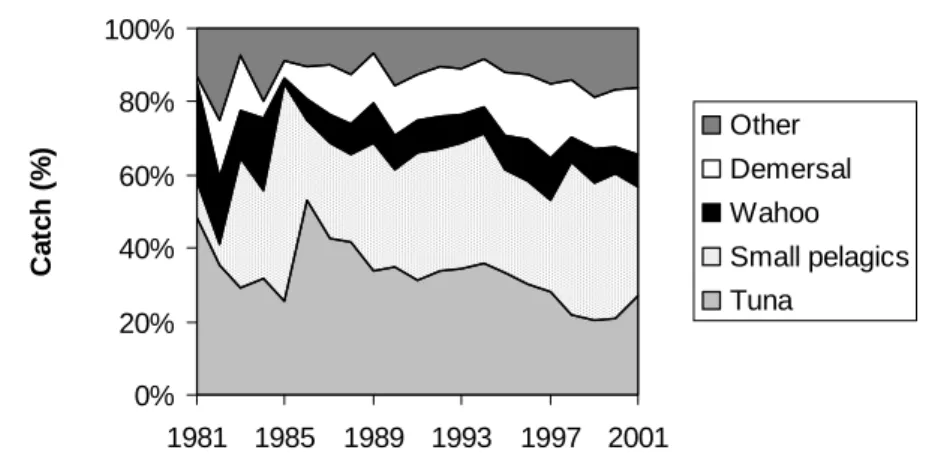
of the latter have increased in recent years (Appendix A). Relative species composition has been more or less stable in the artisanal fisheries (Figure 2.6). There is some doubt about the quality of the species composition data in the beginning of the period, but there appears to be a tendency for an increasing importance of demersal species and a decreasing importance of tuna. 0% 20% 40% 60% 80% 100% 1981 1985 1989 1993 1997 2001 Ca tc h (% ) Other Demersal Wahoo Small pelagics Tuna
Figure 2.6. Composition of artisanal catches by species groups.
On the other hand, the species composition of industrial catches has changed drastically over the last two decades (Figure 2.7). Small pelagics, mostly Decapterus macarellus (or mackerel scad), have substituted tuna as the most important species group in the catches. This dramatic change was driven by a shift in target away from tuna in the industrial fishery. Two large Japanese freezer vessels started buying mackerel scad in the early 1990s to be used as bait elsewhere by the Japanese fleet (Almada, 1997). Mackerel scad has traditionally been fished for local consumption and is used as preferred bait in the tuna pole and line fishery. But the good prices offered by the Japanese and the introduction of small semi-industrial purse seiners (≈ 11m) in the same period (Bouwsma, 2003-b) made mackerel scad more attractive. This Japanese market disappeared however in the late 90s, which resulted in the increasing importance of tuna in recent years. However, the situation did not revert back to a reliance on tuna as market conditions continue to be difficult.
Fisheries and Survey Data
20
0% 20% 40% 60% 80% 100% 1981 1985 1989 1993 1997 2001 Ca tc h (% ) Other Demersal Wahoo Small pelagics TunaFigure 2.7. Industrial catches by species groups.
Another observed change in the industrial fisheries was that catches of “other” species have increased steadily over the last decade. These consisted mostly of small tuna such as Auxis
thazard and Euthynnus alletteratus, which are fished with purse seine, the same gear used for
scads.
Since the first national census survey was carried out in the period 1981 to 1983 (Hanek et al., 1984), the number of artisanal fishers has increased moderately from about 3 300 to 4 280 in 1999. The number of boats involved in the artisanal fisheries has varied between 1 200 and 1 400, which is consistent with the moderate increase in terms of effort (Figure 2.5). At the same time, there has been a steadily increasing motorisation of artisanal boats, which has most probably increased the efficiency of these small wooden boats, ranging from 4 to 6 metres in length (Figure 2.8).
0 20 40 60 80 1981 1985 1989 1993 1997 2001 B o at s w it h M o to rs (% )
Figure 2.8. Motorisation in the artisanal fisheries.
Previous sections have referred to industrial fisheries, but this can be misleading. Vessels vary in length from 7 to 22 metres and only 60 percent of this fleet can be considered active and in operation. Out of a total of around 60 vessels, there are 8 larger vessels of around 22