Effect of Different Modelling Assumptions on the
Seismic Response of RC Structures
R. Sousa
ROSE Programme, UME School, IUSS Pavia, Italy T. Eroğlu
Earthquake Engineering Research Center, Department of Civil Engineering, Middle East Technical University, Ankara, Turkey
D. Kazantzidou, M. Kohrangi, L. Sousa & R. Nascimbene
European Centre for Training and Research in Earthquake Engineering (EUCENTRE), Pavia, Italy
R. Pinho
Civil Engineering and Architecture Department, University of Pavia, Italy
SUMMARY:
The introduction of new regulations for seismic assessment of structures established stricter performance requirements for existing buildings. In order to account for the poor seismic behaviour of such buildings, recent seismic codes, namely Eurocode 8 (EC8), introduce a number of prescriptions regarding issues such as analysis type, load distribution, accidental eccentricity, etc. At the same time, these codes give room for engineering judgment to be used with reference to the definition of structural and non-structural elements such as slabs or infill walls, and obviously leave the modelling assumptions, such as Finite Elements typology, meshing, mass modelling, etc. to the analyst decision. As such, four existing RC buildings, representative of traditional Mediterranean construction, considering different modelling assumptions, were subjected to an extensive number of nonlinear static analyses. The interpretation of possible deviations in the results will hopefully provide indications on the relative importance of each modelling parameter or decision.
Keywords: Nonlinear static analysis; Modelling issues; Irregular RC structures
1. INTRODUCTION
In the academic/research field, structural modelling programs are generally state-of-the-art, with high-level algorithms that can address the most complex structural representation. However, it is generally required an equally high level of knowledge of the problem in order to guarantee its adequate application. The definition/assembly of such structural models, required to perform nonlinear static/dynamic analyses to assess existing buildings, features a number of uncertainties that are not explicitly covered in design codes or guidance documents. These questions are thus left to the judgement of practitioners, whose experience in such type of nonlinear modelling may vary significantly.
Independently of the software capabilities available, numerical analyses are only representative if the computational model, independently of the analysis to be performed, is able to truthfully represent the real structure. It has been recognised by Sousa et al. (2011) and Kunnath and Erduran (2008) that the seismic response is greatly dependent on the computational tools, the inherent assumptions and approximations introduced in the modelling process. It is thus fundamental to assess the relative importance of implementing different, yet common, modelling choices and investigate the computed response sensitivity to the corresponding modelling assumption. For this purpose, four existing irregular RC buildings were numerically modelled and subjected to a large set of nonlinear static analyses. The results obtained with different solutions are firstly appraised in global components, namely in terms of base shear and lateral top displacements. In addition, the elements response
measured in terms of shear forces and chord rotations are evaluated for three different limit states according to Eurocode 8 (CEN, 2005b) prescriptions.
2. PARAMETRIC STUDY
The selection of the appropriate modelling choices is fundamental to acquire a realistic and reliable estimation of nonlinear response of buildings. The present work intends to clarify some aspects regarding some modelling assumptions, which have been proved to be crucial in nonlinear seismic assessment of existing RC structures, namely: rigid/deformable slab, infill panels, accidental eccentricity, mass characterization (lumped/distributed) and element meshing. A brief description of the strategies subjected to analysis is presented hereafter. It must be pointed out, however, that there are many other structural issues, such as soil-structure interaction, beam-column joint behaviour, bar slippage, etc., that require also additional clarification. However, due to their complexity and relative importance in practical applications, they were not included in the current parametric study.
2.1. Slab modelling
The in-plan stiffness of the existing buildings slabs differs significantly depending on the design prescriptions at the time of construction. Thus, modern slabs designed to withstand lateral loads generally have large in-plan stiffness whereas old structures built in the early 70s and 80s have slabs designed mainly to support gravity loads and may not exhibit suitable in-plan stiffness. Traditionally, in nonlinear analysis one can define the slab in three different ways: neglecting the in-plan stiffness of the slab (no slab), constraining the rotations and displacements in the slab plan (rigid diaphragm) or by defining equivalent truss elements that approximately represent the actual in-plan stiffness of the slab. The first solution is obviously the easiest to define and fastest to perform. On the other hand, assuming a rigid diaphragm, despite being relatively simple to implement in advanced nonlinear software, may lead to numerically time consuming analysis. As an optimum solution, if one chooses to consider the actual properties of the floor, the solution may lie on the definition of an equivalent X-diagonal truss system that represents the in-plan stiffness of the slab (Mpampatsikos, 2008). In this approach, for fairly square slab panel (Lx ≈ Ly ≈ L), the axial stiffness of the trusses is computed so as to match the membrane stiffness of a given floor “panel”.
The influence the modelling the slabs with different in-plan stiffness has on the seismic behaviour of buildings was examined by three different approaches: absence of slab, slab simulated with equivalent truss system and considering a rigid diaphragm.
2.2. Infill panels
Infill panels, being commonly used in RC frame systems worldwide are generally constructed for partitioning or isolation purposes and consequently are normally treated as non-structural elements, which are not expected to develop significant interaction with the main structural system. This hypothesis usually stands for static loads for which minor deformations are expected. However, unlike most non-structural components, infill panels can develop a strong interaction with the bounding RC frames when subjected to earthquake loads and, therefore, significantly contribute to the lateral stiffness and load resistance of the structure. Moreover, experience from past earthquakes suggests that strong infills, despite non-structural, often provide most of the earthquake resistance and prevent collapse of relatively flexible and weak RC structures (Panagiotakos and Fardis, 1996). Moreover, as demonstrated by Tanganelli et al. (2011) brittle infills and irregularities in plan and elevation of heavy infills were identified as cases that may lead to a deterioration of the overall seismic performance of infilled RC buildings.
In this parametric study, the effect of infill panels considers a model with inelastic infill elements that account for the actual properties of the existing panels. The infill elements were defined according to the macro model developed by Crisafulli (1997) that features a double-strut approach.
2.3. Accidental eccentricity
In order to account for uncertainties in the location of masses and in the spatial variation of the seismic motion, seismic codes such as EC8 (CEN, 2005a) introduce the requirement to apply an “accidental eccentricity”, which imposes an additional torsional effect on the structure, by shifting the centre of mass at each floor from its nominal location in each direction by 5% of the floor-dimension.
Despite the simplicity of calculations associated with the previous procedure, it must be pointed out that, when associated to complex structures, the computations of the additional loads can be lengthy. Thus, the main goal of this process is to investigate the weight that this adverse factor has in the seismic assessment procedure and if is possible to somehow be accounted for in a simpler fashion.
2.4. Mass and beam modelling approach
Numerical simulation of structures can also be affected by some assumptions that do not necessarily represent limitations in the modelling capabilities, but instead approximations that are assumed by the user, mainly due to time limitation constraints. It is quite common and intuitively accepted that structural mass can be modelled as lumped at the beam column joints of the structures, rather than distributed along the elements. This hypothesis is supported by the assumption that the demand imposed by seismic loads is significantly higher than the ones developed due to gravity loads. The employment of distributed mass represents a more accurate approach that enables the correct characterization of both global and local structural behaviour. On the other hand, according to previous studies, concentrating the masses at the structural joints is suitable for nonlinear static analysis since the evaluation of the mode shapes and the global response of the building is consistent with the choice of distributing the lateral pushover forces at the structural joints (Mpampatsikos et al. 2009). Time needed to build-up the model and the definition of simpler and faster models are some of the advantages achieved with this approximation. In addition, supported by the fact that for general beam elements both gravity and seismic load impose higher bending moments at the element ends, the validity and accuracy of a “simplified” beam element, for which the beam-end-section is considered throughout the entire member, is evaluated. The main principle of this solution is to substitute the actual beam properties by other equivalent, which results in a significant reduction of the number of sections as well as the number of elements in the model. Obviously, because in this approach the beams may not present enough reinforcement to resist the positive moments at the mid-span, the use of lumped mass at the beam-column joints is recommended.
To evaluate the effect of concentrating the masses, the mass elements idealized as distributed along the beam elements were lumped in the main nodes (generally at the beam column joints) according to the tributary areas, without changing the total mass of the floors. Finally, within the context of the parametric study, a “simplified beam approach” was tested against the models with the actual beam elements and the deviation in the demands were examined.
2.5. Layout of the study
In order to understand the importance of each individual parameter, 4 existing buildings were modelled varying each model option independently. Each model was subjected to pushover analysis and the performance points were determined for 3 different limit states according to the N2 method (Fajfar and Fischinger, 1988), currently recommended by EC8 (CEN, 2005b). The comparison of the responses are determined based on global parameters such as base shear and lateral top displacements and local quantities typically used in assessment procedures, namely elements shear forces and elements chord rotations. The comparison of the local demands according to different modelling approaches are represented in scatter plots together with elements capacities, not to direct assess the performance of the elements but instead to define a benchmark that allows a sensitive comparison of different responses. Additionally, on the right side of each scatter plot, the relative change in demands are given to better represent the deviation between demands due to different modelling assumptions.
3. BUILDING MODELS 3.1. Buildings description
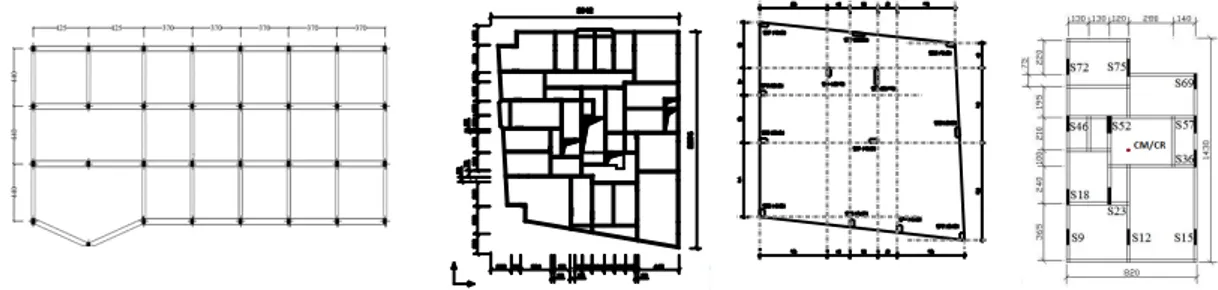
The structures selected to perform this parametric study correspond to existing RC buildings located in Italy and Turkey, and intended to represent the design practice in European and Mediterranean countries, before the introduction of seismic codes. One of the main concerns in the selection was to identify buildings that exhibit structural irregularities both in plan and elevation. Accordingly, the four existing buildings selected exhibit irregular planar disposition of columns, number of storeys, presence of indirect supports (misaligned beams supported on beams) or different relative capacity between beams and columns (strong column-weak beam and vice versa). The material properties correspond to the mean values obtained from in-situ testing and are in line with the average characteristic values observed during a detailed assessment of the structural features of Turkish and Italian RC buildings (Bal et al., 2008; Mpampatsikos, 2008). The plan views of the models used in the current study is presented in Fig. 3.1.
Figure 3.1. Plan view of the 2-, 4-, 5- and 8-storey building (left to right).
3.2. Numerical options
The buildings structural details, as well as material properties, were given by the design drawings and have been, whenever possible, verified by a limited in situ survey. In the current study the buildings were implemented in SeismoStruct (Seismosoft, 2010) and assume distributed inelasticity elements with force-based (FB) formulation. In addition, the elements are discretised so that the total number of integration points (IP) per member was kept constant for all the performed analyses. More specifically, a total of 6 IPs were adopted to model the beams, irrespectively of the assumed discretisation, whereas the columns were modelled with 4 IPs per element. The number of IPs adopted represents a good commitment between the level of accuracy and a computational effort to perform a large number of nonlinear analyses, required for this parametric study.
4. STRUCTURAL RESPONSE
The results obtained for the four different buildings were investigated at both global and local level, namely in terms of capacity curves and elements (beams and columns) shear forces and chord rotations at both ends. Given the extension of the results resulting from the study, in the following sections, only a summary of the most representative plots is presented. Accordingly, despite the results being assessed for three different Limit States, only the ones corresponding to the intermediate - Significant Damage (SD), are shown.
4.1. Slab modelling
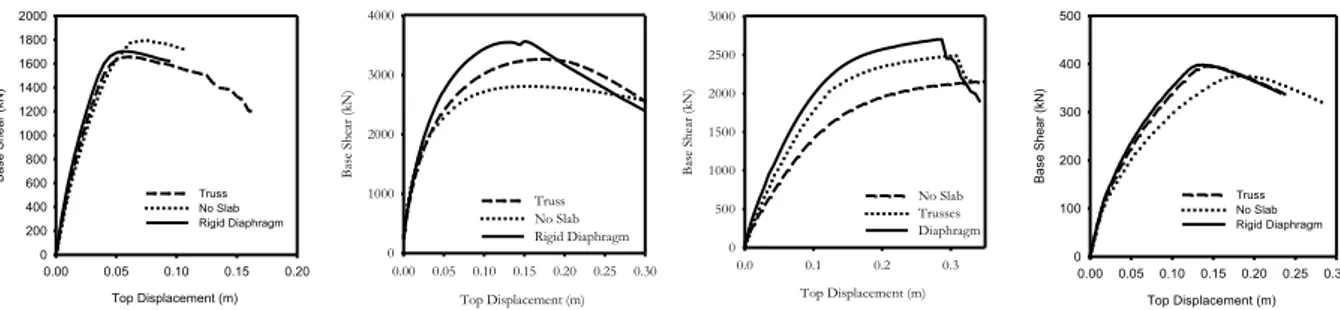
Focused on the global behaviour of buildings modelled with different slab approaches, Fig. 4.1 presents the response of the four analysed buildings in terms of total base shear versus top displacement. !"#$%&'#(%)*&+$'*,-%.',*/#*0*%#$*1* * * * * * * !"#$%&'()*% * !
Figure 4.1. Capacity curves for 2-, 4-, 5- and 8-storey building (left to right) modelled with different slab
approaches, in X direction.
The results demonstrate that the definition of slabs with different in-plan stiffness can considerably change the global building response. Nevertheless, it is also important to recognise that in some cases, the behaviour remains essentially unaffected. The presence of stiffer slab is generally reflected in stiffer responses and higher levels of base shear. By constraining the horizontal displacements, the columns are forced to displace similarly, independent of their relative lateral stiffness. In cases where the vertical elements (columns/walls) are regularly distributed in plan and their relative flexural stiffness does not vary significantly, the buildings, despite modelled with different slab approaches, exhibit similar global behaviour. To better understand this phenomenon, the elements response, measured in terms of shear and chord rotations, is presented in Fig 4.2 and analysed in more detail for the building and directions cases in which the capacity curves deviations are more evident.
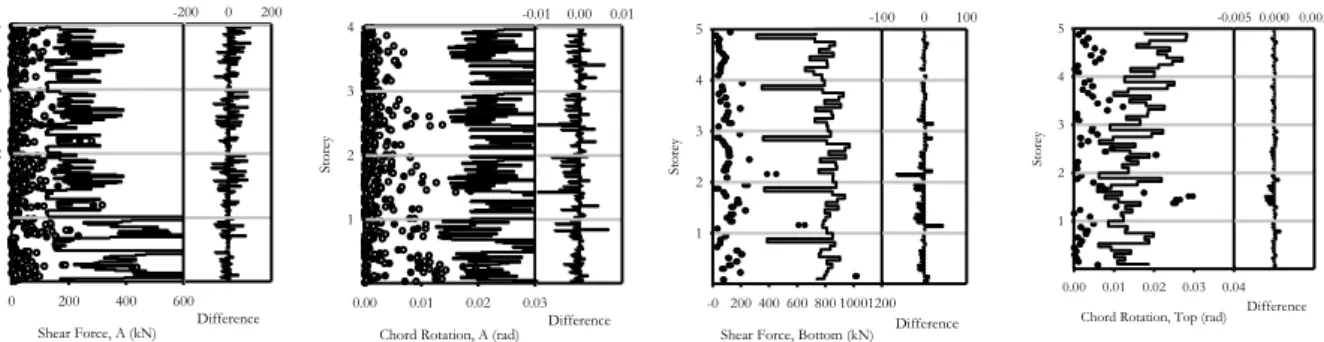
Figure 4.2. Beams and columns shear forces and chord rotations measured for the 4- (first two plots) and 8-(last
two plots) storey building, considering no slab (white) and rigid diaphragm (black).
It is clear, from the observation of the local results, that the selection of different in plan stiffness of the slabs is a critical factor when assessing the seismic behaviour of buildings. It is also important to emphasize that this idea cannot be assumed for the generality of irregular structures. The level of irregularity is usually defined based on the difference between the centre of mass (CM) and centre of rigidity (CR). However, it was observed that, in what rigid diaphragm is concerned, the particular location of the stiffer elements, more than the actual position of the CM and CR, is of major importance. Finally, Fig. 4.2 shows that neither no slab nor rigid diaphragm approach does necessary lead to a conservative solution in terms of elements shear forces and chord rotations.
Although not illustrated in the local demands, the representative slab model with equivalent truss elements exhibits an intermediate condition between no slab and rigid diaphragm approaches where the model assumes approximately the actual slab properties. Thus, its behaviour is restricted by the two extreme cases and can be closer to one of them, depending on the properties of each building.
4.2. Infill panels
The second issue under scrutiny evaluates the performance of buildings modelled under the consideration of the properties of the infill panels, and is indirectly related with the selection of different slab properties previously analysed. In order to simulate the real slab behaviour, the slabs
RB, X, DM, 13, 15, 17 Modal Top Displacement (m) 0.00 0.05 0.10 0.15 0.20 B as e Sh ea r (k N) 0 200 400 600 800 1000 1200 1400 1600 1800 2000 Truss No Slab Rigid Diaphragm Top Displacement (m) 0.00 0.05 0.10 0.15 0.20 0.25 0.30 B as e Sh ear (kN ) 0 1000 2000 3000 4000 Truss No Slab Rigid Diaphragm ! MODAL Top Displacement (m) 0.0 0.1 0.2 0.3 B as e Sh ea r (k N ) 0 500 1000 1500 2000 2500 3000 No Slab Trusses Diaphragm ! Slab - modal -X Top Displacement (m) 0.00 0.05 0.10 0.15 0.20 0.25 0.30 Ba se Sh ea r ( kN) 0 100 200 300 400 500 Truss No Slab Rigid Diaphragm Shear Force, B (kN) 0 200 400 600 St or ey 1 2 3 4 Difference -200 0 200
Chord Rotation, B (rad)
0.00 0.01 0.02 0.03 St or ey 1 2 3 4 Difference -0.01 0.00 0.01 ! Slab-DL-LS-Modal (A), Y Shear, bottom (kN) 0 100 200 300 400 500 600 Sto re y 1 2 3 4 5 6 7 8 No Slab Rigid Diaphr. Shear Capacity Difference -50 0 50 Slab-LS-LS-Modal (A), Y Shear, bottom (kN) 0 100 200 300 400 500 600 Sto re y 1 2 3 4 5 6 7 8 Difference -50 0 50 Slab-NC-LS-Modal (A), Y Shear, bottom (kN) 0 100 200 300 400 500 600 Sto re y 1 2 3 4 5 6 7 8 Difference -50 0 50 ! Slab-DL-LS-Modal (A), Y
Chord Rotation, bottom (rad)
0.000 0.005 0.010 0.015 St or ey 1 2 3 4 5 6 7 8 No Slab Rigid Diaphr. Chord rotation Capacity
Difference -0.002 0.000 0.002
Slab-LS-LS-Modal (A), Y
Chord Rotation, bottom (rad)
0.000 0.005 0.010 0.015 St or ey 1 2 3 4 5 6 7 8 Difference -0.002 0.000 0.002 Sl;ab-NC-LS-Modal (A), Y
Chord Rotation, bottom (rad)
0.000 0.005 0.010 0.015 St or ey 1 2 3 4 5 6 7 8 Difference -0.002 0.000 0.002 ! Slab-DL-LS-Modal (A), Y
Chord Rotation, bottom (rad)
0.000 0.005 0.010 0.015 St or ey 1 2 3 4 5 6 7 8 No Slab Rigid Diaphr. Chord rotation Capacity
Difference -0.002 0.000 0.002
Slab-LS-LS-Modal (A), Y
Chord Rotation, bottom (rad)
0.000 0.005 0.010 0.015 St or ey 1 2 3 4 5 6 7 8 Difference -0.002 0.000 0.002 Sl;ab-NC-LS-Modal (A), Y
Chord Rotation, bottom (rad)
0.000 0.005 0.010 0.015 St or ey 1 2 3 4 5 6 7 8 Difference -0.002 0.000 0.002
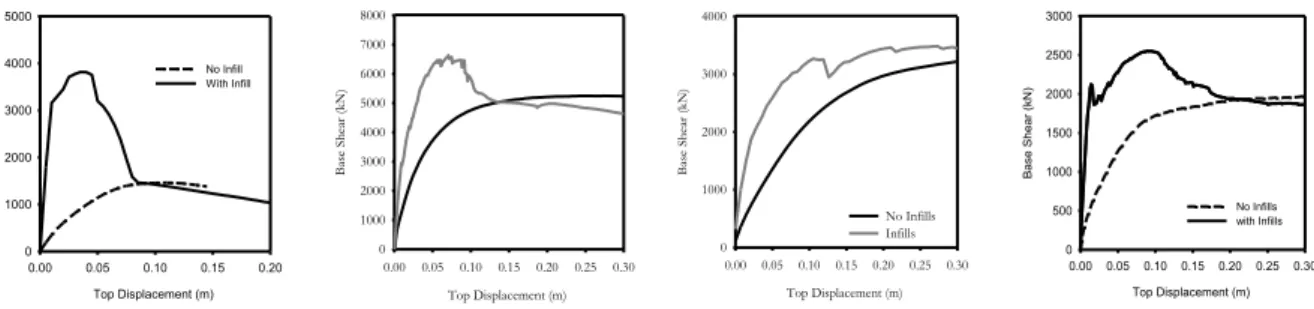
were modelled following the equivalent truss approach. Fig 4.3 illustrates the global response of the different buildings modelled with and without infill panels.
Figure 4.3. Capacity curves for 2-, 4-, 5- and 8-storey building (left to right) modelled with and without infills,
in Y direction.
The first direct consequence of implementing infill panels results in a significant increase of the initial stiffness and the maximum base shear. Given that traditional infill panels are characterized by a brittle behaviour, after a certain structural displacement, the panels strength is abruptly reduced, up to a point after which the total base shear softens to values close to the bare ones. This descending trend results from the successive collapse of the individual panels as its deformations reach the compression and/or shear capacities. The local response observed in the model with infill panels (Fig. 4.4) shows a generalised reduction in terms of shear forces and chord rotations. The results seem to indicate that the assessment of RC buildings without considering the infill properties leads to a conservative results.
Figure 4.4. Beams and columns shear forces and chord rotations measured for the 2- (first two plots) and 5- (last
two plots) storey building, modelled with (white) and without (black) infills. 4.3. Accidental eccentricity
In order to account for the uncertainties associated to the location of the masses, the EC8 prescribes the numerical simulation of the buildings incorporating an accidental eccentricity. Fig. 4.5 compares the capacity curves obtained with conventional load distributions, against the ones modified to reproduce an additional torsional effect.
Figure 4.5. Capacity curves for 2-, 4-, 5- and 8-storey building (left to right) modelled with (grey) and without
(black) the effects of an accidental eccentricity, Y direction.
Infill-Y-TR-16, 52 Top Displacement (m) 0.00 0.05 0.10 0.15 0.20 B a se Sh e a r (k N) 0 1000 2000 3000 4000 5000 No Infill With Infill Top Displacement (m) 0.00 0.05 0.10 0.15 0.20 0.25 0.30 B as e S hea r (k N) 0 1000 2000 3000 4000 5000 6000 7000 8000 !
Modal Distribution - Trusses
Top Displacement (m) 0.00 0.05 0.10 0.15 0.20 0.25 0.30 B as e Sh ea r (k N) 0 1000 2000 3000 4000 No Infills Infills ! diaphragm Top Displacement (m) 0.00 0.05 0.10 0.15 0.20 0.25 0.30 B as e S hear (k N ) 0 500 1000 1500 2000 2500 3000 No Infills with Infills LS-LS-(B), x Shear, B (kN) 0 20 40 60 80 100 Sto rey 1 2 Difference -100 0 100 RB, X, NS, DM, 14, 34 Top Displacement (m) 0.00 0.05 0.10 0.15 0.20 B a se Sh e a r (k N) 0 200 400 600 800 1000 1200 1400 Modal Uniform Top Displacement (m) 0.00 0.05 0.10 0.15 0.20 0.25 0.30 B as e Sh ear (kN ) 0 1000 2000 3000 4000 5000 Uniform Modal !
Modal Distribution (Dist Mass)
Top Displacement (m) 0.00 0.05 0.10 0.15 0.20 0.25 0.30 B as e Sh ea r (k N ) 0 1000 2000 3000
With Acc. Eccentr. (+) With Acc. Eccentr. ( - ) No Acc. Eccentricity
! !
!
Acc. Eccentr. - No Slab - Y
Top Displacement (m) 0.00 0.05 0.10 0.15 0.20 0.25 0.30 B as e S hear (k N ) 0 200 400 600 800 1000 1200 1400 1600 1800 Modal Uniform !
Acc. Eccentr. - No Slab - Y
Top Displacement (m) 0.00 0.05 0.10 0.15 0.20 0.25 0.30 B as e S hear (k N ) 0 200 400 600 800 1000 1200 1400 1600 1800 Modal Uniform LS-LS-(A), TR, y
Chord Rotation, Bot (rad)
0.00 0.01 0.02 0.03 Sto rey 1 2 Difference -0.01 0.00 0.01 !
Shear Force, Bottom (kN) -0 200 400 600 800 10001200 St or ey 1 2 3 4 5 No Infills Infills Difference -300 0 300 !
Chord Rotation, Bottom (rad)
0.00 0.01 0.02 0.03 0.04 Sto re y 1 2 3 4 5 No Infills Infills Difference -0.02 0.00 0.02
The consideration of an additional torsional moment appears to result in minor changes in terms of global capacity for the generality of the cases. This trend seems also to be followed when analysing the elements performance as depicted in Fig 4.6.
Figure 4.6. Beams and columns shear forces and chord rotations measured for the 2- (first two plots) and 8- (last
two plots) storey building, modelled with (white) and without (black) accidental eccentricity.
The shear forces resulting for the 2- and 8-storey buildings indicate a small increase in both beams and columns when the lateral loads account for an accidental eccentricity. Identical results are also observed in terms of chord rotations. Apart from some particular elements, the buildings response incorporating an accidental eccentricity, reveals a minor effect for seismic assessment purposes.
4.4. Mass modelling
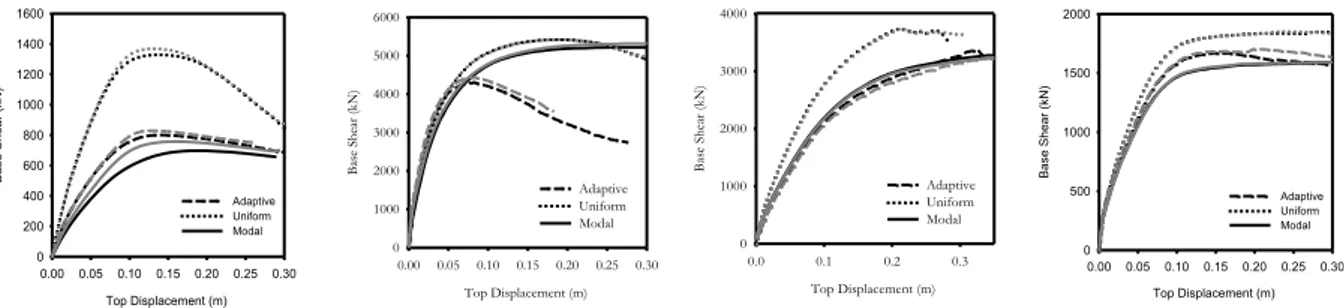
Supported by the global results evaluated with lumped and distributed mass for different load patterns (Fig. 4.7), it seems that the two solutions do not lead to remarkable differences indicating that the mass can be modelled as lumped without jeopardising the overall response accuracy. However, some minor deviations are more evident in the adaptive pushover given its sensitivity to the modal properties and the associated spatial distribution of mass in the building.
Figure 4.7. Capacity curves for 2-, 4-, 5- and 8-storey building (left to right) modelled with lumped (grey) and
distributed (black) mass, in Y direction.
Despite the good correlation observed in global parameters, the shear values obtained for the 4-storey building (Fig 4.8) indicate that lumping the mass in nodal joints significantly change the distribution of shear values in the beams.
MASS-Y-NS-2,14 Top Displacement (m) 0.00 0.05 0.10 0.15 0.20 0.25 0.30 B a se Sh e a r (k N) 0 200 400 600 800 1000 1200 1400 1600 Adaptive Uniform Modal Top Displacement (m) 0.00 0.05 0.10 0.15 0.20 0.25 0.30 B as e Sh ear (kN ) 0 1000 2000 3000 4000 5000 6000 Adaptive Uniform Modal ! Top Displacement (m) 0.0 0.1 0.2 0.3 B as e Sh ea r (k N) 0 1000 2000 3000 4000 Adaptive Uniform Modal ! Mass - Trusses - Y Top Displacement (m) 0.00 0.05 0.10 0.15 0.20 0.25 0.30 Bas e Sh e a r ( kN) 0 500 1000 1500 2000 Adaptive Uniform Modal LS-LS-(B), x Shear, B (kN) 0 20 40 60 80 100 Sto rey 1 2 Difference -100 0 100 ! Ecc+-DL-LS-Modal (A), Y Shear, bottom (kN) 0 100 200 300 400 500 600 Sto re y 1 2 3 4 5 6 7 8
With Acc. Ecc. No Acc. Ecc. Shear Capacity Difference -50 0 50 Ecc+-LS-LS-Modal (A), Y Shear, bottom (kN) 0 100 200 300 400 500 600 Sto re y 1 2 3 4 5 6 7 8 Difference -50 0 50 Ecc+-NC-LS-Modal (A), Y Shear, bottom (kN) 0 100 200 300 400 500 600 Sto re y 1 2 3 4 5 6 7 8 Difference -50 0 50 ! Ecc+-DL-LS-Modal (A), Y Shear, bottom (kN) 0 100 200 300 400 500 600 Sto re y 1 2 3 4 5 6 7 8
With Acc. Ecc. No Acc. Ecc. Shear Capacity Difference -50 0 50 Ecc+-LS-LS-Modal (A), Y Shear, bottom (kN) 0 100 200 300 400 500 600 Sto re y 1 2 3 4 5 6 7 8 Difference -50 0 50 Ecc+-NC-LS-Modal (A), Y Shear, bottom (kN) 0 100 200 300 400 500 600 Sto re y 1 2 3 4 5 6 7 8 Difference -50 0 50 Slab-LS-LS- (B), x
Chord Rotation, B (rad)
0.00 0.01 0.02 0.03 Sto rey 1 2 Difference -0.005 0.000 0.005 ! Eccentr-DL-LS-Modal (A), x
Chord Rotation, bottom (rad)
0.00 0.02 0.04 St or ey 1 2 3 4 5 6 7 8
With Acc. Ecc. No Acc. Ecc. Chord rotation Capacity
Difference
-0.002 0.000 0.002 Eccentr-LS-LS-Modal (A), x
Chord Rotation, bottom (rad)
0.00 0.02 0.04 St or ey 1 2 3 4 5 6 7 8 Difference -0.002 0.000 0.002 Eccentr-NC-LS-Modal (A), x
Chord Rotation, bottom (rad)
0.00 0.02 0.04 St or ey 1 2 3 4 5 6 7 8 Difference -0.002 0.000 0.002 ! Eccentr-DL-LS-Modal (A), x
Chord Rotation, bottom (rad)
0.00 0.02 0.04 St or ey 1 2 3 4 5 6 7 8
With Acc. Ecc. No Acc. Ecc. Chord rotation Capacity
Difference
-0.002 0.000 0.002 Eccentr-LS-LS-Modal (A), x
Chord Rotation, bottom (rad)
0.00 0.02 0.04 St or ey 1 2 3 4 5 6 7 8 Difference -0.002 0.000 0.002 Eccentr-NC-LS-Modal (A), x
Chord Rotation, bottom (rad)
0.00 0.02 0.04 St or ey 1 2 3 4 5 6 7 8 Difference -0.002 0.000 0.002
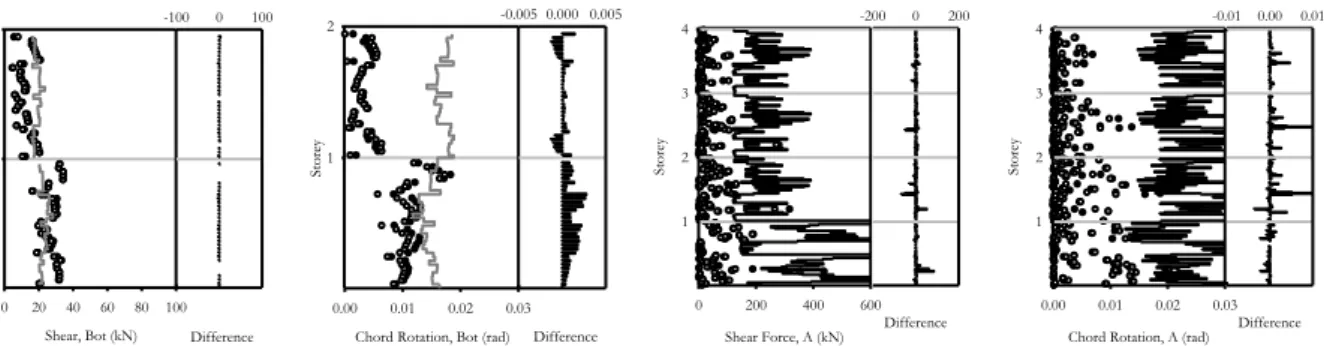
Figure 4.8. Beams and columns shear forces and chord rotations measured for the 4- (first two plots) and 5- (last
two plots) storey building, modelled with lumped (white) and distributed (black) mass.
Supported by the local results, evaluated in term of shear forces and chord rotations, it is possible to verify that the definition of the masses as lumped may lead to particular deviations in comparison with the more realist decision of modelling the masses as distributed along the beams. It is important to note that the definition of the lumped masses values, based on the tributary areas, is not always a straightforward decision, given the complex slab system presented in the irregular buildings under analysis (e.g. beams indirectly supported). Finally, despite the global parameters indicate negligible deviations between the two different approaches, the elements responses, on the contrary, denote a small, yet erroneous, deviation measured for both shear forces and chord rotations when the option of lumping the masses at the main structural joints is adopted.
4.5. Simplified beam approach
Finally, the performance of the buildings is evaluated considering a “simplified” beam approach. It is important to highlight that this solution is applicable only if the masses are modelled as lumped in order to avoid convergence issues, especially in the sections near the mid-span of the beams. Figure 4.9 shows the capacity curves for the different buildings considering both actual and simplified beam approach, when applying three different lateral load distributions.
Figure 4.9. Capacity curves for 2-, 4-, 5- and 8-storey building (left to right) modelled with simplified (grey) and
actual (black) beams, in X direction.
The results presented in the previous figures indicate that this approach does not lead to remarkable differences at the global level for all four buildings. However, some convergence issues were observed, leading to analysis instability. Since the end-section of the elements remains the same and the shear forces are not significantly influenced by the response at the mid sections, it is natural that the results presented in terms of shear values for the 2- and 4-storey building reveal minor changes in both beams and columns (Fig 4.10). Contrarily, the elements chord rotations depend not only in the performance of the section under analysis but also in the behaviour of the adjacent nodes and the internal behaviour of the elements. Consequently, the chord rotations are more sensitive to the internal distribution of forces that are necessarily different given the modification of the properties of the inner section of the beams.
ELEMENT-X-NS-1,7 Top Displacement (m) 0.00 0.05 0.10 0.15 0.20 B a se Sh e a r (k N) 0 500 1000 1500 2000 2500 3000 Adaptive Uniform Modal Top Displacement (m) 0.00 0.05 0.10 0.15 0.20 0.25 0.30 B as e Sh ear (kN ) 0 1000 2000 3000 4000 Adaptive Uniform Modal ! Top Displacement (m) 0.0 0.1 0.2 0.3 B as e Sh ea r (k N) 0 500 1000 1500 2000 2500 3000 Adaptive Uniform Modal 1FB - 3FB ! Element - Trusses - X Top Displacement (m) 0.00 0.05 0.10 0.15 0.20 0.25 0.30 Ba se Sh e a r ( kN) 0 100 200 300 400 500 Adaptive Uniform Modal Shear Force, A (kN) 0 200 400 600 St or ey 1 2 3 4 Difference -200 0 200 !
Shear Force, Bottom (kN) -0 200 400 600 800 10001200 St or ey 1 2 3 4 5 Dist. Mass Conc. Mass Difference -100 0 100
Chord Rotation, A (rad)
0.00 0.01 0.02 0.03 St or ey 1 2 3 4 Difference -0.01 0.00 0.01 !
Chord Rotation, Top (rad)
0.00 0.01 0.02 0.03 0.04 Sto re y 1 2 3 4 5 Dist. Mass Conc. Mass Difference -0.005 0.000 0.005
Figure 4.10. Beams and columns shear forces and chord rotations measured for the 2- (first two plots) and 4-
(last two plots) storey building, modelled with simplified (white) and actual (black) beam elements.
5. CONCLUSIONS
After a deep analysis of the results obtained for the four different buildings assuming different modelling options, a summary of the main conclusions are individually presented for each of the options considered in the numerical models:
• Slab modelling: The results obtained with the three different options show that the buildings response, measured for both global and local parameters, is considerably influenced by the assumed horizontal stiffness and the buildings irregularity. In what concerns the results appraised at the global level, the definition of stiffer slabs tend to increase the initial stiffness as well as the peak base shear, particularly for buildings presenting an irregular distribution of columns in plan. The results presented in this work prove that for stiffer slabs, the beams tend to undergo higher shear forces while the deformations are reduced. Although the beams resulting behaviour seems clear, it is not possible to determine a priori the columns response. In fact, the results indicate that the columns behaviour vary from case to case and is not directly related with the definition of the slab stiffness itself. Instead, the columns behaviour is governed by the variations of beam-column joint equilibrium resulting from the definition of different planar stiffness. Given the variability associated with the elements response when considering different slab properties, the definition of equivalent trusses system, representing the actual properties of the slab, is preferable whenever the slab properties are well known and the buildings geometry allows the definition of approximately square areas. However, because these assumptions are often difficult to be fulfilled in existing structures, the analyst may decide to follow a more pragmatic decision and evaluate the response of the structure for different possible scenarios.
• Infill panels: The results observed in global terms show significant deviations, in particular at the stages where the structure remains mainly elastic. In addition, the elements shear forces and chord rotations measured with infill panels are substantially lower than the ones obtained without infills. Consequently, the results indicate that neglecting the infill properties leads to a (sometimes excessively) conservative estimation of the structures response. Nevertheless, previous studies indicate that the dynamic response of these structures is significantly different from the ones obtained with nonlinear static analysis. This way, it seems fundamental to access the response with dynamic analysis in order to guarantee the consistency of these considerations.
• Accidental eccentricity: The incorporation of accidental torsional effects for seismic assessment of buildings resulted in minor deviations in both global and elements’ responses. Based on the observed results, and given the supplementary calculations necessary to estimate the new load distributions and the time required to perform additional analyses, the prescriptions of Eurocode 8 on this aspect could perhaps be revisited or clarified.
• Mass modelling and simplified beam approach: The response of the models considering the building mass distributed over the structural elements or lumped at the beam columns joints have been subjected to scrutiny in the present study. The dynamic results as well as the global response
Shear Force, A (kN) 0 200 400 600 St or ey 1 2 3 4 Difference -200 0 200
Chord Rotation, A (rad)
0.00 0.01 0.02 0.03 St or ey 1 2 3 4 Difference -0.01 0.00 0.01 LS-LS-(A), y Shear, Bot (kN) 0 20 40 60 80 100 Sto rey 1 2 Difference -100 0 100 Col element-LS-LS-(A), Y
Chord Rotation, Bot (rad)
0.00 0.01 0.02 0.03 Sto rey 1 2 Difference -0.005 0.000 0.005
parameters resulting for the assumption of lumped mass reveal minor variations with respect to the one corresponding to a more realistic model. Similar behaviour was also observed when the model assumes the beams with the same cross section (end-section) over the entire length. Nevertheless, the local response parameters reveal generalised deviations, occasionally important, for both shear forces and chord rotations measured in beams and columns. The analyses seem to be particularly sensitive to the generalised presence of unsupported beams (beams framing into beams). This way, if the analyst is interested in perform a much reliable and consistent assessment, the masses should be modelled as distributed and the beams with their actual reinforcement, representing this way the actual properties of both mass and elements. On the other hand, if one is interested in determining the seismic response of a given building in a fast and approximate manner, the use of lumped masses together with the simplified beam elements, leads to a reasonably reliable solution, resulting in significantly faster analysis.
ACKNOWLEDGMENTS
The authors would like to acknowledge the support provided by the Italian Ministry of Foreign Affairs, through the financial program of foreign nationals, and the European Commission, through the financing of the FP7 SYNER-G and NERA research programs, under the framework of which this work has been partially funded. The authors are also very grateful to Dr. Ihsan Bal, for the kind provision of the building models and assistance regarding the interpretation of their structural and non-structural characteristics.
REFERENCES
Bal, I., Crowley, H., Pinho, R., Gulay, F.G. (2008). Detailed assessment of structural characteristics of Turkish RC building stock for loss assessment models. Soil Dynamics and Earthquake Engineering, Vol. 28, pp. 914-932.
CEN (2005a). Eurocode 8: Design of structures for earthquake resistance. Part 1: general rules, seismic actions and rules for buildings. EN 1998-1, Comité Européen de Normalisation, Brussels, Belgium.
CEN (2005b). Eurocode 8: Design of structures for earthquake resistance. Part 3: Assessment and retrofitting of buildings. EN 1998-3 Comité Européen de Normalisation, Brussels, Belgium.
Crisafulli, F.J. (1997). Seismic behaviour of reinforced concrete structures with masonry infills. Ph.D. Thesis, University of Canterbury, New Zealand.
Fajfar P., Fischinger M. (1988). N2 - A method for non-linear seismic analysis of regular buildings,” Ninth
World Conference in Earthquake Engineering. Tokyo-Kyoto, Japan.
Kunnath, S., Erduran, E. (2008). Pushover procedures for seismic assessment of buildings: issues, limitations and future needs. Nonlinear Static Methods for Design/Assessment of 3D Structures, Lisbon, Portugal. Mpampatsikos, V. (2008). Critical Assessment of the methods of Analysis of R.C. frame existing buildings
proposed in Eurocode 8. Individual Study, European School for Advanced Studies in Reduction of Seismic Risk (ROSE School), University of Pavia, Italy.
Mpampatsikos, V., Petrini, L. and Nascimbene, R. (2009). Considerations and suggestions about the seismic assessment procedures of existing r.c. frame buildings according to OPCM 3431 and Eurocode 8.
Environmental Semeiotics, 2(1), pp.31-47, 2009.
Panagiotakos, T., Fardis, M. (1996). Seismic response of infilled RC frames structures. World Conference on
Earthquake Engineering, Acapulco, México.
Seismosoft (2010). SeismoStruct - A computer program for static and dynamic nonlinear analysis of framed structures. Available from URL: www.seismosoft.com
Sousa, R., Bianchi F., Pinho R., Nascimbene R. (2011). Analysis Issues on Seismic Assessment of Existing
Structures. Thematic Conference on Computational Methods in Structural Dynamics and
Earthquake Engineering, Corfu, Greece.
Tanganelli, M., Viti, S., De Stefano, M. Rinhorn, A.M. (2011). Influence of infill panels on the seismic response of existing RC buildings: a case study. European Workshop on the seismic behaviour of Irregular and