Department of Information Science and Technology
How Employee Portal Contributes for
the Intangible Assets Value Creation
David Santos Mendes
A dissertation presented in partial fulfilment of the requirements for the degree of Master of Science in Information Systems Management
Supervisor:
PhD. Mário Romão, Assistant Professor ISCTE-IUL
i
Acknowledgements
The work presented in this thesis would not have been possible without the support from many people. I take this opportunity to express my sincere gratitude to all those who made this work possible.
I wish to thank to …
my wife, Cristina, and my lovely children, Maria, Francisco, and Leonor for all their love and patience and for giving me the courage to make it, and to you this thesis is dedicated; my parents for instilling in me the importance of education;
my supervisor Professor Mário Romão for providing guidance, encouragement, thoughtful criticism and for his availability;
my friends for all the motivation.
I also wish to recognize the support and collaboration received from Dalila Ribeiro Martins, Pedro Esteves de Carvalho and Ana Allen Lima from Portugal Telecom.
ii
Abstract
Today's increasingly business competition and the information technologies development led to huge corporate organisational changes and pulled intangible assets up in the value chain. Employees’ skills, talent and know how, intellectual property, information, information systems, infrastructure, culture, teamwork capacity and other forms of non-physical assets are critical sources of value. But in order to generate value they must be integrated with each other and aligned with the objectives for the internal processes.
To address some organisation concerns related to value creation and change management, a theoretical multi-tier framework was developed. This framework illustrates the path and flows of value-creation, the relationships between “intangible assets” and the representation of “enabling changes projects”. Strategy Map and Benefits Dependency Network were combined, resulting in a stronger framework to help organizations enhancing their strategy knowledge, to reduce the risk of projects failure, and to capture real value from their investments.
In order to understand how an employee portal contributes for the intangible assets value creation process, an Employee Portal case study was carried out. The author performed a preliminary study comprising a literature review and data collection followed with semi-structured interviews and analysis of employee satisfaction surveys results to triangulate and confirm all the data gathered.
Keywords: Change Management, Strategy Map, Benefit Management, Intranet, Employee Portal, Strategic Alignment, Collaboration, Intangible Assets, Organizational Culture
iii
Resumo
O aumento da competitividade empresarial aliado ao nível de desenvolvimento das tecnologias de informação provocou enormes mudanças organizacionais e aumentou a importância dos ativos intangíveis na cadeia de valor. As competências, talento e o “saber fazer” dos colaboradores, a propriedade intelectual, informação, sistemas de informação, infraestrutura, cultura organizacional, capacidade de trabalho em equipa e outras formas de ativos intangíveis são fontes importantes de valor. Contudo para gerarem valor, estes ativos devem estar integrados entre si e alinhados com os objetivos para os processos internos. Para endereçar algumas preocupações, da organização, relacionadas com a criação de valor e com a gestão da mudança, desenvolvemos um modelo teórico com estrutura multicamada. Este modelo ilustra os caminhos e os fluxos de criação de valor, as relações entre os "ativos intangíveis" e a representação dos "facilitadores de mudança". Combinámos o Mapa
Estratégico e a rede de dependência de benefícios, resultando num modelo mais robusto para ajudar as organizações a melhorar o conhecimento da estratégia, reduzindo o risco de falha de projetos e captando o valor real de seus investimentos.
Por forma a entender a forma como um portal de colaborador contribui para o processo de criação de valor dos ativos intangíveis da empresa, foi realizado um estudo de caso com um portal de colaborador. O autor realizou um estudo preliminar que compreende a revisão da literatura e coleta de dados, seguida por entrevistas semiestruturadas e análise dos
resultados de questionários de satisfação de colaboradores para triangulação e confirmação dos dados recolhidos.
Palavras-chave: Gestão de Mudança, Mapa estratégico, Gestão de Benefícios, Portal de Colaborador, Alinhamento Estratégico, Colaboração, Ativos Intangíveis, Cultura
iv
Index
List of figures ... vii
List of tables ... viii
List of Abbreviations ... x
1 Introduction ... 1
1.1 Motivation for research ... 1
1.2 Problem statement ... 1 1.3 Objectives ... 2 1.4 Research questions ... 2 1.5 Research Methodology ... 2 1.5.1 Research approach ... 2 1.5.2 Object of study ... 3 1.5.3 Research design ... 4 2 Literature review ... 7
2.1 The importance of intangible assets ... 7
2.2 Corporate culture ... 7
2.3 Strategy Map, a tool to capture the organization’s strategy ... 8
2.4 The creation of value from intangible assets ... 10
2.5 The role of the Employee Portal ... 11
2.6 Employee Portal business drivers and outcomes ... 14
2.7 Employee portal stages of maturity ... 16
2.8 ICT investments management ... 17
2.9 Benefits Management ... 18
2.10 The importance of change management ... 21
2.11 Literature review summary ... 22
3 Framework ... 24
3.1 Modifications to Strategy Maps ... 24
3.2 Theoretical Framework ... 28
3.3 Application of the Framework ... 32
v
3.3.2 Organizational capital ... 35
3.3.3 Innovation processes ... 37
3.3.4 Support processes ... 38
3.3.5 Correspondent enabling changes ... 39
4 Case Study ... 40
4.1 Collected data ... 40
4.1.1 Corporate documentation ... 40
4.1.2 Interviewed people profile ... 40
4.1.3 Employee Satisfaction Questionnaires ... 40
4.2 Portugal Telecom strategic context ... 41
4.3 Cultural transformation ... 43
4.4 Employee Portal ... 46
4.5 Considered period ... 49
4.6 Benefits Dependency Network ... 50
4.6.1 Building the Benefits Dependency Network ... 52
4.6.2 Benefits Dependency Network ... 55
4.7 Framework ... 56
4.7.1 Learning & Growth Perspective ... 57
4.7.2 Enabling Changes ... 63
4.7.3 Internal perspective ... 63
4.8 Discussion ... 65
5 Conclusion ... 67
5.1 Answering the research question ... 67
5.2 Contributions ... 68
5.3 Limitations ... 69
5.4 Future work ... 69
Bibliography ... 70
Annexes ... 77
Annex 1 – Context of thesis delivered in interviews ... 77
Annex 2 – List of questions of semi-structured interviews ... 83
vi
Annex 4 – Editorial, éPT! magazine, nº 3, September-October 2003 ... 88
Annex 5 – Launching Employee Portal inSapo in 2003 ... 89
Annex 6 – éPT! first anniversary ... 90
Annex 7 – Launching Employee self service portal ... 91
Annex 8 – Unique corporate intranet ... 92
Annex 9 – Timeline of Employee Portal related projects, until 2010 ... 93
Annex 10 – Ninth anniversary of the corporate intranet ... 95
Annex 11 – First anniversary of the Employee self service portal ... 97
Annex 12 – Launching Equipas éPT!, éPT! magazine nº 4 – Christmas special, 2003 . 98 Annex 13 – éPT! magazine, nº 5, 2004 ... 100
Annex 14 – Visão magazine, 29th January, 2004 ... 104
Annex 15 – Sabio launch, éPT! magazine nº 11, 2005 ... 105
Annex 16 – Sábio, éPT! magazine nº 12, 2006 ... 106
Annex 17 – The new éPT!, éPT! magazine nº 12, 2006 ... 107
Annex 18 – Group Culture, éPT! magazine, special number “Inovar, mudar, melhorar”, 2005 ... 109
Annex 19 – Article about PRO UNO, éPT! magazine, nº 3, September-October, 2003 ... 110
Annex 20 – Article about the launch of OPEN, éPT! news, 2009 ... 112
Annex 21 – Article about éPT! card, éPT! magazine, nº 1, April-May, 2003 ... 114
Annex 22 – Article about the launch of OPEN star, May of 2011 ... 115
Annex 23 – Article about the launch of OPEN awards, May of 2011 ... 117
vii
List of figures
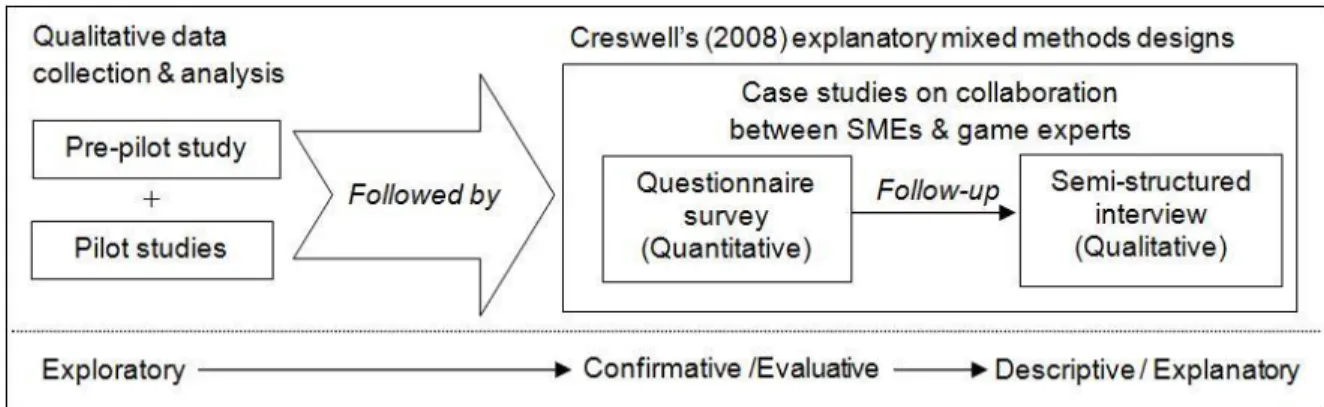
Figure 1: Creswell’s explanatory mixed methods designs (Warwick, 2010) ... 3
Figure 2: Case study research – a linear but iterative process (Yin, 2009) ... 4
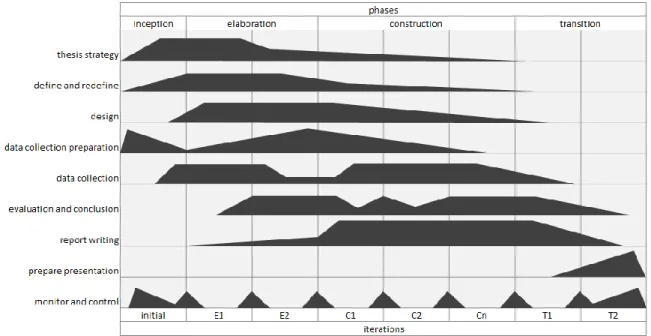
Figure 3: Thesis development Unified Process ... 5
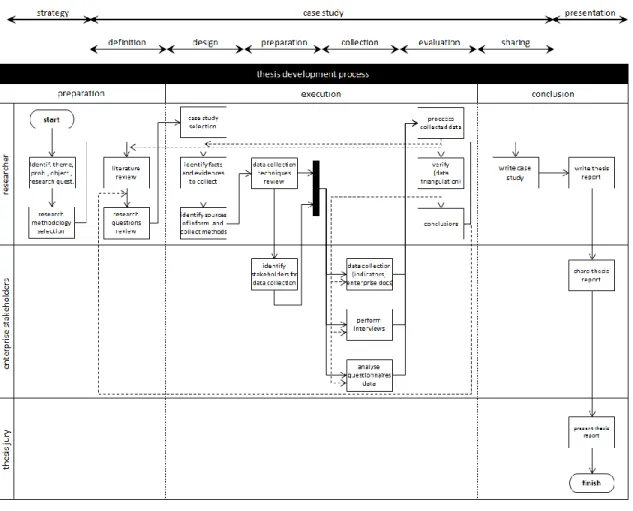
Figure 4: Thesis activity diagram ... 6
Figure 5: Components of Standard & Poor’s 500 Market Value (Ocean Tomo, 2011) ... 7
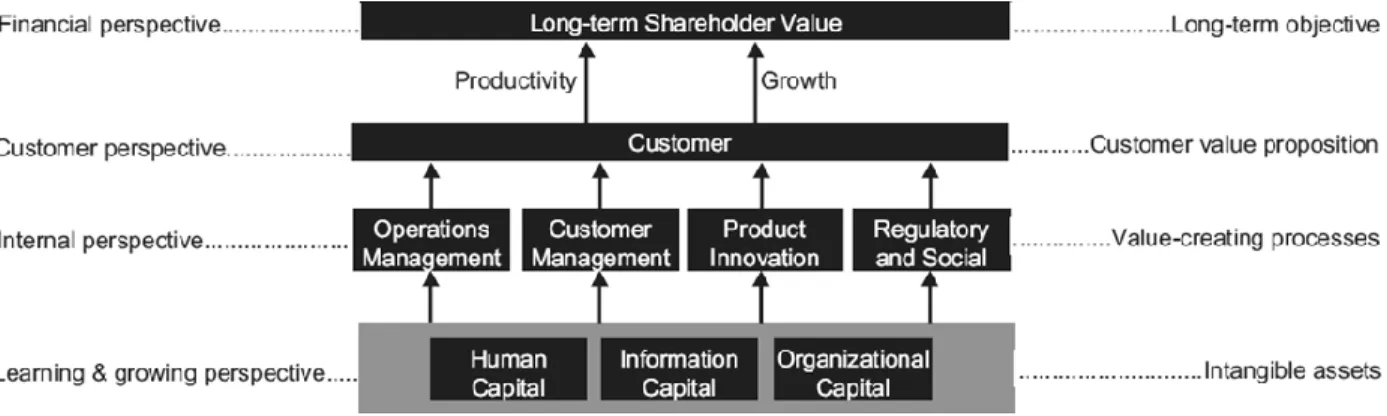
Figure 6: A simplified Strategy Map (Kaplan, et al., 2004) ... 9
Figure 7: Completed Generic Strategy Map (Armitage, et al., 2006) ... 10
Figure 8: Portal categories according to audience. Source: (Forrester Research, 2008) ... 14
Figure 9: Intranet maturity framework (Razorfish, 2008) ... 16
Figure 10: The value of benefits management, taking a major pharmaceutical company as an example (Ward, et al., 2006)... 19
Figure 11: The benefits dependency network (Ward, et al., 2006) ... 20
Figure 12: An example value creation map (INSEAD, 2005) ... 25
Figure 13: Critical success factors for knowledge management (NASA, 2002)... 26
Figure 14: Value-creating processes in Strategy Maps (Kaplan, et al., 2004) ... 27
Figure 15: How IT creates business value (Soh, et al., 1995) ... 29
Figure 16: Modified model for business value creation from IT (Marshall et al., 2005) ... 29
Figure 17: Strategy Map, Benefits Dependency Network “stack” visual presentation ... 30
Figure 18: Framework visual presentation ... 31
Figure 19: Framework visual presentation addressing Strategy Map limitations ... 31
Figure 20: Elements subject of study ... 33
Figure 21: The importance of support processes ... 38
Figure 22: Strategic and organizational challenges of the PT Group (Seruya, 2008) ... 43
Figure 23: The main strategic and managerial challenges of PT Group (Seruya, 2008) ... 43
Figure 24: Portugal Telecom new organization (Portugal Telecom, 2003) ... 44
Figure 25: Operational initiatives (Portugal Telecom, 2003) ... 45
Figure 26: Complimentary employee portal functionalities (Forrester Research, 2008) ... 46
viii
Figure 28: Benefits dilution from planned benefits to realisation (Bartlett, 2006) ... 49
Figure 29: BDN construction for problem-based investments (Peppard, et al., 2007) ... 51
Figure 30: Developed BDN ... 55
Figure 31: Framework linkage evidences ... 56
Figure 32: A process model for benefits management (Ward, et al., 2006) ... 78
Figure 33: The benefits dependency network (Ward, et al., 2006) ... 79
Figure 34: BDN construction for problem-based investments (Peppard, et al., 2007) ... 80
Figure 35: Employee portal implementation timeline ... 81
Figure 36: Developed BDN based on literature review of corporate documents ... 82
List of tables
Table 1: Portal Definitions over time ... 13Table 2: Top Business Drivers and Outcomes from Employee Portal Implementations (Forrester Research, 2007) ... 15
Table 3: Benefits classification according to contribution (Ward, et al., 2006) ... 19
Table 4: Existing linkage between studies “elements” found in literature review ... 33
Table 5: individual and organizational levels of analysis as well as technical and social skill sets (Ulrich, et al., 2004)... 35
Table 6: Major Portugal Telecom brands (Seruya, 2008) ... 42
Table 7: Corporate culture related indicators (Portugal Telecom, 2002-2011) ... 58
Table 8: Level of relevance to perform activities in 2005 (Portugal Telecom, 2002-2011) 59 Table 9: Alignment related indicators (Portugal Telecom, 2002-2011) ... 60
Table 10: Teamwork related indicators (Portugal Telecom, 2002-2011) ... 62
Table 11: Innovation related indicator (Portugal Telecom, 2002-2011) ... 64
Table 12: Business Drivers ... 118
Table 13: Business Objectives ... 120
Table 14: Business Benefits ... 122
Table 15: Business Benefits relationship with objectives and changes ... 124
ix Table 17: Enabling changes ... 128 Table 18: ICT enablers ... 129
x
List of Abbreviations
CBA – Cost-Benefit Analysis
ICT – Information and Communication Technology IS – Information Systems
IT – Information Technology HR – Human Resources
CIAT – Capital Investment-appraisal Techniques BM – Benefits Management
1
1 Introduction
1.1 Motivation for research
Over the years working as project manager in ICT projects, the author perceived some problems and worries surrounding these projects that are simultaneously of great interest and concern to organizations: (1) the difficulty to understand the real value and benefits of Intranet sites and Employee Portals; (2) justifying ICT investments in these solutions it’s not an easy task; (3) being a solution that implies great changes in culture, behaviour and processes it’s essential to build adequate change management programs; (4) since the value of these solutions depend greatly on information, it’s essential to keep it updated,
consistent, and with the proper orientation to profile and user responsibility.
This dissertation is the last item within the Master of Science in Information Systems Management programme at ISCTE-IUL Lisbon University Institute. The interest in the subject woke up in one of the previous courses – Benefits Management and Information System Governance.
The Benefits Management approach is a way of increasing the value generated from IT investments and it took our attention because “benefits realization” is directly linked to “change management”.
“Culture is perhaps the most complex and difficult dimension to understand and describe because it encompasses a wider range of behavioural territory than the others” (Kaplan, et al., 2004).
The main motivation for this research came from the experience the author had while involved in several IT projects related with the creation of a new internal brand within Portugal Telecom (Seruya, 2008).
1.2 Problem statement
Employee portals are relevant information capital assets that perform an important role in the organization strategy. But justifying investments in these solutions it’s not an easy task and their implementation, demands for great changes in culture, behaviour and processes. Therefore it’s essential to understand employee portals business value and build adequate change management programs.
It’s obvious the importance of using visual representations of strategic intent to understand how organizational resources are used to create value. And “Strategy Maps” clarify the way
2 intangible assets are aligned with strategy to create value for the organization. However they don’t address organization concerns related to change management.
To conveniently address these matters a framework was developed to help understanding the cause-effect relationships that generates business value, as well as providing top management and decision makers the information needed for a suitable top-down commitment and sponsorship, essential to perform appropriate change management and benefits realization.
1.3 Objectives
Strategy Map (SM) and Benefits Dependency Network (BDN) were combined, resulting in what can be considered a stronger framework to help organizations to enhance their
knowledge of the strategy, to reduce the risk of investments failure or misuse, and a contribution to capture real value from them.
The objective is to apply this framework to an employee portal case study, as a means to understand how a corporate employee portal contributes for the intangible assets value creation process and what are the relevant Innovation and Support processes involved and the required changes to guarantee benefits realization.
1.4 Research questions
The main and unique research question is directly related with the difficulties to understand the role performed by the employee portal in the organization strategy: “How employee
portal contributes for the intangible assets value creation?”
To answer to this type of explanatory questions, case studies, histories and experiments are the preferred researched methods (Yin, 2009).
1.5 Research Methodology
1.5.1 Research approach
While qualitative researchers seek to understand the context or setting of the participants through visiting this context and gathering information personally, in quantitative studies, researchers advance the relationship among variables and pose this in terms of questions or hypotheses (Creswell, 2008).
3 Although case study seems to be the best fitted research method to answer the research question, the author decided to follow a pragmatic approach to research, using mixed methods.
Mixed methods research has been defined by Creswell and Plano Clark as “a research design with philosophical assumptions as well as methods of inquiry. As a methodology, it involves philosophical assumptions that guide the direction of the collection and analysis and the mixture of qualitative and quantitative approaches in many phases of the research process. As a method, it focuses on collecting, analyzing, and mixing both quantitative and qualitative data in a single study or series of studies. Its central premise is that the use of quantitative and qualitative approaches, in combination, provides a better understanding of research problems than either approach alone” (Creswell, et al., 2007 p. 5).
One of the advantages of using mixed methods is triangulation. “Triangulation refers to the use of different data collection techniques within one study in order to ensure that the data are telling you what you think they are telling you. For example, qualitative data collected using semi-structured group interviews may be a valuable way of triangulating quantitative data collected by other means such as a questionnaire” (Saunders, et al., 2009 p. 146). This study considered the use of a variety of data sources subject to validation through data triangulation.
Figure 1: Creswell’s explanatory mixed methods designs (Warwick, 2010)
1.5.2 Object of study
Portugal Telecom is an international operator focused on three main geographies: Portugal, Brazil and Africa. In addition, PT also has investments in Asia, namely in East Timor and, until 2013, in Macao. PT has more than 100 million customers worldwide and generates 58% of its revenues outside Portugal, including 53% from Brazil.
In the Portuguese market, PT is a customer-oriented company focused on innovation and execution, managing its business along customer segments: (1) Residential: providing a differentiated and sophisticated multi-screen pay-TV experience (having achieved a market
4 share of 37% in the Portuguese pay-TV market in just over 4 years); (2) Personal: mobile data and convergence as key growth levers, and (3) Enterprise: new ICT services for both corporations and small/medium businesses leveraging PT’s unique access networks and next generation data centres.
At an international level, PT is focused on improving the operational performance of its assets and on sharing best practices across the various businesses. The expansion of international operations to multiple geographies is one of the most important catalysts of value creation in the telecommunications sector and PT has built a relevant portfolio of international operations.
The selection of the company was made by convenience.
1.5.3 Research design
The methodology used in the research began with a literature review of research/academic papers, books and specialized websites. Literature review was followed by organization data gathering (consisting mainly on internal communication and organizational climate questionnaires) and interviews to selected stakeholders.
Figure 2: Case study research – a linear but iterative process (Yin, 2009)
Once this thesis development process is iterative and incremental we used Unified Process framework to illustrate the phases and workload in each main activity performed.
The Unified Process is an iterative and incremental development process, where each iteration results in an incremented version of the thesis that is released. This version is
5 supposed to offer incremental improvement over the previous one. Most iteration include work in most of the process disciplines with the relative effort and emphasis changing over the course of the project.
Figure 3: Thesis development Unified Process
Unified Process phases:
i. In inception phase the author established the thesis scope and boundary conditions, prepared a preliminary project schedule and identified major risks.
ii. During the elaboration phase, the author organized the main topics and performed preliminary literature review in order to validate the thesis feasibility and mitigate major risks. At this point, scope is refined and project schedule is detailed.
iii. Construction is the largest phase and it’s when the author performed data collection and thesis development. Each iteration addresses a different partial deliverable and contributes for the overall product.
iv. In transition phase the author performed thesis review and refinement and prepared the thesis delivery and presentation.
The author considered nine core process workflows, representing a partitioning of all stakeholders and activities:
i. In thesis strategy the author, based on his motivation, established the thesis topic, the object of study, thesis objectives, problem and research questions and according to the type of question selected the adequate research methodology;
6 ii. In define and redefine activities the author performed literature review and
research questions review;
iii. Design activities considered the framework design, case study selection,
identification of relevant facts and evidences to collect, sources of information and collection methods;
iv. In data collection preparation activities, the author reviewed data collection techniques, interview structure and identified participants / stakeholders and corporate document sources;
v. Collect data activities considered gathering corporate information and performing interviews;
vi. Evaluation and Conclusion activities considered collected data analysis and verification and taking conclusions out of it;
vii. In report writing activities the author finished the thesis report considering the case study report;
viii. Monitor and control activities were dedicated to check and update schedule and to control thesis risk.
7
2 Literature review
2.1 The importance of intangible assets
Today's increasingly business competition and the information technologies development conducted to huge corporate organizational changes and pulled intangible assets up in the chain value.
Intangible assets – skilled workforce, patents and know-how, software, strong customer relationships, brands, unique organizational designs and processes, and the like – generate most of corporate growth and shareholder value (Lev, 2004). In fact these intangible assets may be just as real as other assets in their ability to generate value (Brynjolfsson, et al., 1999).
The significant growth of intangible assets is clear by the change in tangible and intangible asset structure in modern organizations. According to Ocean Tomo, an intellectual property merchant bank, the average market value of a Standard & Poor’s 500 company in 1975 consisted only of 17% intangible assets whereas it has grown up to 80% by 2010 (Ocean Tomo, 2011).
Figure 5: Components of Standard & Poor’s 500 Market Value (Ocean Tomo, 2011)
2.2 Corporate culture
“Leadership, teamwork and communication are important ingredients in organizational capital. Together, they provide the ability to adapt, and to make the changes required to execute on the strategy” (Armitage, et al., 2006 p. 22).
8 Marr (2004), following other authors, highlights the relevance of corporate culture and states that it “influences employee competencies and vice versa” (Marr, et al., 2004 p. 317), “reinforces the achievement of the overall goals” (Marr, et al., 2004 p. 315), gives “a common and distinctive method for transmitting and processing information” (Marr, et al., 2004 p. 315), “defines a common way of seeing things, sets the decision-making pattern, and establishes the value system” (Marr, et al., 2004 p. 315), “encourages individuals to operate both as an autonomous entity and as a team in order to achieve the company’s objectives” (Marr, et al., 2004 p. 316).
The importance of developing an adequate corporate culture to promote collaboration, sharing knowledge and innovation is consensus among academics and practitioners. In fact Bharadwaj (2000) describes knowledge management as a “social process that requires tremendous organizational change” and he says that creating a culture for knowledge management involves both technological and social aspects like changing the organization structure, control and communication systems and reward structures.
The use of collaboration practices in companies is the starting point to create innovative processes, products or services that differentiate the company from the competition IBM (2008). To make these changes possible, companies must (i) implement a culture of collaboration, trust and share of knowledge and competences; (ii) implement tools to exploit collective knowledge, experience and communities and (iii) create the habit to use those tools (IBM, 2008 and Martinia, et al., 2009).
The development of such skills and abilities are the foundations for the success of Intranet initiatives and they demand both time and investments in communication and education, in order to modify the behaviours and overcome existing “barriers” and “alibi” to the non-use (Martinia, et al., 2009).
2.3 Strategy Map, a tool to capture the organization’s strategy
“Although intangible assets had become major sources of competitive advantage there were no tools to describe them and the value they create” (Kaplan, et al., 2000 p. 2). The concept of Balanced Scorecards was introduced in 1992 to understand this value creation through the measurement of the organization performance in four perspectives (financial, customer, internal process and learning and growth).
But to capture the organization’s strategy in a visual form – to facilitate communication and discussion of the company strategy as it describes how an organization creates value for its shareholders, customers and/or citizens – they developed Strategy Maps (Kaplan, et al., 2004). Strategy maps provides “a visual framework for an organization’s strategy – how it intends to create value” (Kaplan, et al., 2004 p. 2) and they clarify all cause-effect
9 relationships between the same four perspectives of Balanced Scorecard so that an effective strategy can be developed and then optimized over time (Kaplan, et al., 2004).
Kaplan and Norton developed a standard template that “contains four distinct regions – financial, customer, internal processes, and learning and growth – that correspond to the four perspectives of the balanced scorecard. The template provides a common framework and language that can be used to describe any strategy” (Kaplan, et al., 2000 p. 2).
Figure 6: A simplified Strategy Map (Kaplan, et al., 2004)
Reading the map “from bottom to top, the template shows how employees need certain knowledge, skills, and systems (learning and growth perspective) to innovate and build the right strategic capabilities and efficiencies (internal process perspective) so that they can deliver specific value to the market (customer perspective), which will lead to higher shareholder value (financial perspective)” (Kaplan, et al., 2000 p. 5).
Armitage, et al. (2006) propose a completed generic strategy map, showing all three types of capital working together to help the company execute the elements of the internal business perspective.
Aligned learning and growth and internal business processes (the “how we plan to
accomplish it” part of the map) facilitate achievement of customer and financial strategies (the “what we want to accomplish” part of the map).
10 Figure 7: Completed Generic Strategy Map (Armitage, et al., 2006)
2.4 The creation of value from intangible assets
According to Ward and Daniel, “IT, of itself, delivers few benefits. It is the complementary business and organizational changes that produce the majority of benefits” (Ward, et al., 2006 p. 212). Brynjolfsson and Yang, based on empirical evidences, state that up to nine-tenths of the costs and benefits of computer capital are embodied in otherwise unobserved intangible assets (Brynjolfsson, et al., 1999).
Intangible assets are very important because of their ability to generate value. According to Kaplan and Norton, for this to occur they must be adequately aligned with the organization strategy and integrated programs must be undertaken to enhance all intangible assets in a coordinated way (Kaplan, et al., 2004).
Hughes & Morton’s research show that the “productivity gains and competitive advantage to be gained from IT lie not in the technology per se but in the way that assets such as organizational processes, embedded know-how, people skills and new organizational structure innovations all can lead to new products and processes creating further sources of sustainable competitive advantage” (Hughes, et al., 2006 p. 52).
11 “The key to managing intangible assets is to measure their degree of ‘readiness’ – which is defined as the extent to which the intangible asset meets the requirements of the
enterprise’s overall strategy” (Kaplan, et al., 2004 p. 1).
Kaplan and Norton group intangible assets into three main categories: Human capital (the skills, talent, and knowledge that a company’s employees possess); Informational capital (the network, databases, information systems, and infrastructure of the organization); Organizational capital (culture of the corporation, leadership of the company, how aligned the employees are with the strategy of the organization, and the ability of the employees to share knowledge) (Kaplan, et al., 2004).
“Human capital is the economic value an organization derives from (a) application of knowledge, (b) collaboration, and (c) engaged individuals” (Armitage, et al., 2006 p. 20), “Information capital relates to how organizations utilize their information systems,
networks, manuals, databases, files and infrastructure to gain competitive advantage and to execute strategy” (Armitage, et al., 2006 p. 21) and “Organizational capital is the firm’s ability to connect employee goals to corporate goals” (Armitage, et al., 2006 p. 22).
2.5 The role of the Employee Portal
Intranets, central document repositories and knowledge databases are important information capital assets and perform an important role in the corporation strategy when used
effectively (Armitage, et al., 2006).
These tools evolved from a communication and information-sharing stage to a consolidated workplace (Razorfish, 2008) (Forrester Research, 2010) and they are essential to promote communication, collaboration and sharing information within the organization (Urbach, et al., 2009), they contribute to the corporate performance improvement and they seek to improve the ability to deliver the right information to the right people at the right time (Stancich, et al., 2000).
But to be qualified as a source of sustained competitive advantage they must add value to the organization, must be rare, inimitable and non-substitutable (Gomes, et al., 2012 referring to Barney, 1991). Therefore to evaluate the intranet as a strategic tool, its current and potential contribution to the organizational business strategy must be analyzed
(Stancich, et al., 2000 p. 262).
Stancich and Curry, conclude that “to obtain maximum value from an intranet, both the ‘soft’ cultural issues of information sharing and change in work processes must be addressed alongside the ‘hard’ systems issues of managing the intranet as an information system and a business resource” (Stancich, et al., 2000 p. 255).
In an article about obtaining competitive advantage through employees, Jassim (2002), supports the importance to ensure top management commitment and sponsorship and
12 evidences that one of the sources of competitive advantage is the employees and “it really depends on employee’s attitudes, competencies and skills; their ability to generate
commitment and trust, communicate aspirations and work in complex relationships” (Jassim, 2002 p. 1).
“Information and the way it is used can sustain a competitive edge in business but there must be a shift in the perception of time spent looking for learning and best practice as unproductive; willingness has to emerge to foster a networking, information sharing
culture, which inevitably has to be a part of organizational culture. Using the intranet has to become part of everyday working life without engendering a feeling that such use is a waste of time and does not constitute ‘work’” (Stancich, et al., 2000 p. 250).
Therefore the implementation of intranets must come with an adequate change in culture, behaviour and processes. And for that to occur, change management initiatives, top-down commitment and frequent examination are critical.
Before undertaking the path of researching and understanding how Intranet adds value to the organization, becoming a source of sustained competitive advantage, it’s worthwhile setting the standards considering the terms that are used in this field.
It is common understanding among academic through the evidence of the reviewed literature (Gralla, 1996; Blackmore, 1997; Greer, 1998; Stancich & Curry, 2000; Parks cited in Yen and Chou, 2001) that Intranet can be defined as an internal network that uses Internet technologies and standards and that is accessed internally by authorized users to share information and knowledge.
Going a little further on the evolution of these tools according to some known maturity frameworks (Gartner, 2010) (Razorfish, 2008) (Forrester Research, 2010) (Hawking, et al., 2003) Intranet evolved to Portals and they are now much more complex solutions serving other organization objectives. For the Meta Group, Enterprise portals are replacing first-generation intranet Web sites as a more effective, efficient, and flexible means of managing and delivering applications and information to diverse sets of users (Meta Group, 2002). One of the first definitions of a portal in the corporate context appeared in a Merrill Lynch report. In this report Shilakes & Tylman, consider a portal was “applications that enable companies to unlock internally and externally stored information, and provide users a single gateway to personalized information needed to make informed business decisions.” (Shilakes, et al., 1998 p. 8).
13 Table 1: Portal Definitions over time
Year Author Definition 1998 Shilakes
& Tylman
“Enterprise information portals are applications that enable companies to unlock internally and externally stored information, and provide users a single gateway to personalized information needed to make informed business decisions.”
2000 Detlor “Enterprise portals are single-point web browser interfaces used within organizations to promote the gathering, sharing and dissemination of information throughout the enterprise. As such, these tools offer
corporations a means by which to manage and access information from disparate sources across the firm.”
2002 Chan and Chung
“An enterprise portal is any system that allows users to use the web browser to get all corporate information he needs. A portal is a flexible information technology platform that allows dispersed sources of information to be linked together while providing users the opportunity to customize what they need from the information source.”
2005 Daniel and Ward
“Enterprise portals are secure web locations, that can be customized or personalized, that allow staff and business partners access to, and interaction with, a range of internal and external applications and
information sources. Uses of the portal may include: improved access to information, increased collaboration, greater use of existing applications, and effective integration between applications.”
2007 Chan and Liu
“A corporate portal is a web-based platform to access with security a broad range of information, services, applications, and expertise.” 2008 Gartner "Web software infrastructure that provides access to, and interaction
with, relevant information assets (for example, information/content, applications and business processes), knowledge assets and human assets by select targeted audiences, delivered in a highly personalized manner." Source: A Conceptual Model for Measuring the Effectiveness of Employee Portals, (Urbach, et al., 2009 p. 2); Magic Quadrant for Horizontal Portal Products (Gartner, 2008 p. 4)
According to Urbach et al. (2009), following other authors, to identify some of the main functionalities that incorporated portals and made them more complex and integrated tools. And they say “enterprise portals have evolved from low-end intranets into highly integrated IS. Today, such portals enable the integrated support of information, communication, applications, and business processes.” (Urbach, et al., 2009 p. 2).
In terms of their target user group (or audience), enterprise portals can be classified as supplier (or business partners), customer or employee portals (Forrester Research, 2008) (Urbach et al., 2009 following Riempp, 2002) (Gartner, 2008).
14 Figure 8: Portal categories according to audience. Source: (Forrester Research, 2008)
Sugianto & Tojib say employee portal uses “web-based interface to access personalized information, resources, applications, and e-commerce options” that employees can access through a network connection. These portals “are provided with relevant proprietary
information displayed in a password-protected setting” (Modeling User Satisfaction with an Employee Portal, 2006 p. 240). Forrester Research defines them as “internally facing sites that serve workers’ information and self service needs” (Forrester Research, 2007 p. 1). The role of the employee portal has become crucial in many organizations, especially because they integrate information, tools and business applications and processes (Urbach et al., 2009 following other authors) and as a tool that drives corporate strategy, improving teamwork, establishing a communications strategy and improving employees career development, training and flexibility (Stancich, et al., 2000).
2.6 Employee Portal business drivers and outcomes
The Employee Portal was one of the tools for the new strategy and getting employees into this common platform may drive the company to experience some of the following benefits, among others:
Improving corporate communication (Razorfish, 2008), (Prescient, 2009);
Collaboration and sharing information between employees results in Opportunities for new business, faster development of products and services (Razorfish, 2008), (Prescient, 2009), (Nielsen Norman Group, 2009), (IBM, 2008), (Forrester Research, 2007);
Improved employee service/convenience accessing information and services with moe autonomy of employees in managing HR processes and information, results in reducing costs, improving productivity and increasing satisfaction (Razorfish, 2008), (Prescient, 2009), (Nielsen Norman Group, 2009), (IBM, 2008), (Cisco, 2004);
15 Internal processes improvement and break-down bureaucracy (Forrester Research,
2007), (Intranet Road Map, 2000);
Easy access to integrated applications and information results in improvements of employee performance once they find information more easily and perform their jobs better (Forrester Research, 2007), (Intranet Road Map, 2000);
Promotes a culture of sharing and collaboration (Intranet Road Map, 2000).
In a survey carried out with 261 US employers that planned to have an employee portal, Forrester Research identified top Business Drivers and Outcomes from Employee Portal Implementations. We noticed that promoting corporate culture and company alignment is not among the frequent answers obtained.
Table 2: Top Business Drivers and Outcomes from Employee Portal Implementations (Forrester Research, 2007)
Top Business Outcomes Top Business Drivers
“What results have you gained from deploying the employee portal?” (select all that apply)
“What are the most important business drivers behind your decision to consider or implement an employee-facing portal?” (select top three)
Improved employee service/convenience (77%)
Greater process efficiency (59%)
Cost, resource, or maintenance reductions (55%)
Increased employee satisfaction (41%) Better visibility into business
operations/metrics (36%)
Greater employee loyalty/retention (32%) New product, process, or service
innovations (27%)
Reduced cost from decreased Web/intranet design or management (27%)
Cost reduction due to consolidated servers or software licenses (23%)
Facilitate self-service for managers and employees (94%)
Enable collaboration and information sharing (50%)
Automate business processes (40%) Reduce costs (25%)
Provide secure (remote) Web access (25%) Provide online training (17%)
Control access to content or applications (10%)
Better govern corporate intranet (8%) Allow access to operational dashboards on key business metrics (6%)
16
2.7 Employee portal stages of maturity
An employee portal can be regarded as a specific type of enterprise portal. There are several maturity models and frameworks to analyze Employee Portals. The author has chosen Razorfish Maturity Framework because it is well aligned with the portal definitions used in the literature reviewed (Urbach, et al., 2009), (Gartner, 2008).
Hereafter we resume Razorfish framework different stages. Each subsequent stage of maturity generally includes the features from the stages preceding it.
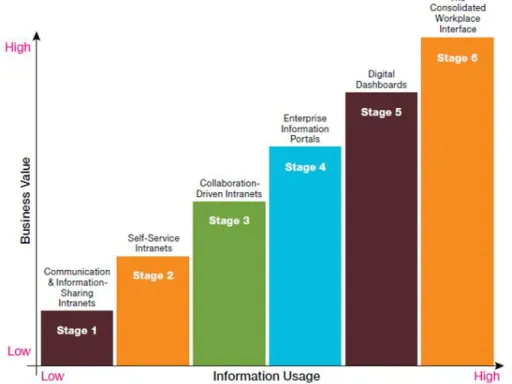
Figure 9: Intranet maturity framework (Razorfish, 2008)
Stage 1: First-generation intranets are used primarily for communication and information sharing. Generally established by entrepreneurially-minded employees, they focus on communicating a department’s purpose and activities to the rest of the company (Razorfish, 2008).
Stage 2: Self-service intranets focus on delivering HR, Finance and Facilities-related services to employees within a department or a company (Razorfish, 2008).
Stage 3: As intranets enter this stage, they move their focus to collaboration while continuing to improve the communication, information-sharing and self-service components. These intranets address the needs of project and department teams required to collaborate around specific initiatives and serve as a home for the communities of practices in an organization (Razorfish, 2008).
17 IBM (2008) refers also to a new form of collaboration that will turn collaboration into innovation. Hewlett-Packard is also using employee prediction markets to help drive sales forecasts.
Stage 4: These intranets include significant customization and personalization so that employees are provided only the information and tools needed for them to do their jobs. These intranets truly serve as employee productivity tools that enable employees to perform key business tasks (Razorfish, 2008).
Stage 5: Digital dashboards integrate real-time or near real-time information from data warehouses and business intelligence systems into an intranet interface. Targeted toward senior members of an organization, these intranets highlight the key performance indicators with which a company or a business unit can be managed (Razorfish, 2008).
Stage 6: These intranets integrate legacy applications, interfaces and partner portals into a single, consolidated dynamic interface for employees. In the organizations where these exist, they’re often not even called intranets. They also integrate email, voice (through VoIP), and contextual tools (in other words, every digital artefact in a company is presented through a single interface) (Razorfish, 2008).
Forrester Research refers to the ultimate stage of intranets as the information workplace (Forrester Research, 2010), while IDC calls them the Enterprise Workplace (IDC, 2006), a new user experience platform. In the Razorfish Intranet Maturity Framework this stage is referred as The Consolidated Workplace Interface (Razorfish, 2008).
2.8 ICT investments management
Although Employee Portal benefits are widely studied (Razorfish, 2008) (Forrester Research, 2007) (Prescient, 2009) (Cisco, 2004) (Nielsen Norman Group, 2009), it’s common understanding the difficulty to identify the Return on Investment of ICT1 projects, specially because the majority of benefits are intangible.
Intangible assets “aren't easy to measure, so managers often pay far less attention to them than to tangible investments like plants and equipment, but these capabilities give investors confidence in future earnings” (Ulrich, et al., 2004 p. 119).
In ICT projects, networks, computers and software are just a small part of the entire implementation costs and it’s the complementary investments that deliver the majority of benefits (Ward, et al., 2006). Brynjolfsson, Hitt, & Yang say that “successful projects require enormous management attention, worker training, and changes in seemingly unrelated areas of the business” (Brynjolfsson, et al., 2002 p. 9).
1
In the reviewed literature we found references to Information Technology (IT), Information Systems (IS) and Information and Communication Technology (ICT). In this study we will use ICT as an extended synonym of IT and IS.
18 It’s consensus among academics and practitioners that ICT investments should be carefully justified, measured and controlled (Milis, et al., 2009) but a surprising percentage of
enterprises failed to adopt fundamental best practices around portal sponsorship and governance and despite increased pressure to justify portal investments, a remarkable 91% of companies surveyed by Forrester Research report they do not measure or do not know if they measure the returns on their portal investments. This is consistent with broader trends that Forrester sees in which companies measure the expected value of ICT investments upfront to develop a business case, but they often fail to develop ongoing measures to assess the business value they actually realize (Forrester Research, 2007).
“Research strongly indicates that the feasibility study of capital investments in today’s companies and organizations is mainly based on financial cost-benefit analysis” (Milis et al., 2009 following other authors, p.4).
This might happen because most ICT investment decisions still remain in finance managers and because capital investment-appraisal techniques (CIAT) are well known, understood and practiced (Milis et al., 2009 following other authors).
All of these techniques consist on comparing costs and the economic benefits. “Benefits generated by an intranet not only serve the case for initial development but also the case for sustainability to ensure that the intranet develops into a genuinely value-added tool for the business” (Stancich, et al., 2000 p. 255).
Forrester Research analysts suggest that exclusively using financial measures has serious flaws: (1) There is a wide variety of financial measures in use today with multiple
interpretations; (2) They imply a precision that doesn’t exist, because the measures are calculated by a formula and we can only estimate the benefits; (3) They often fail to account for intangible benefits; (4) They don’t account for future opportunities; (5) They fail to incorporate risk (Forrester Research, 2006).
Therefore, it is essential to identify all the benefits to perform an adequate Benefits Management.
2.9 Benefits Management
Milis, et al. (2009) say the ratio of tangible to intangible and hidden benefits tends to be much smaller for ICT projects than in other projects. They use the term “iceberg
investments” used by Hinton & Kaye, 1996 to speak of the large proportion of the benefits that are “hidden” (Milis, et al., 2009).
The need to carefully justify, measure and control benefits of ICT investments should lead to the need of understanding them. Actually, “not all investments will be able to be justified financially”. However, the ability to explicitly measure the benefits is essential to their delivery. Additionally “Reviewing the benefits that are, and are not, realized from each
19 investment, is essential, if an organization is to increase the value it obtains from all its IS/IT investments” (Ward, et al., 2006 p. 356).
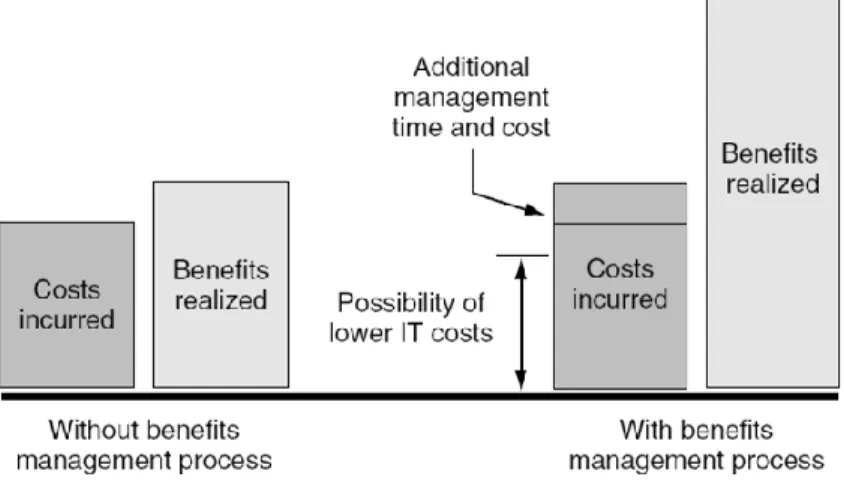
Figure 10: The value of benefits management, taking a major pharmaceutical company as an example (Ward, et al., 2006)
“The benefits management approach was developed to enable organizations to improve the value realized from specific investments” but it can also be used “to formulate, manage and implement strategic change programmes” and to “help formulate and implement business strategies” (Ward, et al., 2006 p. 383). Lin & Pervan agree that “the process model of benefits management developed by the Cranfield research program can be used as the basis for guidelines on best practice in benefits management” (Lin, et al., 2001 p. 15).
John Ward and Elizabeth Daniel propose the following benefit classification matrix according to contribution explicitness, and considering four levels based on the ability to assign a value to the benefit.
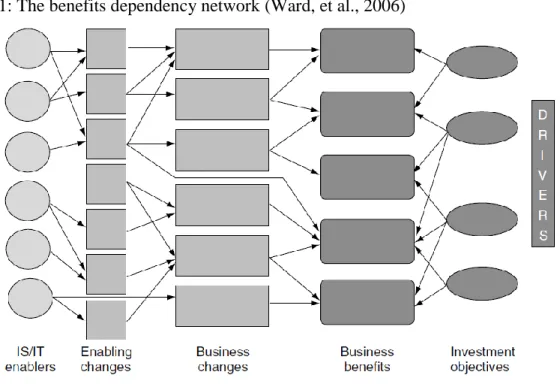
20 The benefits dependency network is a key output from the activity of determining the changes required for the delivery of each benefit and how the ICT development will enable these to occur (Ward, et al., 2006), (Peppard, et al., 2007).
“The BDN provides a framework for explicitly linking the overall investment objectives and the requisite benefits with the business changes which are necessary to deliver those benefits and the essential IT functionality to both drive and enable these changes to be made” (Peppard, et al., 2007 pp. 10,11).
Figure 11: The benefits dependency network (Ward, et al., 2006)
The development of the Benefits Dependency Network varies, depending on whether a problem-based or innovation-based investment is being considered. Whether the case, the “development of the Benefits Dependency Network not only enables the knowledge and experience of business managers to be applied more coherently to planning the investment, but it also creates a clearer understanding of how different groups need to work together to achieve the benefits they and the organization wish to gain” (Peppard, et al., 2007 p. 20) and of the changes needed to deliver those benefits (Peppard, et al., 2007).
“There’s a clear understanding that benefits only occur from active involvement of business managers in defining and owning those benefits and carrying out the changes that deliver them” (Ward, et al., 2006 p. 356).
21
2.10 The importance of change management
Change management initiatives seem to be understood as valuable to ensure project delivery and overall success. “New technology is not transformational on its own” (…) “appropriate use requires considerable complementary investment in people, processes, culture and support” (…) “some or all of these things are usually missing” (Ward et al., 2006 p. 33, referring to a Report by the iSociety, 2003).
The delivery of the majority of benefits from ICT initiatives is due mainly to the complementary investments an organization makes in changes to the way business is performed and resources are deployed (Ward, et al., 2006, referring to Brynjolfsson and Hitt, 2000).
Lin, et al. (2001) referring to Truax (1997) suggest a number of reasons for organizations not getting the benefits they expected. Amongst them, they point out: (1) The ‘‘right’’ benefits are difficult to identify up front; (2) Organizations often have a limited ability to manage change.
Employee portal projects are complex, time and cost-consuming, with a high risk of failing (Urbach, et al., 2009 referring to Remus, 2006). A recent study from Gartner Research presented at the “2012 Portal, Content and Collaboration Summit”, shows that 40% of portal initiatives fail to get adequate adoption to achieve ROI (Prescient, 2009) and the most frequent causes of partial or total failure is the undervaluation of the organizational aspects in change. In fact, most of the companies manage the implementation project in a purely technical perspective without systematically facing the organizational and the change management requirements (Martinia, et al., 2009).
The Standish Group research shows a staggering 31,1% of projects will be cancelled before they ever get completed. Further results indicate 52,7% of projects will cost 189% of their original estimates (The Standish Group, 2009). And although there is some controversy about the Chaos Report figures (Eveleens, et al., 2010), it also shows the results of survey on ICT executive managers opinion about the reason projects succeed, and according to their opinion the three more relevant are (1) User Involvement; (2) Executive Support; (3) Clear Business Objectives (The Standish Group, 2009).
In a detailed study carried out by McGolpin and Ward about strategic ICT investments, “commitment and involvement of senior management has been identified (…) as a success factor, but although all the projects were commissioned by senior management, only the (…) successful ones had involvement maintained throughout the projects” (Ward, et al., 2006 p. 45, referring McGolpin and Ward, 1997).
This study also found that “the highly successful projects, existing change management processes were used to ensure that the business maximized the value of the ICT investment through associated changes to business practices” (Ward & Daniel, 2006 p. 46, referring McGolpin and Ward, 1997).
22 It’s common understanding among academics and practitioners that adequate change
management and sponsorship is very important to the success of undertaken projects, which generate benefit and generate value to the organization. Although there’s still a high
percentage of project failure which clearly demonstrates that this management techniques and behaviours are not being adopted or correctly implemented.
2.11 Literature review summary
To better understand the subject under study, we reviewed literature related with the importance of intangible assets, employee portals, ICT investment management and the importance of change management. Some of the major evidences found in this review are:
(i) Intangible assets relevance is growing;
(ii) Leadership, teamwork and communication are important ingredients in organizational capital once they provide the ability to adapt, and to make the changes required to execute on the strategy;
(iii) the development of a corporate culture is essential to promote collaboration, sharing knowledge and innovation;
(iv) Strategy maps provides a visual framework to communicate strategy and highlighting how the organization intends to create value;
(v) Intranets and Employee portals are strategic tools;
(vi) Benefits management is an important approach to improve the value realized from specific investments - it is essential to review the benefits that are, and are not, realized from each investment, to increase the value it obtains from all its ICT investments;
(vii) Adequate change management is essential to ensure project delivery and overall success of ICT investments.
We also looked into benefits management and Benefits Dependency Network as a tool to identify Benefits and into Strategy Maps as a tool to communicate company strategy. Finally we developed a theoretical framework – described hereafter – to address some of the limitations we believe strategy maps have:
(i) Strategy maps don’t evidence interrelation between assets, which is important to understand each ones’ contribution and value;
(ii) Strategy maps internal perspective doesn’t consider support processes; (iii) Strategy maps don’t show how internal processes impact assets, what we
believe it’s limitative to understand the processes that create value within an organization;
(iv) They lack of detail on enabling changes, which is essential to identify strategic projects and programs in the organization.
23 The development of a framework to address the limitations of a tool of reference, like strategy maps, is itself a contribution of this thesis, which was validated by blind referee of an international conference (How Employee Portal Contributes for the Intangible Assets Value Creation, 2013).
24
3 Framework
As said previously, Strategy Maps are important frameworks to communicate strategy and to show how intangible assets align with strategy to create value for the organization. However somewhat absent from this framework is the evidence of interrelation between assets, the identification of support processes, the positive impact of internal processes in intangible assets and the identification of strategic enabling changes. Therefore in our view, the model (Strategy Maps) can be complemented and reinforced with these elements
resulting in a stronger framework to help organizations enhancing their strategic knowledge, to reduce the risk of projects failure, and to capture real value from their investments.
3.1 Modifications to Strategy Maps
i. Strategy maps don’t evidence interrelation between assets
There are many academics supporting the resources-based view of the firm where different assets depend on each other to create value – they are interconnected (Marr, et al., 2004). Marr and his colleagues say that “the contribution of one asset, lets say technology, can rarely be expressed independently from other assets, such as skills, expertise, or corporate culture” (Marr, et al., 2004 p. 318).
In Strategy Maps, Intangible assets are presented separated and categorized, they are connected with value-creating processes independently and there’s no connection between them. But they cannot be seen separated from each other and it’s obvious that Human Capital (Skills, Talents, Know-how and Information) often depends on the technology available and it’s hard to imagine Information Capital (Databases, Information Systems, Networks and Infrastructure) existing without the right skills and know-how. Organization Capital (Culture, Leadership, Alignment and Teamwork) influences Human Capital and vice versa (adapted from Marr, et al., 2004 to fit asset structure used in strategy maps). We believe that, even between different Organizational Capital assets, should be dependencies (the right Culture it’s essential to create Leadership, Alignment and Teamwork behaviours). Exploiting asset complementarity allow assets to be used more efficiently strengthening organization’s competitive advantage (Iversen, 2000), (Hughes, et al., 2006). Marr and colleagues believe “that efficient management of organizational assets is impossible
without understanding the interrelationships and interdependencies of such assets” (Marr, et al., 2004 p. 318) and Kaplan et al. (2004) say that intangible assets value derives from their interrelation and cannot be measured independently.
The Value Creation Map, developed by Marr to complement Kaplan and Norton’s original strategy map, identifies both the direct and indirect dependencies of performance as well as
25 differences in importance. Understanding the relative importance of specific assets in the creation of capabilities and value enables better resource-allocation decisions (INSEAD, 2005).
Figure 12: An example value creation map (INSEAD, 2005)
“IT has great enabling capacity for making other organizational resources more easily accessible and shareable. However, to derive competitive benefits from synergy, firms need to create social context and reciprocity inherent in shared practice” (Bharadwaj, 2000 p. 176).
Brynjolfsson and colleagues conclude about their analysis on intangible organizational and ICT assets complementarity that “the market value of a firm that has leveraged computer assets with organizational investments should be substantially greater than that of a similar firm that has not” (Brynjolfsson, et al., 2002 p. 4). Ulrich (2004) also highlights the need to “recognize the interdependence of capabilities. While you need to be focused, it's important to understand that capabilities depend on one another” (Ulrich, et al., 2004 p. 126).
To overcome this limitation in strategy maps, and based on the importance to identify and communicate assets synergies, it is suggested the introduction of the “asset synergies” concept in the proposed theoretical framework (the graphical representation can be seen down bellow in Figure 19).
ii. Internal perspective doesn’t consider support processes
From the literature review, it’s understood that in the internal perspective, strategy maps only identify the most important processes that create desired outcomes for customers and shareholders. There is no focus in support processes (i.e.: Corporate Communication, HR management, Project Management or Quality Management). As an example, Corporate
26 Communication is known as essential to perform adequate change when implementing Corporate Culture (White, et al., 2010).
Organization capabilities like Talent, Speed, Shared mind-set and coherent brand identity, Accountability, Collaboration, Learning, Leadership, Customer connectivity, Strategic unity, Innovation or Efficiency are “the outcome of investments in staffing, training, compensation, communication, and other human resources areas” (Ulrich, et al., 2004 p. 119).
In its Strategic Plan for Knowledge Management, NASA identified culture as one of the critical success factors for knowledge management and they consider that the top management leadership is essential to become an organization that shares knowledge broadly. NASA identifies education and training programs and several knowledge management activities that “will build upon and bridge the existing capabilities and resources to deliver an integrated suite of processes and tools to help share information across the Agency” (NASA, 2002 p. 20).
Figure 13: Critical success factors for knowledge management (NASA, 2002)
Social aspects related to organizational change needed to implement knowledge management processes (Bharadwaj, 2000) are managed in organizations’ support processes.
To overcome this limitation it is suggested the introduction of a “support processes group” in the internal perspective of the proposed theoretical framework (the graphical
27 iii. Strategy maps don’t show how internal processes impact assets
According to Kaplan, et al., value is created in the organization through its managed internal processes and the development of human, information and organizational capital. They group internal processes into 4 main clusters: (1) Operations Management processes, (2) Customer Management processes, (3) Innovation processes and (4) Regulatory and Social processes (Kaplan, et al., 2004).
Figure 14: Value-creating processes in Strategy Maps (Kaplan, et al., 2004)
Ulrich, et al., identify organizational capabilities (collective skills, abilities, and expertise) as relevant intangible assets to the value generation. These capabilities “are the outcome of investments in staffing, training, compensation, communication, and other human resources areas. They represent the ways that people and resources are brought together to
accomplish work” (Ulrich, et al., 2004 p. 119).
Casadeus-Masanell, et al., (2007 p. 5) define business model as “a set of choices and consequences” and identifies intangible assets as consequences and not choices. They also describe virtuous cycles as feedback loops generated by business models dynamics that iterate and strengthen some components of the business model (Casadeus-Masanell, et al., 2007).
28 “Communication influences culture and culture influences communication. The perception of a positive sense of community inside an organization contributes to a positive
organizational culture” (White, et al., 2010 p. 8).
Another example of this kind of feedback regards to organizational change required to perform efficient knowledge management processes. Creating a culture for knowledge management requires changes to Intangible assets like organization structure, information systems and reward structures (Bharadwaj, 2000).
To overcome this limitation it is suggested the introduction of the “virtuous process
feedback” concept in the proposed theoretical framework (the graphical representation can be seen down bellow in Figure 19).
iv. Lack of detail on enabling changes
From the literature review, it’s understood that strategy maps don’t identify the enabling changes (i.e.: training, new working practices, communication) that are performed. “Changes that are prerequisites for achieving the business changes or that are essential to bring the system into effective operation within the organization” (Ward, et al., 2006 p. 109).
Bharadwaj (2000) following Marshal, also highlights the difficulty for Organizations to manage effectively both ICT and social aspects of knowledge management. He states that this “social process requires tremendous organizational Change” and identifies organization structure, control and communication systems and rewards structures as the assets that experience changes. (Bharadwaj, 2000 p. 176).
As seen before, the importance of an adequate change management and sponsorship in order to guarantee the success of undertaken projects is common understanding among academics and practitioners and Strategy Maps don’t answer to this concern.
To overcome this limitation we suggest the introduction of the “enabling changes layer” in the proposed theoretical framework (the graphical representation can be seen down bellow in Figure 19).
3.2 Theoretical Framework
Kaplan and Norton found that it’s important to use visual representations of strategic intent to help understand how organizational resources are used to create value (Kaplan, et al., 2004). After understanding what we perceived as Strategy Map limitations, literature was reviewed regarding other models and frameworks to analyse which and how can they be used to complement Strategy Map.
29 Benefits Dependency Network, Business Model Representations, DeLone and McLean IS success model, Knowledge Assets Map, Organisational Key Resource Map, Success Map, Value Creation Map and Value Network Analysis Diagram were looked (Allee, 2000) (INSEAD, 2005) (Ward, et al., 2006) (Casadeus-Masanell, et al., 2007) (Marr, et al., 2004) (Urbach, et al., 2009).
Most of them follow the creation value flux of cause-effect shown in Soh and Markus’s Model (Soh, et al., 1995).
Figure 15: How IT creates business value (Soh, et al., 1995)
Marshall et al. (2005) proposed a modification to Soh at al. model in order to consider the IT alignment process, showing that IT expenditure is part of strategic imperatives of the organization.
Figure 16: Modified model for business value creation from IT (Marshall et al., 2005)
Benefits Dependency Network and Strategy Map are both tools that expose and depict strategic alignment.
“The BM approaches through the benefits dependency network, draw on a map all the objectives, benefits and changes needed from the business drivers and the path to reach them, setting responsibilities, targets and performance measures” (Gomes, et al., 2012 p. 7). Although its main focus is to determine the changes required for the delivery of each benefit and how will ICT assets enable these changes, it’s believed that this tool could be
30 used with Strategy Map, complementing it and helping to overcome some of the identified limitations.
Bradley (2006) states that “end objectives” are ideal for communicating programme purpose to a wider audience. These objectives provide a solid basis for building Benefits Maps and they are determined from strategy maps “long term objectives” (usually two or three primary or bounding objectives) (Bradley, 2006).
Ward (2006) defines “Investment Objectives” as “Organizational targets for achievement agreed for the investment in relation to the drivers. As a set they are essentially a
description of what the situation should be on completion of the investment” (Ward, et al., 2006 p. 106). These organizational targets can be related with human or organizational capital.
Throughout the reviewed literature, examples of business benefits that consist in the
strengthening of intangible assets were found. The value creation through the strengthening of assets like knowledge, culture, loyalty, image, brand, collaboration, custom orientation is identified as benefits by Allee (2000), Bharadwaj (2000) and Prescient Digital Media (2009). Organization capabilities “are the outcome of investments in staffing, training, compensation, communication, and other human resources areas” (Ulrich, et al., 2004 p. 119).
“Enabling changes layer” consists on the addition of a new layer in Strategy Map
corresponding to the Benefits Dependency Network enabling changes Layer. And “virtuous process feedback” should be addressed by the transposition of the BDN “investment
objectives” layer into the Strategy Map “Intangible Assets” and “Long-term objectives” layers.
31 Figure 18: Framework visual presentation
“Support processes group” consists in the addition of this process group and the usage of Benefits Dependency Network to identify all relationships. “Asset Synergies” consist on visual representation of the direct dependencies and interrelation between assets.