Contents lists available atScienceDirect
International Journal of Disaster Risk Reduction
journal homepage:www.elsevier.com/locate/ijdrrComparing
flood mortality in Portugal and Greece (Western and Eastern
Mediterranean)
S. Pereira
a,⁎, M. Diakakis
b, G. Deligiannakis
c, J.L. Zêzere
aaCentre for Geographical Studies, Institute of Geography and Spatial Planning, Universidade de Lisboa, 1600-276 Lisboa, Portugal
bFaculty of Geology and Geoenvironment, School of Sciences, National & Kapodistrian University of Athens, Panepistimioupoli Zografou, 15784 Athens, Greece cMineralogy– Geology Laboratory, Department of Natural Resources Management and Agricultural Engineering, Agricultural University of Athens, 11855 Athens, Greece
A R T I C L E I N F O
Keywords: Flood mortality Individual risk Societal risk Portugal GreeceA B S T R A C T
For thefirst time flood mortality is analysed and compared between a Western (Portugal) and an Eastern Mediterranean country (Greece). Flood fatalities are examined and compared in terms of frequency, temporal evolution, spatial distribution, deadliestflood types, gender of the victims, circumstances surrounding fatalities, and individual and societal risk.
A commonflood fatalities database was formed for the period 1960–2010 by merging the DISASTER database for Portugal and the Greek database
Individualflood cases generated more deaths in Greece than in Portugal (excluding an outlier flash flood event in the latter). Despite somefluctuations evidence of a gradual decrease in fatality numbers were recorded for both countries. Since the 1980's the number offlood cases with multiple fatalities has been gradually declining, due to changes in qualitative characteristics of mortality. Flood fatalities predominantly occur during autumn in Greece and during winter in Portugal.
In both Greece and Portugalflash floods were responsible for more than 80% of the total mortality. The main metropolitan areas of each country were found to be hotspots offlood mortality; a trend connected, with the higher population density along the coastal areas combined with the expansion of urban fabric towards flood-prone areas.
Gender distribution of fatalities indicates that males are more vulnerable in both countries. The circumstances surrounding fatalities showed that fatalities occurring inside buildings have been gradually reducing in time, while vehicle-related deaths have been rising, showing that individuals hold an active role when they voluntarily enter infloodwaters during a flood.
1. Introduction
Flooding has been one of the most destructive natural hazards in the Mediterranean region, causing significant damages [1] and a note-worthy number of fatalities across Southern European countries on a yearly basis[2–6].
Flooding in the Mediterranean region can be mostly related to riverine flooding events in major rivers occurring mostly during autumn and winter months[6,7]as well asflash floods that typically occur during autumn in small watersheds and urban areas triggered by high-intensity rainfall [8–10]. Flashfloods are responsible for impor-tant human losses[6,8], as they are characterized by rapid increase in flood discharge and short warning times. Moreover, within the context of climate change and the expected increase in extreme precipitation events in the Mediterranean[11–13], risk exposure to human life in the
region may increase even further.
There is a wide body of literature analysing the effects of flooding to human health [14,15] and particularly regarding direct mortality, examining risk factors concerning the victims and the environmental circumstances offlood-related accidents[16–23]. Comparative studies on mortality are difficult to perform due to the lack of common flood mortality databases, common terminology, risk factors analysed and common sources of mortality data [24]. For instance features on fatalities caused byfloods can be found in natural hazard databases (e.g. EM-DAT, SICI, DISASTER) based on documentary sources [9,24–26], demographic statistics, death certificates from hospitals, civil protection authorities and non-governmental agencies.
In the case of natural hazards databases there are some constraints related with the inclusion criteria of mortality data. For instance, the Emergency Events Database (EM-DAT) only records natural disasters
http://dx.doi.org/10.1016/j.ijdrr.2017.03.007
Received 24 October 2016; Received in revised form 16 March 2017; Accepted 18 March 2017
⁎Corresponding author.
E-mail address:[email protected](S. Pereira).
Available online 21 March 2017
2212-4209/ © 2017 Elsevier Ltd. All rights reserved.
that have caused at least 10 fatalities while national databases usually include flood occurrences that caused fatalities regardless of their number [25–28]. Global databases such as EM-DAT and the Natural Hazards Assessment Network (NATHAN) of the Munich Re are useful to identify catastrophic events, but must be carefully used when regional or local studies are developed because great part of the recorded events, for instance in the Mediterranean countries, are not included [29]. Documentary sources have been used before to complete and improve flood catalogues. The use of archives (e.g. press) as data source to collect mortality data usually creates some limitations about data reliability, which are well described in the relevant literature [30]. Despite these concerns, databases on natural hazards can improve data quality and completeness for the study of mortality in terms of temporal trends, spatial distribution, detailed descriptions and epidemiological characteristics.
Nevertheless, there is limited literature or initiatives on interna-tional reliable datasets in thefield of floods[31]or in direct comparison of findings between national mortality studies, especially in the Mediterranean [28,32–34]. In the region, efforts have been made to create a common database onfloods and on its societal impacts in the framework of the HYMEX project[28]. The HYMEX project database gathered flood data, including the number of casualties and circum-stances related with the deaths, from four representative regions of the NW sector of the Mediterranean: Catalonia, Balearic Islands (Spain); Calabria (Italy); and Languedoc-Roussillon, Midi-Pyrénées and Prov-ence-Alpes-Côte d′Azur (France)[28]. In addition,flash flood mortality in southern France was already explored [35,36] in the period 1988–2013 by analysing the demographics of victims (i.e. age, gender), the circumstances of fatal incidents, risk behaviours, as well as seasonal and spatial distribution of fatalities.
A holistic understanding of the way people become victims offlood phenomena could benefit from data aggregation across larger areas and comparisons between different countries [7]. That is because the impact of different practices and policies on protection from floods can be assessed only when a comparative approach and national programs to prevent flood fatalities are implemented. Moreover, differences or similarities in accident circumstances can lead to useful conclusions regarding particular influential factors such as the local climate, land use or risk exposure behaviours.
In this context, a comparison between two countries with a temperate Mediterranean climate located at the two edges of the Mediterranean would be useful in providing a more holistic under-standing of the conditions offlood fatalities in the region, complement-ing the existcomplement-ing regional studies.
This work aims to explore and compare the most basic character-istics offlood mortality between a Western (Portugal) and an Eastern Mediterranean country (Greece), to identify and discuss similarities and to improve our understanding on the conditions under which flood fatalities happen in the region. The study explores and compares: (i) the frequency of fatalities; (ii) their temporal evolution (annual, seasonal and monthly distribution); (iii) their spatial distribution; (iv) the deadliestflood types; (v) the gender of victims; (vi) the circumstances surrounding fatalities; and (vii) the individual and societal risk. 2. Data and methods
2.1. Data collection
For the purposes of this study, aflood case is defined as a unique flood occurrence that, independently of the number of affected people, caused harmful consequences (e.g. casualties, injuries, missing, evac-uated, or homeless people), and is related to a unique geographic location (overflowing of a river in a single basin) and a specific period of time. Therefore a singleflood event can affect several catchments and generate severalflood cases. Flood fatal incident is defined as an accident that occurred during theflood case that leads to the death of
people in the same geographic location.
For Greece, primary data onflood cases were based on the Flood Database developed for the period between 1880 and 2010[27]. This catalogue contains data on the exact location, number of fatalities as well as the date of each event and was used as the basic record upon which additional information was aggregated. Scientific papers[37,38] and press articles based on police reports, stored in national newspaper databases such as the Digital Newspapers Collection of the Greek National Library and the Greek National Newspapers Archive of the Library of the Hellenic Parliament, were systematically searched for flood reports using related keywords and were used to obtain details about the victims and the explicit descriptions of each fatal incident. In total, 235 press articles were analysed, published in 12 national newspapers. Analysis of the flood fatalities under different aspects was published in previous works [5,39,40]. Flood mortality data is considered complete for the period 1960 onwards.
In Portugal, mortality patterns of disastrousfloods that occurred in the last 150 years were recently explored at national scale[6]. Flood cases that caused societal impacts (fatalities, injuries, missing people, evacuated and homeless people) independently of their number, were collected and formed the DISASTER database for the period of 1865–2010[26]. The DISASTER database is the only database contain-ing detailed data on the societal impacts of hydro-geomorphologic disasters (floods and landslides) in the country. A set of 11 newspapers (3 daily national newspapers and 8 weekly regional and local news-papers) was systematically surveyed in a day by day basis for data collection for the period 1865–2010 in order to find flood cases. Further details on data collection process can be found in previous works [6,26]. Eachflood case includes details on the disaster characteristics and damages[26]. Thefirst includes data on type (flood or landslide), subtype, date of occurrence, location, and triggering factor. The second includes structural damages (in buildings and road or railroad net-works) and societal consequences (human damage, gender of fatalities, and circumstances surrounding the fatalities). The DISASTER database is considered complete for the period 1936 onwards.
Both Greek and Portuguese databases include all deaths that were immediately and directly attributable to aflood case. Long-term health effects and casualties caused by flood disasters are not examined in this work due to lack of available data.
This study analyses mortality in the period 1960–2010, within which the overlapping record is considered complete and reliable for both Portugal and Greece.
2.2. Methodology
A commonflood fatalities database was formed by merging the two existing databases of Portugal and Greece. Each entry of the database, corresponding to a fatal incident with several attributes provides a detailed description including:
•
the ID number of theflood case;•
the flood type (riverine flood, flash flood, urban flood, or not defined type);•
the date of the fatal incident (day-month-year);•
the location of theflood case (x and y coordinates)•
the number of fatalities;•
the gender of the victim (male, female, or gender not reported);•
the surrounding environment where the flood fatal incidentoc-curred (i.e. outdoors on foot, outdoors inside a vehicle, or inside a building).
Flood type identification was based on the newspapers reports. Flashfloods identification was obtained from reports describing short duration and intense precipitation events (normally less than 24 h) that affected small river catchments and with low concentration times. In some cases, rainfall data was consulted to elucidate doubts about the
rainfall event. Riverine floods occurred in large rivers with large drainage basins and were triggered by rainfall periods lasted for days or even months. Urbanfloods are floods occurred in urban areas, except flash floods and riverine floods.
National individual risk was evaluated using mortality rates for floods, which were calculated based on years with population census in each country, i.e., normally every 10 years, as the population census in Portugal and Greece was carried out in the same years. The annual mortality rates were computed for each decade using the annual average of fatalities, which were then divided by the annual average population. The result was multiplied by 100,000 in order to scale it according to the size of the county's population per unit time[6]. In spatial terms, flood mortality rates were also computed for each municipality of Greece and Portugal using the total number of fatalities per municipality for the period 1960–2010, which were then divided by the resident population of each municipality in 2011 (in both countries the last population census dates from 2011). The result was multiplied per 10,000 to scale it according to the size of resident population at municipal level.
Societal risk was evaluated by plotting the annual frequency offlood cases that generated fatalities in both countries using curves of frequency against consequences (F-N curves)[41].
Portugal registered an outlierflash flood event in 25–26 November 1967 that lead to 5 times more mortality than the total mortality of other flood events registered in period 1960–2010. Greece has no equivalent catastrophic floods. In order to not bias the comparative analysis, the mortality of this extreme event is analysed separately in Section 3.8 and all comparisons between the two countries do not include this outlier.
3. Results
3.1. Frequency offlood fatalities
Comparison showed that the number offlood cases registered in the period 1960–2010 is higher in Portugal than in Greece (737 and 498 flood cases respectively), with the ones recording fatalities being 1.4 times higher (Table 1). Excluding the 1967flash flood outlier, the total number of fatalities was higher in Greece that recorded 189 fatalities in 57flood cases, while Portugal recorded 114 flood fatalities in 80 flood cases in the period 1960–2010.
On average, Portugal registered a higher number of averagefloods per year in comparison with Greece (14.5 and 9.8, respectively), but in Greece the average number of flood fatalities per year is higher (2.2 against 3.7, respectively) (Table 1).
The ratio of fatalities per number offlood cases and the ratio of fatalities per number of flood cases that generated fatalities was computed for the whole period (1960–2010) (Table 1) and on a decadal basis. In Greece, both ratios were found more than two times higher than in Portugal (Table 1), when the whole period is considered.
Fig. 1shows the number of fatalities registered in eachflood case in descending order (y axis) against its rank among the others, from the highest (rank 1) to the lowest (rank n) (x axis), represented using a log-log scale. Rank 1 corresponds to the maximum number of fatalities registered in aflood case, which is 33 for Greece and 5 for Portugal (excluding theflash flood of November 1967). The relationships are almost linear on the plot, which indicates a power law distribution. The number of fatalities of eachflood case is higher for Greece than for Portugal up to rank 13 (1 fatality per case), indicating that overall individualflood cases generate more deaths in Greece.
3.2. Temporal evolution of mortality 3.2.1. Annual
Comparison of the annual distribution offlood fatalities in Greece and Portugal for 1960–2010 is presented inFig. 2. During this period, the number of fatalities in both countries is not regularly distributed showing clusters with more than 10 fatalities in various years (e.g. Portugal: 1960, 1963, 1967, 1983, 1997; Greece: 1961, 1977, 1990 and 1994). The second deadliest year in Portugal was 1983 (18 fatalities) associated with another flash flood that occurred in the Lisbon metropolitan area[6]. In Greece, 1977 and 1961 flash floods stand out from the annual distribution (44 and 33 fatalities, respectively) [42]. Analysis of the temporal evolution offlood fatalities shows that there is no statistical significance on both trends (Fig. 2).
The ratios offlood fatalities per number of flood cases (Fig. 3a) and ratios of fatalities per number offlood cases that caused at least one death (Fig. 3b) were computed by decades for both countries. Exam-ination of the evolution of the former ratio per decade (Fig. 3a) showed that Portugal and Greece begin from a slightly different start, but since the 1980s the ratio declines in both countries and reaches approxi-mately 0.10 in the decade 2001–2010. Examination of the second ratio per decade (fatalities perflood case with at least 1 death) (Fig. 3b) showed a strong downtrend in Greece. Portugal's ratio value remained always lower than the Greek's ratio. The values of both ratios calculated for Portugal and Greece are very similar in the last decade (2001–2010), indicating that in both countries, the number of flood cases with multiple fatalities has been gradually decreasing.
3.2.2. Monthly and seasonal
Monthly mortality of each country was compared with the mean monthly rainfall of Athens (1961–1990) and Lisbon (1971–2000) as indicative of the monthly rainfall regime in both countries (Fig. 4). Table 1
Comparison offlood mortality statistics for the period 1960–2010.
Greece Portugal
Number offlood events 303 55a
Number offlood cases 498 737 (804)
Number offlood cases with fatalities 57 80 (123)
Number of fatalities 189 114 (636)
Flood cases/year 9.8 14.5 (15.8)
Flood fatalities/year 3.7 2.2 (12.5)
Ratio of fatalities per number offlood cases 0.4 0.2 (0.8) Ratio of fatalities per number offlood cases with fatalities 3.3 1.4 (5.2) Note: In Portugal, numbers in brackets include the November 1967flash flood.
aFlood events in Portugal only consider the cases that caused societal damages
(fatalities, injured, missing, evacuated and displaced people) that are included in the Disaster database.
Rainfall data for Athens was collected from the Hellenic National Meteorological Service[43], whereas the rainfall data for Lisbon was collected from the Portuguese National Meteorological Service[44].
Monthly distribution offlood fatalities (Fig. 4a), for the period of 1960–2010, shows that flood fatalities were more frequent from November to February in both countries when the highest values of mean monthly rainfall are recorded in Athens and Lisbon. In both countries November records a peak of mortality, even excluding the 1967 flash flood event in Portugal (48.1% and 28.9%, respectively), whereas the peak of mean monthly rainfall is registered a month later (66.6 mm in Athens and 121.8 mm in Lisbon). In Greece, multiple-fatality events of mortality were also recorded in November in 1961 and 1977. The peak offlood mortality registered in November in both countries is coincident with the results of the MEDEX project performed with high-impact floods and flash floods in Mediterranean countries [45]. The MEDEX project presents a secondary peak in September, which has no correspondence with the results of this study.
Seasonal distribution of flood fatalities occurred predominantly during autumn and winter (Fig. 4b), but winter-autumn percentages offlood fatalities show differences in the two countries. In Greece there is a peak onflood fatalities in autumn (68.6%), whereas in Portugal the higher percentage was recorded during the winter (45.6%).
In Portugal fatal flash floods and urban flooding have been predominantly registered during autumn (Fig. 4b), usually as a result of very intense and short-duration rainfall events[10,26,46]. On the other hand,floods in the large fluvial valleys of the country (e.g. Tagus, Douro and Mondego) usually occurred during the winter, contributing to this seasonal mortality peak. In Greece, flash floods also mainly occurred in autumn, following the seasonality of high-intensity storms, whereas riverinefloods mainly occurred in the winter and early spring as a result of snowmelt and long duration rainfall events[7].
3.3. Spatial distribution offlood mortality
In Greece, approximately 50% of the country's population resides in the Greater Athens metropolitan area and its suburbs (region of Attica) (Fig. 5a). Highest numbers of fatalities are clustered in this area, while smaller concentrations of number of deaths occurred in other urban areas, such as Thessaloniki and Pyrgos. However, an important percentage of fatalities were registered in rural regions. Higher concentrations offlood mortality are observed mostly in the lowlands along the coastal areas, whereas the mountainous areas of the central axis of the country record very few cases. The maximum concentration offlood mortality in lowlands near the coast is justified by two reasons: (i) the population density is higher in these areas, especially in Athens metropolitan area and Thessaloniki; and (ii) the presence offlood prone areas with very highflood hazard[47,48].
In Portugal flood fatalities occurred throughout the country (Fig. 5b) highlighting an important cluster in the Great Lisbon Area and Tagus valley. The Great Lisbon Area includes 21.2% of the Portuguese population and some of the most densely populated municipalities of the country. This area is highly impermeable due to urbanization [49] and presents small hydrographic basins highly susceptible to flash-floods. In addition, the Tagus valley is prone to riverinefloods. Secondary locations of flood mortality are found in the cities of Oporto and Coimbra, where large rivers are located (Douro and Mondego rivers, respectively) and population has been more exposed to riverinefloods.
Flood mortality rate per municipalities (Fig. 6a, b) shows a different spatial pattern in comparison with the number of fatalities. In Greece, the City of Athens registered the highest number offlood fatalities (74) for the period 1960–2010, but does not present the highest mortality rate in comparison with its population (467,160 inhabitants in 2011 census). The municipality of Gortynia registered the highest mortality Fig. 2. Annual evolution of the number offlood fatalities in Portugal and Greece (1960–2010).
Fig. 4. Monthly (a) and seasonal (b) distribution of the percentage offlood fatalities (1960–2010) in Greece and Portugal. The mean monthly rainfall in Athens (1961–1990) and Lisbon (1971–2000) is showed as indicative of the monthly rainfall regime in both countries.
rate in the country when normalized with the local population (3.9 flood fatalities per 10,000 inhabitants) (Fig. 6a).
In Portugal the highestflood mortality rate was registered in the municipality of Ourique (9.3flood fatalities per 10,000 inhabitants), which is a municipality characterized by a very low population density (< 10 inhabitants per km2) (Fig. 6b). The municipalities with the
highest number of fatalities are located in the Lisbon metropolitan area (Sintra and Mafra), registering higher population densities (2105 and 263 inhabitants per km2, respectively in 2011 census) but flood
mortality rates are below 1 fatality per 10,000 inhabitants. 3.4. Mortality according toflood types
Flood type examination shows that in Greeceflash floods have been responsible for 82% of the total mortality while in Portugal, the same value reaches 38.6% (87.9% when theflash flood of 1967 is included) (Fig. 7). Riverinefloods were responsible for only 9% of the total flood fatalities in Greece and 36.8% in Portugal (6.6% including the 1967 event) that normally occur in larger hydrographic basins and are associated with long lasting rainfall periods (several consecutive days
or weeks).
In Portugalflash floods mainly occur in small watersheds or in urban areas while the riverinefloods usually occur at a larger scale in the hydrographic basins of the major rivers (e.g. Tagus, Douro, Minho, Mondego and Guadiana). In the case of Greece, the central and the south part, including the islands, are dominated by small basins where flash floods occur. Riverine floods are more frequent in the north, where large basins drain from Bulgaria and FYROM.
Fig. 8shows the percentage of total fatalities per decade andflood type. In Greeceflash floods were the dominant flood type that caused fatalities in all decades. In Portugal riverinefloods that occurred along the two major Portuguese rivers (Tagus and Douro) were responsible for the majority of fatalities in thefirst two decades (1960–1970 and 1971–1980), whereas flash floods caused the highest percentage of fatalities in the following decades.
3.5. Gender differences in mortality
Forflood cases where the gender of the victim is known, it is clear that in both countriesfloods have been caused more male victims, as the number of documented male fatalities is more than twice the number of female fatalities. These results are consistent with previous observations on mortality associated with floods worldwide [6,17–19,40,50,51].
The frequency offlood fatalities per gender and per decade in the period 1960–2010 is shown in Fig. 9. The temporal distribution of fatalities by gender shows again the abovementioned predominance of male fatalities in both countries, which registered a similar average ratio of male against female fatalities (1.8 and 1.6 for Greece and Portugal, respectively) per decade. The percentage of male fatalities was above 50% in four decades in both countries. Female fatalities recorded a higher percentage than male fatalities by a small margin, during a single decade (1960–1970) in Greece.
Databases sources did not provide information on gender for 11.4% of flood fatalities in Portugal (excluding the November 1967 flash Fig. 6. Flood mortality rate per 10,000 inhabitants and municipality in Greece (a) and Portugal (b).
flood) and 7.4% in Greece. 3.6. Surrounding environments
Analysis of the surrounding environment where fatal incidents occurred showed significant differences between Portugal and Greece. In the case of Portugal, the highest percentage of fatalities was registered on foot outdoors (66.7%), followed by indoor (19.3%) and finally vehicle-related incidents (14%), not considering the November 1967flash flood. On contrary, in Greece a large percentage of victims caught by floods were using vehicles (44.2% of total fatalities), followed by victims on foot (outdoors) (40.3%), and victims inside buildings (indoors) which recorded the lowest percentage (15.5%).
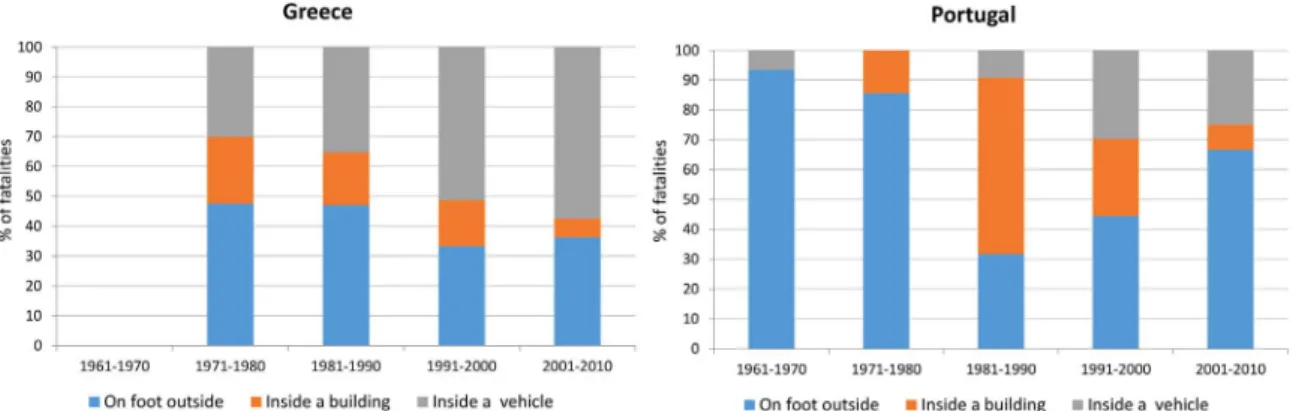
The distribution of fatalities according to the surroundings at the time of each fatal incident per decade is shown inFig. 10. In Greece, fatalities that occurred inside a vehicle, increased in the last decades, from 30% to 57.6% of total fatalities, while fatalities occurred inside a building decreased from 22.5% to 6%. In Portugal fatalities that occurred outdoors on foot and inside a vehicle, increased in the last three decades and correspond to 66.7% and 25% of total fatalities in 2001–2010, respectively. For the same period fatalities that occurred inside buildings decreased by 86.7%.
3.7. Individual and societal risk
Population of Greece and Portugal increased from 8.7×10⁶ and 8.1×10⁶inhabitants in the 60´s to 10.8×10⁶and 10.0×10⁶
inhabi-tants in thefirst decade of the XXI century, respectively. In the same period, mean annual mortality due tofloods, expressed as the ratio of the number offlood fatalities per 105inhabitants decreased from 0.072 and 0.066 in the 1960´s to 0.025 and 0.011 in the 2000's in Greece and Portugal, respectively (Fig. 11).
The mean annualflood mortality rate for the period 1961–2010 was found higher in Greece than in Portugal (0.042 against 0.026, respectively) (Fig. 11). In addition, the mean annualflood mortality rate was higher in Greece in all decades, except in 1982–1991. Portugal registered the lowest value of mean mortality rates in the decade 1972–1981 (0.007 per 105inhabitants). Flood mortality rates started
from the absolute maximum value for both countries in the decade 1961–1971. Since then, despite the fluctuations, an overall decline of flood fatalities per 105 inhabitants was registered in both countries
(Fig. 11).
Fig. 12 shows the curves of frequency against consequences in Portugal and Greece for fatalfloods occurred in the period 1960–2010. F-N curves forfloods that caused deaths in Portugal were previously described and compared with similar curves obtained for other countries[6,26]. In Portugal, when the 1967flash flood is considered, the probability offloods with fatalities is consistently higher than in Greece by 5 or more fatalities per year. But when this outlier event is removed from the analysis the trend line of the two countries is coincident from 1 to 18 fatalities per year. In both countries the annual frequency of 1 fatality is near 1.0 E-0.0 and the highest annual number of fatalities (44) was registered in Greece with an annual frequency of 1.0 E-0.18.
The Societal Risk Acceptance Criteria (adapted from Hong Kong Department [52]) were also plotted in Fig. 12 for comparison. The acceptability of societal risk is judged against the frequency and number of fatalities (F-N plot). Two F-N risk lines are used to determine the `acceptable' and `unacceptable' societal risks [53]. The risk level between these two limits is called as‘tolerable region’ and requires that all practicable and cost-effective measures should be taken to reduce risk to a level that is‘as low as reasonably practicable’, that is known as ALARP [53]. According to the Societal Risk Acceptance Criteria [53,54], the societal risk of floods in both countries is considered unacceptable (Fig. 12).
3.8. November 1967flash flood (Portugal)
According to the Disaster database the deadliest flood affecting Portugal since, at least, the 19th century, occurred on the 25 and 26 November 1967. This catastrophic flash flood affected the Lisbon metropolitan area and, according to the newspapers news, 522 fatalities were counted[8]. The numbers of fatalities of this specific flood event are possibly underestimated because censorship imposed by the dicta-torial regime of the time in Portugal, may have prevented the disclosure of a higher number of fatalities[55].
Fig. 8. Percentage of total fatalities per decade andflood type (1960–2010) in Greece and Portugal.
This singleflood event registered 43 flood cases with fatalities (5.2 ratio of fatalities per number offlood cases with fatalities) (Table 1), which comprises 82% of the totalflood mortality registered in Portugal for the period 1960–2010. The maximum number of fatalities registered in aflood case in Portugal occurred in a rural area, in the small village of Quintas in the Vila Franca de Xira municipality (115 fatalities)[8]. The spatial distribution of fatalities per municipalities shows the storm's track (SW-NE) (Fig. 13). This episode was previously character-ized with the presence of a strong convection at the regional scale associated with a low pressure system centred near Lisbon, favouring the convective instability [8]. Vila Franca de Xira, Odivelas and Alenquer municipalities registered the highest death toll as the local community lived in flood prone zones (flood plains) and in poor housing conditions[8].
During theflash flood of November 1967 the gender of the victims was not reported in 70% of theflood fatal incidents because gender of the victims was not considered so relevant to be cited by newspapers in such a catastrophic situation, where the most important was reporting the damages. Reported victim's gender of this outlier event show a similar distribution between male-female mortality, contrary to what is observed for the same decade (1960–1970), excluding this outlier event, where there is a male dominance (76.1% of total fatalities). Also the number of victims with gender not reported is 4 times higher than the average value recorded for the complete number of flood events without this outlier event.
According to previous studies[8], almost the total number of deaths occurred at night during the peak of theflood (between 2230UTC and 0230UTC) and caught people inside buildings, increasing the indoors fatalities to 82.2% the total fatalities of the decade 1960–1970. However, if this event is excluded from analysis, then outdoor fatalities in Portugal record the highest percentage (66.7%) for the same decade. 4. Discussion
Overall, comparison showed significant similarities between the two countries regardingflood mortality, including the decreasing trends in temporal evolution, the ratios of deaths perflood case, the mortality rates, the dominance of flash flood cases, the prevalence of male victims, the societal risk, and the increase in vehicle-related fatalities. It showed also differences regarding the surrounding environment of fatalities, the number of deaths perflood and their seasonality.
In detail, individualflood cases generate more deaths in Greece than in Portugal (excluding the outlier event of 1967). Moreover, evidence of flood fatalities decreasing in both countries was shown, despite some mortality spots irregularly distributed over time.
The high percentages of autumn and winterflood fatalities in both countries are attributed to the higher number of days of extreme rainfall during these seasons, identified in the Iberian Peninsula[56–59]and in Greece[60,61].
Regarding the differences in seasonality, they are linked to the monthly, seasonal and interannual variability of precipitation across the Mediterranean region[7,62,63]. In detail, the southern part of the Mediterranean is largely influenced by a descending branch of the Hadley cell, a subtropical atmospheric circulation; whereas the north-ern part is affected to a greater extent by the North Atlantic Oscillation (NAO) and other mid-latitude teleconnection patterns[64].
Greece in the SE part is influenced by local weather systems of the Levant area, such as the Cyprus Low [65] that lead to a strong seasonality of rainfall with few days of extreme precipitation in the summer, a trend reflected in rainfall seasonality data[64,66,67], with higher intensities recording during fall, followed by winter[58]. On the other hand, precipitation over Portugal is mostly affected by NAO, that when it is in negative phase is associated with wetter conditions and higher atmospheric instability [68]. Extreme precipitation events Fig. 10. Percentage of fatalities according to the surroundings at the time of incident per decade.
Fig. 11. Mean annual mortality rates per time period adjusted to population census in Greece and Portugal.
Fig. 12. Frequency versus consequences forflood fatalities in Portugal and Greece for the period 1960–2010 and Societal Risk Acceptance Criteria.
influenced by NAO are more prone to occur during winter months[68], although, NAO does not explain the complete precipitation variability observed on the Iberia Peninsula. In Portugal, precipitation is more prone to occur under Cyclonic, Southwest and West circulation weather types, while Anticyclonic, Northwest and North circulation weather types are associated with variable humidity conditions[68]. Based on the previous trends, higher percentages of autumn fatal floods are expected towards the southeast of the Mediterranean region. On the contrary, a more balanced seasonal distribution between autumn and winter fatalfloods is expected in the north-western part, following the local seasonality offlood occurrence[7].
As far as the spatial distribution of fatalities is concerned, the study shows that both countries haveflood-prone areas due to their geomor-phological, hydrological and climatic conditions. However, large urban areas have been recording a clustering of deaths and especially of multiple-fatality events. This is attributed to the higher concentrations of population that leads to a higher exposure of human lives toflood risk. The absence of multiple-fatality floods outside urban areas is evidence to the above argument. The multiple-fatality events in both countries (Fig. 5) could be an indication that steps have been taken to decrease vulnerability in urban environments, possibly by improving infrastructure, buildings or early warning processes (documented in Greece[39]and in Portugal[6]).
In both countries the majority of deaths are attributed toflash flood events and in both cases the main metropolitan areas of each country (Athens and Lisbon) correspond to a hotspot on mortality (Fig. 5), which is certainly connected with the higher population density along the coastal areas combined with the presence offlood-prone areas in both countries.
Studying the surrounding environments of victims at the time of the fatal incident, two common distinct trends are evident. Firstly, indoor fatalities percentages have been gradually reducing in both countries.
This trend can be attributed to the gradual improvement of buildings’ structural integrity that has been already documented in Greece[39] and in Portugal[6]and also could be related with land use manage-ment measures taken to reduceflood risk (e.g. legislation, hydraulic works, watercourses channel regularization), although specific evi-dence are not presently available. Secondly, the vehicle-related deaths show a rising trend in percentage, ascribed to the increase in the use of cars [39]. The high percentage of vehicle-related flood deaths is acknowledged in studies within and outside the European continent [18,69]. An increase of outdoor fatalities is present in both countries, although in Portugal deaths of individual on-foot have been raising more than in Greece in recent decades.
Outdoor fatalities (on foot or inside a vehicle) indicates that people hold an active rather than a passive stance in the face of risk, as they voluntarily enter infloodwater due to different possible reasons[51]: a) attempting to reach a destination, usually home or work; b) retrieving property, livestock or pets; c) performing labour duties; d) rescuing or assisting with evacuation.
In both countries flood victims are mostly males, showing that males are more exposed to fatal floods. Gender is an individual vulnerability factor that controls the access to opportunities and exposure to risks[6]. Gender differences in natural hazards can be expected to occur where there are gender differences in social roles that result in exposure to different environments [70]. Male mortality dominance associated with floods has been widely referred in the literature specially in developed countries [17,18,51]. These gender differences can be explained by cultural reasons, that expose men to hazardous occupations (e.g. work in emergency services) or risk behaviours (e.g., driving a car inflooded roads, cross bridges in flood situations) because drivers often underestimate the force of theflowing water[6,19].
5. Conclusions
In general, fatality numbers and mortality rates decline indicates that both countries have managed to protect their citizens more efficiently over the studied period. Results show that multiple-fatality flood events have decreased, giving their place to more flood events with fewer casualties. The difference in the two trends alone indicates that protection of human life has been improved asflood events are shown to be less lethal. This improvement is attributed to steps taken throughout the study period from both societies regarding civil protec-tion practices, infrastructure (especially buildings) and land use man-agement shown in previous works[39].
Victims are found to hold an active role towards risk, as they are recorded voluntarily choose to enter infloodwaters. Although specific data are not available, possible explanations include: wrong risk perceptions, underestimation of risk of flooding or of the physical parameters of flow (i.e. depth, velocity) or due to social influences, following others actions and social pressures.
The common trends in both countries provide significant indications that vehicle-related deaths are rising and therefore it is reasonable to expect a further increase of this type of fatalities in the future. Taking into account this information, civil protection authorities should be concerned for roadflood safety features (especially in Greece where the increasing trend is stronger) and improve safety standards and informa-tion campaigns. In addiinforma-tion, the findings about the surrounding environment of deaths caused byfloods are relevant to public policy on civil protection and to develop education programs within flood safety awareness education.
This study showed that comparison of the two countries has the potential to act as a useful tool to verify temporal trends in the qualitative characteristics of fatalities (e.g. male victims predominance) and to evaluate the performance of policies (e.g. improvement of infrastructure) in each society. In addition, it can provide a more complete image offlood mortality with a higher potential for correla-tion with different factors, as for instance with the seasonality of high intensity storms in two different parts of the Mediterranean region. For the above reasons, the study also highlights the need for a common and standardized database forflood fatalities in the region.
Acknowledgments
This work wasfinanced by national funds through FCT – Portuguese Foundation for Science and Technology, I.P., under the framework of the project FORLAND - Hydro-geomorphologic risk in Portugal: driving forces and application for land use planning (PTDC/ATPGEO/1660/ 2014).
References
[1] J.I. Barredo, Majorflood disasters in Europe: 1950–2005, Nat. Hazards 42 (2007) 125–148,http://dx.doi.org/10.1007/s11069-006-9065-2.
[2] F. Guzzetti, C.P. Stark, P. Salvati, Evaluation offlood and landslide risk to the population of Italy, Environ. Manag. 36 (2005) 15–36,http://dx.doi.org/10.1007/ s00267-003-0257-1.
[3] A. Haines, R.S. Kovats, D. Campbell-Lendrum, C. Corvalan, Climate change and human health: impacts, vulnerability and public health, Public Health 120 (2006) 585–596,http://dx.doi.org/10.1016/j.puhe.2006.01.002.
[4] I. Ruin, J.-D. Creutin, S. Anquetin, C. Lutoff, Human exposure to flash floods – relation betweenflood parameters and human vulnerability during a storm of September 2002 in Southern France, J. Hydrol. 361 (2008) 199–213,http://dx.doi. org/10.1016/j.jhydrol.2008.07.044.
[5] M. Diakakis, G. Deligiannakis, Flood fatalities in Greece: 1970–2010, J. Flood Risk Manag. (2015),http://dx.doi.org/10.1111/jfr3.12166.
[6] S. Pereira, J.L. Zêzere, I. Quaresma, P.P. Santos, M. Santos, Mortality patterns of Hydro-Geomorphologic disasters, Risk Anal. 36 (2016) 1188–1210,http://dx.doi. org/10.1111/risa.12516.
[7] M. Diakakis, Flood seasonality in Greece and its comparison to seasonal distribution offlooding in selected areas across southern Europe, J. Flood Risk Manag. (2014),
http://dx.doi.org/10.1111/jfr3.12139.
[8] R.M. Trigo, C. Ramos, S.S. Pereira, A.M. Ramos, J.L. Zêzere, M.L.M.L.R. Liberato, The deadliest storm of the 20th century striking Portugal;flood impacts and
atmospheric circulation, J. Hydrol. 541 (2016) 597–610,http://dx.doi.org/10. 1016/j.jhydrol.2015.10.036.
[9] M.C. Llasat, M. Llasat-Botija, M. Barnolas, L. López, V. Altava-Ortiz, An analysis of the evolution of hydrometeorological extremes in newspapers: the case of Catalonia, 1982–2006, Nat. Hazards Earth Syst. Sci. 9 (2009) 1201–1212,http:// dx.doi.org/10.5194/nhess-9-1201-2009.
[10] E. Gaume, M. Borga, M.C. Llasat, S. Maouche, M. Lang, M. Diakakis, Mediterranean extremefloods and flash floods. Into Hydro-meteorological extremes, in: Mediterr. Reg. under Clim. Chang. A Sci. Updat., IRD Éditio, AllEnvi, Marseille, 2016: pp. 133–144.
[11] L. Alfieri, P. Burek, L. Feyen, G. Forzieri, Global warming increases the frequency of riverfloods in Europe, Hydrol. Earth Syst. Sci. 19 (2015) 2247–2260,http://dx.doi. org/10.5194/hess-19-2247-2015.
[12] IPCC, Managing the Risks of Extreme Events and Disasters to Advance Climate Change Adaptation, Special Report of the Intergovernemental Painel on Climate Change, Cambridge University Press, Cambridge. 2012.〈http://dx.doi.org/10. 1017/CBO9781139177245〉.
[13] EASAC, Trends in extreme weather events in Europe: implications for national and European Union adaption strategies, 2013.
[14] K. Alderman, L.R. Turner, S. Tong, Floods and human health: a systematic review, Environ. Int. 47 (2012) 37–47,http://dx.doi.org/10.1016/j.envint.2012.06.003. [15] M. Ahern, R.S. Kovats, P. Wilkinson, R. Few, F. Matthies, Global health impacts of
floods: Epidemiologic evidence, Epidemiol. Rev. 27 (2005) 36–46,http://dx.doi. org/10.1093/epirev/mxi004.
[16] L. Coates, Flood fatalities in Australia, 1788–1996, Aust. Geogr. 30 (1999) 391–408,
http://dx.doi.org/10.1080/00049189993657.
[17] S.N. Jonkman, I. Kelman, An analysis of the causes and circumstances offlood disaster deaths, Disasters 29 (2005) 75–97, http://dx.doi.org/10.1111/j.0361-3666.2005.00275.x.
[18] S.T. Ashley, W.S. Ashley, Flood Fatalities in the United States, J. Appl. Meteorol. Climatol. 47 (2008) 805–818,http://dx.doi.org/10.1175/2007JAMC1611.1. [19] G. FitzGerald, W. Du, A. Jamal, M. Clark, X.-Y. Hou, Flood fatalities in con-temporary Australia (1997–2008), Emerg. Med. Australas. 22 (2010) 180–186,
http://dx.doi.org/10.1111/j.1742-6723.2010.01284.x.
[20] J. French, R. Ing, S. Von Allmen, R. Wood, Mortality fromflash floods: a review of national weather service reports, 1969-81, Public Health Rep. 98 (1983) 584–588〈http://www.pubmedcentral.nih.gov/articlerender.
fcgi*artid=1424497&tool=pmcentrez&rendertype=abstract〉.
[21] C. Bern, J. Sniezek, G.M. Mathbor, M.S. Siddiqi, C. Ronsmans, A.M.R. Chowdhury, A.E. Choudhury, K. Islam, M. Bennish,, E. Noji, R.I. Glass, Risk factors for mortality in the Bangladesh cyclone of 1991, Bull. World Health Organ. 71 (1993) 73–78〈http://www.pubmedcentral.nih.gov/articlerender.
fcgi*artid=2393441&tool=pmcentrez&rendertype=abstract〉.
[22] E.N. Rappaport, Loss of life in the United States associated with recent atlantic tropical cyclones, Bull. Am. Meteorol. Soc. 81 (2000) 2065–2073,http://dx.doi. org/10.1175/1520-0477(2000)081<2065:LOLITU>2.3.CO;2.
[23] X. Li, H. Tan, S. Li, J. Zhou, A. Liu, T. Yang, S.W. Wen, Z. Sun, Years of potential life lost in residents affected by floods in Hunan, China, Trans. R. Soc. Trop. Med. Hyg. 101 (2007) 299–304.
[24] K.A. Borden, S.L. Cutter, Spatial patterns of natural hazards mortality in the United States, Int. J. Health Geogr. 7 (2008) 1–13, http://dx.doi.org/10.1186/1476-072X-7-64.
[25] F. Guzzetti, G. Tonelli, Information system on hydrological and geomorphological catastrophes in Italy (SICI): a tool for managing landslide andflood hazards, Nat. Hazards Earth Syst. Sci. 4 (2004) 213–232, http://dx.doi.org/10.5194/nhess-4-213-2004.
[26] J.L. Zêzere, S. Pereira, A.O. Tavares, C. Bateira, R.M. Trigo, I. Quaresma, P.P. Santos, M. Santos, J. Verde, DISASTER: a GIS database on hydro-geomorpho-logic disasters in Portugal, Nat. Hazards 72 (2014) 503–532,http://dx.doi.org/10. 1007/s11069-013-1018-y.
[27] M. Diakakis, S. Mavroulis, G. Deligiannakis, Floods in Greece, a statistical and spatial approach, Nat. Hazards 62 (2012) 485–500,http://dx.doi.org/10.1007/ s11069-012-0090-z.
[28] M.C. Llasat, M. Llasat-Botija, O. Petrucci, A.A. Pasqua, J. Rosselló, F. Vinet, L. Boissier, Towards a database on societal impact of Mediterranean atmospheric floods within the framework of the HYMEX project, Nat. Hazards Earth Syst. Sci. 13 (2013) 1337–1350,http://dx.doi.org/10.5194/nhess-13-1337-2013.
[29] C. Llasat, M. Llasat-Botija, O. Petrucci, A.A. Pasqua, J. Rossello, F. Vinet, L. Boissier, Floods in the north-western Mediterranean region: presentation of the HYMEX database and comparison with pre-existing global databases, La Houille Blanche (2013) 5–9,http://dx.doi.org/10.1051/lhb/2013001.
[30] M. Cuesta, M. Sánchez, A. García, Press archives as temporal records of landslides in the North of Spain: relationships between rainfall and instability slope events, Geomorphology 30 (1999) 125–132.
[31] EM-DAT, OFDA/CRED International Disaster Database, Cathol. Univ. Louvain, Brussels, Belgium.〈www.emdat.be〉(Accessed 20 June 2009), 2016.
[32] A. Longobardi, P. Villani, Baseflow index regionalization analysis in a mediterra-nean area and data scarcity context: role of the catchment permeability index, J. Hydrol. 355 (2008) 63–75,http://dx.doi.org/10.1016/j.jhydrol.2008.03.011. [33] R.F. Bangash, A. Passuello, M. Hammond, M. Schuhmacher, Water allocation
assessment in lowflow river under data scarce conditions: a study of hydrological simulation in Mediterranean basin, Sci. Total Environ. 440 (2012) 60–71,http://dx. doi.org/10.1016/j.scitotenv.2012.08.031.
[34] D. Gampe, R. Ludwig, S. Afifi, Assessing the impacts of climate change in Mediterranean catchments under conditions of data scarcity The Gaza case study, in: Model. Simul. Appl. Optim., in: Proceedings of the 5th International Conference
IEEE, Hammamet., 2013, pp. 1–5.
[35] L. Boissier, La mortalité liee aux crues torrentielles dans le sud de la France: une approche de la vulnerabilité humaine face a l'inondation (Ph.D. thesis), Université Paul Valéry-Montpellier 3 Arts, Lettres, Langues, Sciences Humaines et Sociales, Montpellier, 2013.
[36] F. Vinet, L. Boissier, Flashflood-related mortality in southern France: first results from a new database, in: FLOODrisk−3rd Eur. Conference Flood Risk Manag., Lyon, 2016: pp. 1–10.
[37] M. Mimikou, D. Koutsoyiannis, Extremefloods in Greece:The case of 1994, in: U.S. -ITALY Res. Work. Hydrometeorol. Impacts, Manag. Extrem. Floods, Perugia, Italy, 1995, pp. 13–17. 〈http://www.engr.colostate.edu/ce/facultystaff/salas/us-italy/ papers/15mimikou.pdf〉.
[38] M. Diakakis, G. Deligiannakis, S. Mavroulis, Flooding in Peloponnese, Greece: a contribution toflood hazard assessment, in: N. Lambrakis, G. Stournaras, K. Katsanou (Eds.), Adv. Res. Aquat. Environ. Vol. 1 Springer Berlin Heidelberg, Berlin, Heidelberg, 2011, pp. 199–206, , http://dx.doi.org/10.1007/978-3-642-19902-8_23.
[39] M. Diakakis, Haveflood mortality qualitative characteristics changed during the last decades* The case study of Greece, Environ. Hazards 15 (2016) 148–159,
http://dx.doi.org/10.1080/17477891.2016.1147412.
[40] M. Diakakis, G. Deligiannakis, Vehicle-relatedflood fatalities in Greece, Environ. Hazards 12 (2013) 278–290,http://dx.doi.org/10.1080/17477891.2013.832651. [41] S.N. Jonkman, Global perspectives on loss of human life caused byfloods, Nat.
Hazards 34 (2005) 151–175,http://dx.doi.org/10.1007/s11069-004-8891-3. [42] M. Diakakis, An inventory offlood events in Athens, Greece, during the last 130
years. Seasonality and spatial distribution, J. Flood Risk Manag. 7 (2014) 332–343,
http://dx.doi.org/10.1111/jfr3.12053.
[43] HNMS, Hellenic National Meteorological Service, Clim. Atlas, 2017.〈http:// climatlas.hnms.gr/〉.
[44] IPMA, Portuguese National Weather Service, Clim. Norm., 2017〈https://www. ipma.pt/pt/oclima/normais.clima/〉.
[45] M.C. Llasat, M. Llasat-Botija, M.A. Prat, F. Porcú, C. Price, A. Mugnai, K. Lagouvardos, V. Kotroni, D. Katsanos, S. Michaelides, Y. Yair, K. Savvidou, K. Nicolaides, High-impactfloods and flash floods in Mediterranean countries: the FLASH preliminary database, Adv. Geosci. 23 (2010) 47–55,http://dx.doi.org/10. 5194/adgeo-23-47-2010.
[46] M.L. Liberato, A.M. Ramos, R.M. Trigo, I.F. Trigo, A.M. Durán-Qesada, R. Nieto, L. Gimeno, A.M. Durán-Quesada, R. Nieto, L. Gimeno, Moisture sources and large-scale dynamics associated with a Flash Flood Event, in: J. Lin, D. Brunner, C. Gerbig, A. Stohl, A. Luhar, P. Webley (Eds.), Lagrangian Model. Atmos. American Geophysical Union, Washington, D.C., 2013, pp. 111–126, ,http://dx.doi.org/10. 1029/2012GM001244.
[47] N. Kazakis, I. Kougias, T. Patsialis, Assessment offlood hazard areas at a regional scale using an index-based approach and Analytical Hierarchy Process: application in Rhodope-Evros region, Greece, Sci. Total Environ. 538 (2015) 555–563,http:// dx.doi.org/10.1016/j.scitotenv.2015.08.055.
[48] N.N. Kourgialas, G.P. Karatzas, Flood management and a GIS modelling method to assessflood-hazard areas—a case study, Hydrol. Sci. J. - J. Des. Sci. Hydrol. 56 (2011) 212–225,http://dx.doi.org/10.1080/02626667.2011.555836. [49] R. Jacinto, N. Grosso, E. Reis, L. Dias, F.D. Santos, P. Garrett, Continental
Portuguese Territory Flood Susceptibility Index– contribution for a vulnerability index, Nat. Hazards Earth Syst. Sci. Discuss. 2 (2014) 7521–7552,http://dx.doi. org/10.5194/nhessd-2-7521-2014.
[50] S. Doocy, A. Daniels, S. Murray, T.D. Kirsch, The human impact offloods: a historical review of events 1980–2009 and systematic literature review, PLOS Curr. Disasters (2013) 1–27,http://dx.doi.org/10.1371/currents.dis.
f4deb457904936b07c09daa98ee8171a.Abstract.
[51] J.S. Becker, H.L. Taylor, B.J. Doody, A.K.C. Wright, E. Gruntfest, D. Webber, A review of people's behavior in and around Floodwater, Weather. Clim. Soc. 7 (2015) 321–332,http://dx.doi.org/10.1175/WCAS-D-14-00030.1.
[52] Hong Kong Planning Department, Hong Kong Planning Standards and Guidelines (HKPSG), in: Miscellaneous, The Government of the Hong Kong special adminis-trative region, Hong Kong, 2007.〈http://www.pland.gov.hk/pland_en/tech_doc/ hkpsg/full/ch4/ch4_text.htm#1.21〉.
[53] A. Malone, The story of quantified risk and its place in slope safety policy in Hong Kong, in: T. Glade, M. Anderson, M.J. Crozier (Eds.), Landslide Hazard Risk, John Wiley & Sons, Ltd, Chichester, England, 2005, pp. 643–674.
[54] R. Fell, K. Ho, S. Lacasse, A framework for landslide risk assessment and manage-ment, in: O. Hungr, R. Fell, R. Couture, E. Eberhardt (Eds.), Landslide Risk Manag. Taylor & Francis Group, London, 2005, pp. 3–25.
[55] C. Ramos, E. Reis, Floods in southern Portugal: their physical and human causes, impacts and human response, Mitig. Adapt. Strateg. Glob. Chang. 7 (2002) 267–284.
[56] A.M. Ramos, N. Cortesi, R.M. Trigo, Circulation weather types and spatial variability of daily precipitation in the Iberian Peninsula, Front. Earth Sci. 2 (2014) 1–17,http://dx.doi.org/10.3389/feart.2014.00025.
[57] A.M. Ramos, R.M. Trigo, M.L.R. Liberato, A ranking of high-resolution daily precipitation extreme events for the Iberian Peninsula, Atmos. Sci. Lett. (2014),
http://dx.doi.org/10.1002/asl2.507.
[58] N. Cortesi, R.M. Trigo, J.C. Gonzalez-Hidalgo, A.M. Ramos, Modelling monthly precipitation with circulation weather types for a dense network of stations over Iberia, Hydrol. Earth Syst. Sci. 17 (2013) 665–678,http://dx.doi.org/10.5194/ hess-17-665-2013.
[59] N. Cortesi, J.C. Gonzalez-Hidalgo, R.M. Trigo, A.M. Ramos, Weather types and spatial variability of precipitation in the Iberian Peninsula, Int. J. Climatol. 34 (2014) 2661–2677,http://dx.doi.org/10.1002/joc.3866.
[60] P.T. Nastos, C.S. Zerefos, Decadal changes in extreme daily precipitation in Greece, Adv. Geosci. 16 (2008) 55–62,http://dx.doi.org/10.5194/adgeo-16-55-2008. [61] A.G. Koutroulis, I.K. Tsanis, I.N. Daliakopoulos, Seasonality offloods and their
hydrometeorologic characteristics in the island of Crete, J. Hydrol. 394 (2010) 90–100,http://dx.doi.org/10.1016/j.jhydrol.2010.04.025.
[62] A. Dünkeloh, J. Jacobeit, Circulation dynamics of Mediterranean precipitation variability 1948-98, Int. J. Climatol. 23 (2003) 1843–1866,http://dx.doi.org/10. 1002/joc.973.
[63] E. Xoplaki, J.F. González-Rouco, J. Luterbacher, H. Wanner, Wet season Mediterranean precipitation variability: influence of large-scale dynamics and trends, Clim. Dyn. 23 (2004) 63–78, http://dx.doi.org/10.1007/s00382-004-0422-0.
[64] P. Lionello, P. Malanotte-Rizzoli, R. Boscolo, Mediterranean climate variability, in: P. Lionello, P. Malanotte-Rizzoli, R. Boscolo (Eds.), Dev. Earth Environ. Sci. Elsevier, London, 2006.
[65] B. Ziv, U. Dayan, Y. Kushnir, C. Roth, Y. Enzel, Regional and global atmospheric patterns governing rainfall in the southern Levant, Int. J. Climatol. 26 (2006) 55–73,http://dx.doi.org/10.1002/joc.1238.
[66] J. Chacón, C. Irigaray, T. Fernández, R. El Hamdouni, Engineering geology maps: landslides and geographical information systems, Bull. Eng. Geol. Environ. 65 (2006) 341–411,http://dx.doi.org/10.1007/s10064-006-0064-z.
[67] J. Fernández, J. Sáenz, E. Zorita, Analysis of wintertime atmospheric moisture transport and its variability over southern Europe in the NCEP Reanalyses, Clim. Res. 23 (2003) 195–215,http://dx.doi.org/10.3354/cr023195.
[68] S. Queralt, E. Hernández, D. Barriopedro, D. Gallego, P. Ribera, C. Casanova, North Atlantic Oscillation influence and weather types associated with winter total and extreme precipitation events in Spain, Atmos. Res. 94 (2009) 675–683,http://dx. doi.org/10.1016/j.atmosres.2009.09.005.
[69] S.D. Drobot, C. Benight, E.C. Gruntfest, Risk factors for driving intoflooded roads, Environ. Hazards 7 (2007) 227–234,http://dx.doi.org/10.1016/j.envhaz.2007.07. 003.
[70] A. Fothergill, Gender, risk and disaster, Int. J. Mass Emerg. Disasters 14 (1996) 33–56.