Full Terms & Conditions of access and use can be found at
https://www.tandfonline.com/action/journalInformation?journalCode=rjsp20
Journal of Sports Sciences
ISSN: 0264-0414 (Print) 1466-447X (Online) Journal homepage: https://www.tandfonline.com/loi/rjsp20
Goals scored and received in 5vs4 GK game
strategy are constrained by critical moment and
situational variables in elite futsal
C. Méndez-Domínguez, M.A. Gómez-Ruano, L.M. Rúiz-Pérez & B. Travassos
To cite this article: C. Méndez-Domínguez, M.A. Gómez-Ruano, L.M. Rúiz-Pérez & B. Travassos (2019): Goals scored and received in 5vs4 GK game strategy are constrained by critical moment and situational variables in elite futsal, Journal of Sports Sciences, DOI: 10.1080/02640414.2019.1640567
To link to this article: https://doi.org/10.1080/02640414.2019.1640567
Published online: 13 Jul 2019.
Submit your article to this journal
SPORTS PERFORMANCE
Goals scored and received in 5vs4 GK game strategy are constrained by critical
moment and situational variables in elite futsal
C. Méndez-Domínguez a, M.A. Gómez-Ruano a, L.M. Rúiz-Pérez aand B. Travassos b
aPhysical Activity and Sport Sciences, Technical University of Madrid, Madrid, Spain;bCIDESD, Research Center in Sports Sciences, Health Sciences
and Human Development, Department of Sport Sciences, University of Beira Interior, Covilhã, Portugal
ABSTRACT
The aim of this study was to identify the importance and meaning of goals using the goalkeeper as an outfield player in elite futsal according to critical and situational variables. The sample consisted of 11,446 actions corresponding to 1,325 matches from the 1stdivision Spanish Futsal League during the
seasons from 2010 to 2015. Multinomial logistic regression and classification tree multivariate models were used to identify the best predictor variables related to the likelihood of scoring goals, receiving goals, or no goals. Results from Multinomial logistic regression emphasised goals scored in balanced matches and playing with the goalkeeper as an outfield player before the last eight minutes. When the teams were drawing or losing,finished with goals received or without goals. The classification tree results identified a greater likelihood of scoring goals when the teams were winning, in balanced matches, and within the last eight minutes. Conversely, a greater likelihood of suffering goals was observed using the goalkeeper as an outfield player when the teams were losing, in unbalanced matches and in the last eight minutes. The identified trends will allow futsal coaches to recognise the most suitable situations for achieving efficacy when using the goalkeeper as an outfield player strategy. ARTICLE HISTORY Accepted 25 June 2019 KEYWORDS Performance analysis; goalkeeper; criticality; situational variables (SV); classification tree analysis (CHAID)
Introduction
Futsal is usually compared to football and associated with a small-sided version of this game. However, Futsal has its own specific dynamics due to the different rules, number of players, field dimensions and balls used. For instance, the FIFA futsal regulations allow the use of the goalkeeper as an outfield player (5vs4+ GK) during the game. It means that any player may change places with the specific goalkeeper (FIFA futsal law 3-the number of players -changing 3-the goalkeeper). Usually, futsal coaches use the risky 5vs4+ GK strategy (the team plays without a goalkeeper in the goal and leaving out free space in the defensive midfield) to unbalance the numerical relations between outfield players and increase the likelihood of generat-ing goal scorgenerat-ing opportunities (Corrêa, Davids, Silva, Denardi, & Tani,2014; Vicente-Vila & Lago-Peñas,2016). This game strategy is almost always used in thefinal moments of the match when the team is losing, as a strategic option to recover the balance on the scoreboard (Barbosa, 2011; Ganef, Pereira, De Almeida, & Coppi,2009; Newton-Ribeiro,2011; Vicente-Vila, 2012; Vicente-Vila & Lago-Peñas,2016).
The observed changes on the numerical relations between outfield players promote adaptations especially in the inter-personal relations between defending players. Due to the numerical inferiority on the field, defensive players tend to be more coordinated to maintain the compactness between the ball and the goal (Travassos, Araújo, Vilar, & McGarry,
2011). Such a strategy allows the defensive team to intercep passing actions or block shots to goal and quickly progress on
thefield with the attacking team unbalanced or shooting at the goal without the goalkeeper. The capacity of the defensive team to manage the numerical unbalance or the attacking team to play without a goalkeeper in the goal can be a decisive factor for defining the final outcome of futsal matches, which seems to be related to the tactical e ffective-ness of the defensive system to perform disarmament of the ball, and to the offensive system that ends the attack situa-tions and then does not generate turnovers (Miloski, Pinho, Gobo, Rebouças, & Schultz,2014).
According to previous research, the 5vs4 + GK game strategy may cause changes on the scoreboard that can establish a final balance of goals in favor (goals scored) or against (goals received). For instance, in Brasil it was reported a similar number of goals in favor (17%) and against (17%) (Barbosa, 2011). However, some studies indi-cated a better final balance (saldo pro goleiro) of goals in favor (goal pro goleiro) than of goals against (goal contra goleiro) during international matches (Ganef et al., 2009). These findings were confirmed in later studies, where it has been revealed the highest number of goals scored (21%) in relation to the goals received (5%) in the men’s national league (Fukuda & Santana, 2012), as well as in the U20 women’s championship (Bezerra & Coppi, 2012) when teams are using this game strategy. Conversely, a recent study revealed that the use of the 5vs4+ GK game strategy did not cause changes in match status, and the teams that were losing and used the 5vs4+ GK game strategy lost the
CONTACTC. Méndez-Domínguez [email protected] Physical Activity and Sport Sciences, Technical University of Madrid, C/Martín Fierro s/n, Madrid 28040, Spain
https://doi.org/10.1080/02640414.2019.1640567
game in 93% of the cases and received more goals com-pared to those scored (Méndez, 2018). Despite such results, and due to the importance of this game strategy for coaches, further studies are needed to understand the really impact of this option on the efficacy and consequently on the final outcome of the match (Vicente-Vila & Lago-Peñas,2016).
Previous research on team sports has also analysed the effect of some Critical Moment Variables (CMV) such as match status, play time and game criticality on variations of game dynamics (Navarro, Lorenzo, Gómez, & Sampaio,
2009; Sampaio, Lorenzo, & Ribeiro, 2006). In Futsal, the analysis of Critical Moments (CM) revealed how match status, play time and fouls committed constrained shoot-ing chances (Méndez, Gómez, Rúiz, & Travassos, 2019), but also constrained coaches to adopt the 5vs4+ GK game strategy (Méndez, Gómez-Ruano, Ruiz, & Cui, 2017). Particularly, it was observed that when a disadvantaged match status of one goal or more occurs, this game strat-egy was preferentially adopted (Barbosa, 2011). In addi-tion, the 5vs4+ GK game strategy occurs almost always in the last minutes of the match as afinal strategy to reduce the goal disadvantage in a short time (Ganef et al., 2009; Newton-Ribeiro, 2011). Also, the effect of some Situational Variables (SV) has been highly investigated (Gómez, Lago-Peñas, & Pollard, 2013; Lago-Ballesteros, Lago-Peñas, Rey, Martínez, & Domínguez, 2012). For instance, in futsal the match location revealed an effect on teams’ success, with a greater likelihood for home teams (Sampedro & Prieto,
2011, 2012). Recently, a study on attacking game situa-tions in numerical superiority with the 4vs3+ GK and 5vs3 + GK game strategies also revealed a higher attack e ffec-tiveness for home teams and the great importance of the match type (Gómez, Méndez, Indaburu, & Travassos,2018). However, the available literature exploring the relation-ship between Situational Variables (SV) and the impact generated by the CM on ball possession efficacy in teams using the 5vs4+ GK game strategy is limited (Moore, Bullough, Goldsmith, & Edmondson, 2014). Due to the main goal of the 5vs4+ GK game strategy, that is generating goal scoring opportunities without exposing the team to shots from the opposing team, such informa-tion is paramount to help coaches to improve the use of such a risky strategy, so it would be interesting that they will not think of using it as a last resource or emergency solution, rather turning it into an alternative to the sym-metry game through of an adequate training from the youth categories (Ganef et al., 2009; Newton-Ribeiro,
2011). Thus, multivariate statistical models, such as multi-nomial logistic regression or classification tree analysis, have been suggested to be suitable for exploring and modeling data related to the control of team performance indicators (Gómez, Lorenzo, Ibañez, & Sampaio, 2013; Gómez, Moral, & Lago-Peñas, 2015; Maneiro, Casal, Ardá, & Losada, 2019). Therefore, the aim of the present study was to understand how SV and CMV in futsal constrain ball possession efficacy in the 5vs4+ GK game strategy using multivariate analysis. It was hypothesised that ball possession efficacy with the 5vs4+ GK game strategy is constrained by SV and CMV.
Method
Data sampling and ethical approval
A total of 1,325 matches from the regular phase and playoffs of the 2010–2011 to the 2014–2015 Spanish men’s professional futsal league matches (LNFS 1stdivision) were analyzed. A sample of 11,446 5vs4+ GK game pieces were considered for the analysis. Each game piece was coded according to ball possession efficacy as: a) goal scored, b) goal received and c) no goal.
The Spanish Professional Futsal League (LNFS) granted the necessary permits to provide the images and use them for research purposes. The Ethics Committee of Research and Development activities of UPM (Technical University of Madrid) was responsible for the evaluation of ethical aspects in order that data collection and processing used in this study will not affect fundamental rights. The ethics committee con-firmed that the study respects the European data protection law (General Data Protection Regulation) regarding the public data processing of team sports. Once informed of the activity described in this manuscript, it was reviewed and approved by the Ethics Committee of Research and Development activities of UPM in order to be published.
Data processing
The matches were analysed through systematic observation using the video analysis software Astrofutsal® (Méndez & Méndez,2005), which is being employed for notational analysis in sports research and is currently a common tool for analysing international futsal competitions (Paz-Franco, Bores-Cerezal, Barcala-Furelos, & Mecias-Calvo, 2014). Payment licence are necessary to access their datasets, and requests should be addressed through registration at http://www.astro-sport.com. The informed consent of the company was obtained in order that this study could use their statistical reports data in research, as well as in subsequent publications, in exchange for the source of the data repository being named.
Two experienced observers (12 years of experience in the notational analysis of futsal events with the use of this tool), participated in the process of data reliability. The match between Pozo de Murcia vs Inter Movistar (Playoff final series 2014–2015) was re-analysed to check inter-observer reliability. The two observers recorded the futsal match events and then the 5vs4+ GK actions of both teams, and their records were compared using Cohen’s Kappa index (k) (Robinson & O’Donoghue, 2007), obtaining a very good agreement between both independent observers (values greater than .89) (Viera & Garrett,2005).
Data notation
All the variables studied are defined in the Table 1. The efficacy of each 5vs4+ GK ball possession: goal scored (attack-ing team scor(attack-ing a goal) goal received (defend(attack-ing team scor-ing a goal) and no goal (ball possession did not cause changes on the scoreboard) was considered as the dependent variable. The independent variables were related to CMV and SV. The SV included: (i) match location (playing at home or away); (ii) opponent’s strength, considering the 16-team ranking at the end 2 C. MÉNDEZ-DOMÍNGUEZ ET AL.
of the regular season, measured as the end-of-season ranking differences between the two teams (Rank team A – Rank team B). The k-means cluster analysis established three different groups (1: best ranked teams vs. worst ranked teams; 2: balanced level of opposition: best teams vs. best teams and worst teams vs. worst teams; 3: worst ranked teams vs. best ranked teams); (iii) the competition phase: regular phase or playoff (where only the first eight ranked teams participate); and (iv) match type: balanced (with a difference of up to two goals) or unbalanced (with a more than two goal difference).
The CMV included: (v) play time, which was defined in five sub-periods of eight minutes in each half time. The k-means cluster analysis was established with 5 levels, so that it could correspond with the likert scale of 5 degrees that measures the criticality of the play time, finally establishing groupings with average values of 8-minute for each level (0–8, 9–16, 17–24, 25–32, 33–40, and extra time in case needed in play-offs); (vi) the match status (winning, drawing or losing); (vii) fouls committed, the number of the team’s accumulated fouls (0, 1st, 2nd, 3rd, 4th or 5th); and (viii) the critical level of the
match, considering the three previous variables, where the highest values represent the appearance of unfavourable CM (Ferreira & Volossovitch, 2013; Ferreira, Volossovitch, & Sampaio, 2014) for one of the teams. The k-means cluster analysis established three different critical levels (low: cumu-lative values between 4 and 8; medium: values between 9 and 11, and high: values between 12 and 15).
Statistical analysis
Firstly, a descriptive and inferential analysis was performed using Crosstab Commands. Pearson’s Chi-square test was used to analyse the relationships between ball possession efficacy with SV and CMV. The effect sizes (ES) were calculated using Cramer’s V test and their interpretation were based on the following criteria: 0.10 = small effect, 0.30 = medium effect and 0.50 = large effect (Volker,2006).
Secondly, a multinomial logistic regression model was used to assess the influence exerted by the interaction of the independent variables (SV and CMV) on ball possession
Table 1.Distribution of frequencies (%) for ball posession efficacy (no goal, goal scored, goal received) in attack with goalkeeper as an outfield player according to critical and situational variables (Contingency table: Chi-square, degrees of freedom, significance, minimum expected frequency and effect size).
No Goal
n = 10218 Goal scoredn = 582 Gol Receivedn = 646
Variables % n % n % n χ2 df P MEF ES Competition Regular phase 90.6 9259 92.4 538 91.5 591 2.621 2 .270 53.80 0.01 Play off 9.4 959 7.6 44 8.5 55 - - - - -Match Location Home 40.4 4124 45.9 267 40.1 259 7.027 2 .030* 236.4 0.02 Away 59.6 6094 54.1 315 59.9 387 - - - - -Opponent’s strength Best (5v4) vs. worst 7.8 795 12.2 71 4.6 30 45.482 4 .001** 45.56 0.04 5v4 between balanced 61.0 6238 63.2 368 56.5 365 - - - - -Worst (5v4) vs. best 31.2 3185 24.6 143 38.9 251 - - - - -Match type Balanced 55.4 5656 72.5 422 30.3 196 230.988 2 .001** 262.9 0.14 Unbalanced 44.6 4562 27.5 160 69.7 450 - - - - -Play time 1st half - 348 - 11 - 16 - - - - -0–8 2.3 8 0.0 0 0.0 0 6.709 8 .446 0.23† 0.10 9–16 5.5 19 0.0 0 0.0 0 - - - - -17–24 10.3 36 18.2 2 12.5 2 - - - - -25–32 24.4 85 45.5 5 43.8 7 - - - - -33–40 57.5 200 36.4 4 43.8 7 - - - - -2nd half - 9772 - 567 - 626 - - - - -0–8 1.9 189 1.4 8 1.6 10 7.822 8 .451 10.70 0.01 9–16 3.1 306 2.3 13 2.9 18 - - - - -17–24 8.6 838 9.5 54 7.2 45 - - - - -25–32 28.2 2753 29.5 167 25.9 162 - - - - -33–40 58.2 5686 57.3 325 62.5 391 - - - - -Extra time - 98 - 4 - 4 - - - - -Match status Losing 91.1 9311 63.6 370 97.7 631 641.250 4 .001** 10.12 0.16 Drawing 7.6 781 24.6 143 1.7 11 - - - - -Winning 1.2 126 11.9 69 0.6 4 - - - - -Fouls committed 0 3.7 375 3.4 20 3.6 23 15.588 10 .112 21.25 0.02 1st 11.4 1164 10.8 63 12.4 80 - - - - -2nd 25.2 2572 29.6 172 24.3 157 - - - - -3rd 25.9 2648 23.7 138 27.1 175 - - - - -4th 16.0 1635 18.9 110 15.3 99 - - - - -5th 17.9 1824 13.6 79 17.3 112 - - - - -Criticality High (12–15) 73.0 7460 54.6 318 73.8 477 98.599 4 .001** 19.63 0.06 Medium (9–11) 23.6 2412 41.2 240 23.7 153 - - - - -Low (4–8) 3.4 346 4.1 24 2.5 16 - - - -
-efficacy with 5vs4+ GK (Gómez et al., 2015; Vicente-Vila & Lago-Peñas,2016). In the logistic regression model, ball pos-session efficacy was included as a polytomous dependent variable, depending on whether the 5vs4+ GK ended in a goal scored, goal received, or no goal. In addition, the reference category of the dependent variable was established, so that all the categories were compared to each other (1: attacks without goals compared to attacks with goals received; 2: attacks with goals scored compared to attacks with goals received, and 3: attacks with goals scored compared to attacks without goals) and always in relation to the independent variables included in the study. For each variable the odds ratios (OR) and their 95% confidence intervals (CI) were deter-mined. The significance level was established at P < 0.05.
Thirdly, the exhaustive chi-squared automatic interaction detection (CHAID) classification tree analysis was used to split the sample into nodes (subgroups) in order to identify the best predictors (independent variables) of ball possession efficacy with 5vs4+ GK (Gómez et al., 2015).The statistical model specifications were: (i) the significance level was set at P < 0.05; (ii) Pearson’s Chi-square was used; (iii) the maximum number of iterations were 100–50; (iv) the minimum change in expected cell frequencies was 0.001; (v) the Bonferroni method was used to obtain the significance values of adjust-ment; (vi) cross-validation was carried out and, for each sub-sample, one tree was built with the remaining cases (90%); (vii) the tree had a three level maximum, and (viii) the misclassi fi-cation risk was calculated as a measure of the model reliability (Schnell, Mayer, Diehl, Zipfel, & Thiel,2014). Statistical analyses
were performed using IBM SPSS for Windows statistics, version 22.0 (Armonk, NY: IBM. Corp.).
Results
The distribution of frequencies for ball posession efficacy (goal scored, goal received, no goal) from the studied variables is shown in Table 1 (percentage and case num-bers). A significant relationship was found between the greater likelihood of scoring goals and the 5vs4+ GK game strategy by local teams, in best ranked teams vs. worst ranked teams, and balanced matches. Conversely, but as expected, a significant relationship was found between the greater likelihood of receiving goals and the 5vs4+ GK game strategy when the team was losing, and at a high criticality level.
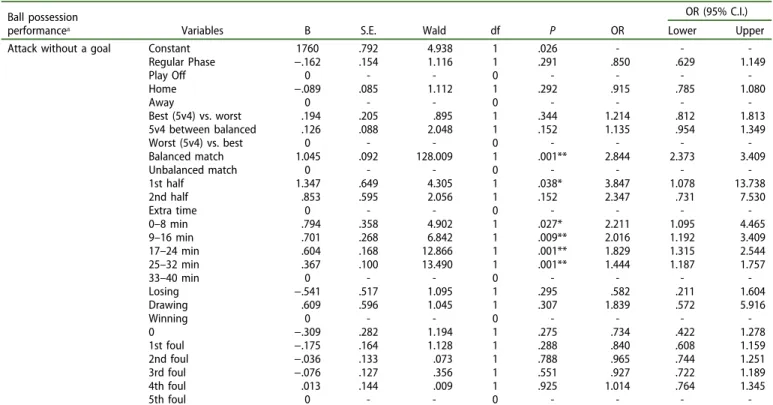
Results from the multinomial logistic regression analysis (Table 2, III and IV) identify ball possession efficacy with the 5vs4+ GK game strategy concerning the independent variables. The results showed that the model was statisti-cally significant (χ2 = 669,232; P = .001), correctly classi fiy-ing 89.3% of the cases. Table 2 compares the attacks without goals against attacks with goals received and concerning the independent variables. The model showed a greater likelihood of there being no changes on the scoreboard when the 5vs4+ GK game strategy was used during the first half (OR = 3.847), and during the first four play time intervals, namely between 0–8 min (OR = 2.211), 9–16 min (OR = 2.016), 17–24 min (OR = 1.829), and
Table 2.Effects of the independent variables on ball possession efficacy in attack with goalkeeper as an outfield player, comparing attacks without goals with the ones with goals received.
Ball possession
performanceᵃ Variables B S.E. Wald df P OR
OR (95% C.I.) Lower Upper
Attack without a goal Constant 1760 .792 4.938 1 .026 - -
-Regular Phase −.162 .154 1.116 1 .291 .850 .629 1.149 Play Off ᵇ 0 - - 0 - - - -Home −.089 .085 1.112 1 .292 .915 .785 1.080 Awayᵇ 0 - - 0 - - - -Best (5v4) vs. worst .194 .205 .895 1 .344 1.214 .812 1.813 5v4 between balanced .126 .088 2.048 1 .152 1.135 .954 1.349 Worst (5v4) vs. bestᵇ 0 - - 0 - - - -Balanced match 1.045 .092 128.009 1 .001** 2.844 2.373 3.409 Unbalanced matchᵇ 0 - - 0 - - - -1st half 1.347 .649 4.305 1 .038* 3.847 1.078 13.738 2nd half .853 .595 2.056 1 .152 2.347 .731 7.530 Extra timeᵇ 0 - - 0 - - - -0–8 min .794 .358 4.902 1 .027* 2.211 1.095 4.465 9–16 min .701 .268 6.842 1 .009** 2.016 1.192 3.409 17–24 min .604 .168 12.866 1 .001** 1.829 1.315 2.544 25–32 min .367 .100 13.490 1 .001** 1.444 1.187 1.757 33–40 minᵇ 0 - - 0 - - - -Losing −.541 .517 1.095 1 .295 .582 .211 1.604 Drawing .609 .596 1.045 1 .307 1.839 .572 5.916 Winningᵇ 0 - - 0 - - - -0 −.309 .282 1.194 1 .275 .734 .422 1.278 1st foul −.175 .164 1.128 1 .288 .840 .608 1.159 2nd foul −.036 .133 .073 1 .788 .965 .744 1.251 3rd foul −.076 .127 .356 1 .551 .927 .722 1.189 4th foul .013 .144 .009 1 .925 1.014 .764 1.345 5th foulᵇ 0 - - 0 - - -
-Note: S.E: = Standard error; CI = Confidence intervals; a) the reference category of the dependent variable that is compared: Goal received; b) the redundant category of the independent variable that is compared when OR = 1.
*P < .05.; **P < .01.
25–32 min (OR = 1.444), in the case of balanced matches (OR = 2.844).
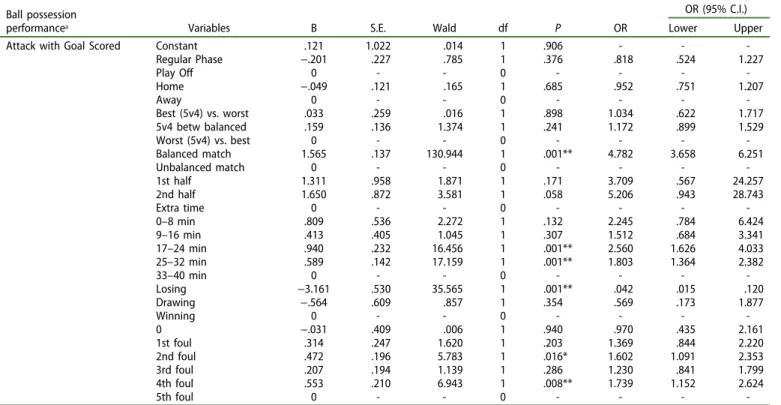
Table 3 compares the attacks with goals scored against attacks with goals received and concerning the indepen-dent variables. The model showed a greater likelihood of scoring goals with the 5vs4+ GK game strategy in balanced matches (OR = 4.782), in play time intervals furthest from the end of the match, particularly between 17 to 24 min (OR = 2.560) and 25 to 32 min (OR = 1.803), and before the arrival of the 5th foul, particularly with the 2nd accumulated foul (OR = 1.602) as well as the 4th one (OR = 1.739). Conversely to what would happen with a favorable scoreboard, when the 5vs4+ GK game strategy was used by a losing team there was a lower likelihood of scoring goals (OR = .042), increasing the probability of receiving goals.
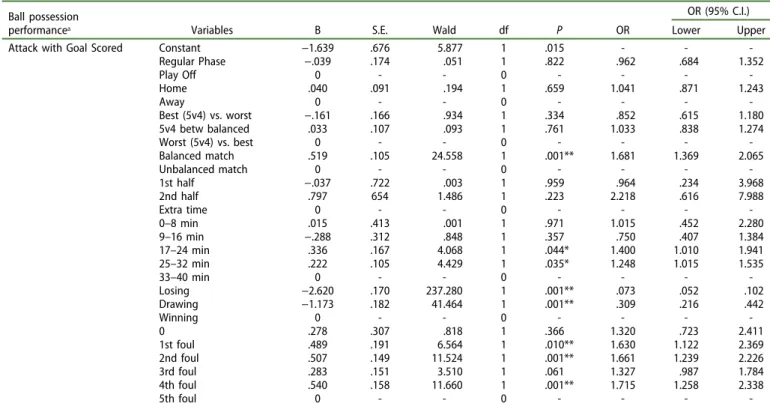
Table 4 compares the attacks with goals scored against attack without goals and concerning the independent vari-ables. The model showed a greater likelihood of scoring goals with the 5vs4+ GK game strategy in balanced matches (OR = 1.681), in play time intervals furthest from the end of the match, specifically between the 17 to 24 min (OR = 1.400) and 25 to 32 min (OR = 1.248), and before the arrival of the 5th foul, particularly with the 1st foul (OR = 1.630), 2nd foul (OR = 1.661) as well as the 4th one (OR = 1.715). Conversely to what would happen with a favorable scoreboard, when the 5vs4+ GK game strategy was used in a drawn match there was a lower likelihood of scoring goals (OR = . 309), which became
a greater disadvantage if the 5vs4+ GK game strategy was used by the losing team (OR = . 073), increasing the prob-ability of attacks without goals.
Thirdly, the exhaustive CHAID classification tree shows three significantly influenced factors on ball possession effi-cacy of the 5vs4+ GK game strategy (tree-stage three). Those factors led to 16 nodes (10final nodes) of contrasting groups of ball possession efficacy; mainly established by match status (level 1), match type (level 2), and play time interval (level 3).
Figure 1shows the categories for the dependent variable (goal scored, goal received, no goal) and also the 16 nodes defined by the classification tree. The predictive power of the classifi-cation tree model explained 89.4% of total variance after cross-validation analysis, reaching a precision of 99.7% in cases of no goal, of 7.9% in cases of goals scored and of 1% in cases of goals received. The unbalanced precision value of the dependent variables was due to the large number of cases without a goal over the total.
At level 1 the root node is split by the match status at the moment the 5vs4+ GK is used, achieving greater efficacy with a favorable scoreboard (winning) (node 3: 34.7% of attacks with goals scored; 63.3% of attacks without goals; 2% of attacks with goals received), and less efficacy with an unfavor-able scoreboard (losing) (node 1: 3.6% of attacks with goals scored; 90.3% of attacks without goals; 6.1% of attacks with goals received). At level 2 it showed the importance of match type. Ball possession efficacy of the 5vs4+ GK game strategy was higher in those balanced matches when winning (node 9:
Table 3.Effects of the independent variables on ball possession efficacy in attack with goalkeeper as an outfield player, comparing attacks with goals scored with the ones with goals received.
Ball possession
performanceᵃ Variables B S.E. Wald df P OR
OR (95% C.I.) Lower Upper
Attack with Goal Scored Constant .121 1.022 .014 1 .906 - -
-Regular Phase −.201 .227 .785 1 .376 .818 .524 1.227 Play Off ᵇ 0 - - 0 - - - -Home −.049 .121 .165 1 .685 .952 .751 1.207 Awayᵇ 0 - - 0 - - - -Best (5v4) vs. worst .033 .259 .016 1 .898 1.034 .622 1.717 5v4 betw balanced .159 .136 1.374 1 .241 1.172 .899 1.529 Worst (5v4) vs. bestᵇ 0 - - 0 - - - -Balanced match 1.565 .137 130.944 1 .001** 4.782 3.658 6.251 Unbalanced matchᵇ 0 - - 0 - - - -1st half 1.311 .958 1.871 1 .171 3.709 .567 24.257 2nd half 1.650 .872 3.581 1 .058 5.206 .943 28.743 Extra timeᵇ 0 - - 0 - - - -0–8 min .809 .536 2.272 1 .132 2.245 .784 6.424 9–16 min .413 .405 1.045 1 .307 1.512 .684 3.341 17–24 min .940 .232 16.456 1 .001** 2.560 1.626 4.033 25–32 min .589 .142 17.159 1 .001** 1.803 1.364 2.382 33–40 minᵇ 0 - - 0 - - - -Losing −3.161 .530 35.565 1 .001** .042 .015 .120 Drawing −.564 .609 .857 1 .354 .569 .173 1.877 Winningᵇ 0 - - 0 - - - -0 −.031 .409 .006 1 .940 .970 .435 2.161 1st foul .314 .247 1.620 1 .203 1.369 .844 2.220 2nd foul .472 .196 5.783 1 .016* 1.602 1.091 2.353 3rd foul .207 .194 1.139 1 .286 1.230 .841 1.799 4th foul .553 .210 6.943 1 .008** 1.739 1.152 2.624 5th foulᵇ 0 - - 0 - - -
-Note: S.E: = Standard error; CI = Confidence intervals; a) the reference category of the dependent variable that is compared: Goal received; b) the redundant category of the independent variable that is compared when OR = 1.
42.7% of attacks with goals scored; 54.5% of attacks without goals; and 2.8% of attacks with goals received); but it conver-sely decreased when the strategy was used in unbalanced matches when losing (node 4: 2.9% of attacks with goals scored; 88.2% of attacks without goals; 8.9% of attacks with goals received). At level 3, the tree identified significant differ-ences with the predictor variables when the play time interval was included. Thus, when winning matches that were already balanced (node 9), the likelihood of scoring goals with the 5vs4+ GK game strategy increased in thefinal eight minutes of the match (node 16: 57.5% of goals scored) compared to the others (node 15: 23.8% of goals scored). Similarly, the like-lihood of receiving goals was greater in thefinal eight minutes of the match (node 11: 10.7%) compared to the others (node 10: 7.2% of goals received), particularly when losing matches that were already unbalanced (node 4).
Discussion and conclusion
The aim of this study was to explore how CMV and SV con-strain ball possession efficacy (goal scored, goal received and no goal) of the 5vs4+ GK game strategy for future predictions about its use. Results from research in futsal should lead coaches to greater knowledge of variables that constrain the use of the 5vs4+ GK strategy and its risk in different matches and at different moments of the game. In general, the results revealed an equal proportion between the goals scored (n = 582, 5.1%) and the goals received (n = 646, 5.6%) using the 5vs4+ GK game strategy. However, there was a strong constraint of the SV match type and a general constraint of
CMV on ball possession efficacy. Overall, the greater likelihood of scoring goals was achieved in the regular phase, playing at home, in balanced games, by the best ranked teams, before the last eigth minutes of the match, with a favorable match status (winning), and a variable number of accumulated fouls. Conversely, the likelihood of receiving goals corresponded to the regular phase, playing away, in unbalanced games, by the worst ranked teams, in the last eight minutes of the match, when losing, with a variable number of accumulated fouls, but always at a high criticality level.
The analysis of SV revealed the strongly constraint of match type on the ball possession efficacy. The logistic regression results showed that balanced matches had advan-tages regarding ball possession efficacy. Particularly a 4.78 times greater likelihood of scoring goals than receiving goals, a 2.84 times greater likelihood of not scoring than receiving goals, and a 1.68 times greater likelihood of scoring goals than not scoring, compared to unbalanced matches. Likewise, the classification tree found the significant effect of the match type starting from match status, and showed the greater efficacy in balanced compared with unbalanced matches. As match status worsened there was a progressive decrease in efficacy, which can be interpreted as a greater difficulty in scoring goals, but also a greater ease in receiving goals. For instance, in balanced games it went from 42.7% of attacks with goals scored when winning to 4.2% when losing; while in unbalanced games it went from 14.3% of attacks with goals scored when winning to 2.9% when losing, which also had a negative impact on an increase in the goals received (8.9%). Match type is recognised as a discriminator
Table 4.Effects of the independent variables on ball possession efficacy in attack with goalkeeper as an outfield player, comparing the attacks with goals scored with the ones without goals.
Ball possession
performanceᵃ Variables B S.E. Wald df P OR
OR (95% C.I.) Lower Upper
Attack with Goal Scored Constant −1.639 .676 5.877 1 .015 - -
-Regular Phase −.039 .174 .051 1 .822 .962 .684 1.352 Play Off ᵇ 0 - - 0 - - - -Home .040 .091 .194 1 .659 1.041 .871 1.243 Awayᵇ 0 - - 0 - - - -Best (5v4) vs. worst −.161 .166 .934 1 .334 .852 .615 1.180 5v4 betw balanced .033 .107 .093 1 .761 1.033 .838 1.274 Worst (5v4) vs. bestᵇ 0 - - 0 - - - -Balanced match .519 .105 24.558 1 .001** 1.681 1.369 2.065 Unbalanced matchᵇ 0 - - 0 - - - -1st half −.037 .722 .003 1 .959 .964 .234 3.968 2nd half .797 654 1.486 1 .223 2.218 .616 7.988 Extra timeᵇ 0 - - 0 - - - -0–8 min .015 .413 .001 1 .971 1.015 .452 2.280 9–16 min −.288 .312 .848 1 .357 .750 .407 1.384 17–24 min .336 .167 4.068 1 .044* 1.400 1.010 1.941 25–32 min .222 .105 4.429 1 .035* 1.248 1.015 1.535 33–40 minᵇ 0 - - 0 - - - -Losing −2.620 .170 237.280 1 .001** .073 .052 .102 Drawing −1.173 .182 41.464 1 .001** .309 .216 .442 Winningᵇ 0 - - 0 - - - -0 .278 .307 .818 1 .366 1.320 .723 2.411 1st foul .489 .191 6.564 1 .010** 1.630 1.122 2.369 2nd foul .507 .149 11.524 1 .001** 1.661 1.239 2.226 3rd foul .283 .151 3.510 1 .061 1.327 .987 1.784 4th foul .540 .158 11.660 1 .001** 1.715 1.258 2.338 5th foulᵇ 0 - - 0 - - -
-Note: S.E: = Standard error; CI = Confidence intervals; a) the reference category of the dependent variable that is compared: No goal; b) the redundant category of the independent variable that is compared when OR = 1.
*P < .05.; **P < .01.
of the main performance indicators, and its influence has been investigated to contextualize the factors linked with victory or defeat (Csataljay, O’Donoghue, Hughes, & Dancs,
2009). Besides, the analysis showed an unexpected non-influence of match location and opponent’s strength, which can be explained by the fact that it is usual that the teams’ strategy and their success level are affected by environmen-tal conditions and by the opponent’s assertive behaviors (Gómez, DelaSerna, Lupo, & Sampaio, 2014), which can lead to the positive effect of the playing at home advantage being nullified by playing against balanced or stronger teams (Sampedro & Prieto, 2011).
The multivariate analysis established the strongly constraint of CMV on the 5vs4+ GK game strategy, particularly revealing that match status strongly influences ball possession efficacy when using 5vs4+ GK. Thefindings from the logistic regression model revealed that when the teams were losing the likelihood of scoring goals was lower. Also, as match status worsened there was less likelihood of the attacking team scoring goals. Consistently with the previous results, the classification tree revealed that the greatest efficacy of the 5vs4+ GK game strat-egy was achieved when the attacking team was winning (34.7% of attacks with goals scored, 63.3% of attacks without goals, 2% of attacks with goals received), while the least efficacy was revealed when the attacking team was losing (3.6% of attacks with goals scored, 90.3% of attacks without goals, and 6.1% of attacks with goals received). Similarly, in a recent study from the UEFA futsal Euro 2016, it was found that the national teams that were losing and at the end were defeated scored more goals with the 5vs4 + GK strategy, but they also received more goals compared to the teams that were winning and at the end won (Göral,2018). And another recently published study revealed that the 5vs4+ GK strategy was the most powerful match vari-able for discriminating losing teams, and confirmed again that the losing teams used the 5vs4+ GK strategy much more than the winning teams (Mendez, Gonçalves, Santos, Ribeiro, & Travassos,2019). This fact could be explained by the need to achieve a balanced scoreboard in the teams that were losing and used this strategy, and by the lower frequency of use in the teams that were winning. However, the unexpected non-significant influence of match status on the ball possession efficacy (Gómez et al.,2015; Vicente-Vila & Lago-Peñas,2016) could be justified by the fact that futsal teams losing by a recoverable difference (up to 2 goals) do not take risks playing with the 5vs4+ GK strategy, mortgaging a possible increase in offensive efficacy, or also as Lago-Peñas (2009) pointed out that critical variables would have unique effects on individual players, teams and playing styles.
Furthermore, multinomial logistic regression found a strong constraint between play time intervals and ball possession efficacy. As the end of match time approached there was a negative trend in 5vs4+ GK efficacy. Thus, the play time intervals between the 17–24 min and 25–32 min, had the advantage of a 2.56 and 1.80 times greater likelihood of scoring goals than receiving goals, and the advantage of a 1.40 and 1.25 times greater likelihood of scoring goals than there being no goals in attack with 5vs4+ GK, compared to the final play time interval (33–40 min). All of which seems to point to the
fact that ball possession efficacy faded near the final minutes, which would be consistent with the greatest difficulty in achiev-ing efficacy when a CM occurs, and agrees with the criticality attributed to these final minutes by the scientific community (Ferreira, 2013; Ferreira & Volossovitch, 2013; Ferreira et al.,
2014; Navarro, Gómez, Lorenzo, & Jiménez, 2013; Sampaio et al.,2006). Also, the results of the classification tree coincide in pointing out thefinal minutes of the match as those with the worst efficacy with 5vs4+ GK (92.8% of attacks without goals), but also aggravating the likelihood that it would end in goals received (n = 256, 10.7%), which can be explained by having been used in games that were unbalanced when losing. However, the tree also showed a greater likelihood of scoring goals within the final play time interval (33-40min) (n = 46, 57.5%) compared to the others (n = 15, 23.8%). This fact is striking because the approach to the end of a match is a difficult moment, an aspect which should be added the impact generated by the presence of a risk strategy that could decrease the efficacy, finding unexpectedly that was better, which can be explained because the strategy was used in matches that were balanced when winning (see Figure 1). This seems to agree with a previous study that revealed the importance of play time intervals close to the end of the match to establish the occurrence of this strategy with a better bal-ance of goals in favor (saldo pro goleiro) (Ganef et al., 2009; Newton-Ribeiro,2011). All of this is consistent with most of the studies found in the futsalfield, where the occurrence of the 5vs4+ GK strategy may lead to the appearance of goals (scored or received) in those final minutes, revealing that the last 10 minute period showed a higher frequency of goals and higher averages compared to the three initial play time inter-vals (Abdel-Hakim,2014; Fukuda & Santana,2012; Poffo & Lima,
2012; Siqueira, Da-Silva, Aragonez, Damico, & Crescente,2016). Finally, fouls committed also constrain ball possession e ffi-cacy. Results from the logistic regression model showed that the arrival of the 2nd and 4th foul were linked with the probability that an attack with 5vs4+ GK ended in a goal scored and not in a goal received or no goal, compared to the 5th foul. The trend suggests that it is better attacking with 5vs4+ GK before the 5th cumulative foul, where the likelihood of suffering goals increased. The 5th accumulated foul or its proximity, and its possible consequences of a penalty free kick from the second penalty mark at 10 m (FIFA futsal law 13- Free Kicks), usually appears in thefinal moments of the match and the scoreboard at a disadvantage for the team that attacks with 5vs4+ GK, hence the presentedfindings may suggest that the lower efficacy coincides with the occurrence of a CM, and this could hinder the goal scoring chances, an aspect which has been argued in other sports (Sampaio et al., 2006). However, although the allowed limit constrains the game and team efficacy, the number of fouls committed was not significant to decide the winner and did not interfere in the futsal match outcome (Pereira-Guimarães, Neves, Rodrigues, & Coppi,2010).
In conclusion, the 5vs4+ GK game strategy is gaining increas-ing importance due to the fact that both the attackincreas-ing and defending teams, have a high likelihood of achieveing advan-tages on the scoreboard. Further research should take into
account the different match status of each team before using this strategy, to measure its profitability, because it is not the same to use it when a team goes from winning to losing, than when it goes from drawing to losing, or when it goes from losing to winning, which could bring unknown data about the players’ behavior. Also, a more appropriate diagnosis is lacking for coaches using this strategy to minimize the risks of receiving goals and to optimize the key moments of its use, which can be with CM anticipation, but also using the 5vs4+ GK as a possible advantage granted by the game rules. It is currently being used by the best teams in a numerical inferiority situation by dismis-sal, and also by the weakest teams, not so much to create goal scoring opportunities as to speculate with ball possession, which can give new data on efficacy.
Practical implications and limitations
The identified trends are of great relevance from the coach’s point of view where the numerical superiority/inferiority game context directly impacts the team’s performance. Accordingly, from a practical application point of view, the information obtained may change the coach’s game strategy so as not to use this strategical option as a last resort tactic. For that, there is a need for coaches to change their per-spective about 5vs4+ GK and incorporate it in the design of practice tasks as a usual game scenario, that can be used at any moment of the game as a dynamic game situation (3vs2., 4vs3 . . . up to 5vs4) (Ganef et al., 2009;
Newton-Ribeiro, 2011). Also such results can help them identify the most appropriate moments for its application. Although it is not usual, the team that is not losing may use the risk strategy before having to overcome an adverse scoreboard, when the players are still not exposed to a CM, which would facilitate the aim of breaking a negative inertia of ball possession and goal chances by the opposing team, in order to reach the desired advantage.
The present study has some limitations that need to be addressed in future studies, one of them may be related to how to make the data analysis even more robust. It could be interesting the possibility of using survival models or statistical analyses that consider the data time dimension (random forest or T-patterns), which are particularly relevant for the analysis of the goals’ achievement patterns, and the factors that can influence the probability of scoring a goal with this strategy.
Disclosure statement
No potential conflict of interest was reported by the authors.
ORCID
C. Méndez-Domínguez http://orcid.org/0000-0003-1662-2448
M.A. Gómez-Ruano http://orcid.org/0000-0002-9585-3158
L.M. Rúiz-Pérez http://orcid.org/0000-0002-9678-5986
B. Travassos http://orcid.org/0000-0002-2165-2687
BALL POSSESSION EFFICACY
Node 0 Category % n No Goal 89,3 10218 Goal Scored 5,1 582 Goal Received 5,6 646 Total 100,0 11446 Node 16 Category % n No Goal 38,8 31 Goal Scored 57,5 46 Goal Received 3,8 3 Total 0,7 80 Node 15 Category % n No Goal 74,6 47 Goal Scored 23,8 15 Goal Received 1,6 1 Total 0,6 63 Node 14 Category % n No Goal 92,8 3290 Goal Scored 3,4 121 Goal Received 3,8 135 Total 31,0 3546 Node 13 Category % n No Goal 91,7 1307 Goal Scored 5,3 76 Goal Received 2,9 42 Total 12,4 1425 Node 12 Category % n No Goal 89,3 285 Goal Scored 8,2 26 Goal Received 2,5 8 Total 2,8 319 Node 11 Category % n No Goal 87,0 2075 Goal Scored 2,3 55 Goal Received 10,7 256 Total 20,8 2386 Node 10 Category % n No Goal 89,3 2354 Goal Scored 3,5 92 Goal Received 7,2 190 Total 23,0 2636 Node 9 Category % n No Goal 54,5 78 Goal Scored 42,7 61 Goal Received 2,8 4 Total 1,2 143 Node 8 Category % n No Goal 85,7 48 Goal Scored 14,3 8 Goal Received 0,0 0 Total 0,5 56 Node 7 Category % n No Goal 82,8 696 Goal Scored 16,4 138 Goal Received 0,8 7 Total 7,3 841 Node 6 Category % n No Goal 90,4 85 Goal Scored 5,3 5 Goal Received 4,3 4 Total 0,8 94 Node 5 Category % n No Goal 92,3 4882 Goal Scored 4,2 223 Goal Received 3,5 185 Total 46,2 5290 Node 4 Category % n No Goal 88,2 4429 Goal Scored 2,9 147 Goal Received 8,9 446 Total 43,9 5022 Node 1 Category % n No Goal 90,3 9311 Goal Scored 3,6 370 Goal Received 6,1 631 Total 90,1 10312 Node 2 Category % n No Goal 83,5 781 Goal Scored 15,3 143 Goal Received 1,2 11 Total 8,2 935 Node 3 Category % n No Goal 63,3 126 Goal Scored 34,7 69 Goal Received 2,0 4 Total 1,7 199 No Goal Goal Scored Goal Received Match Status Adj. P-value=0.001, Chi-Square=641.250, df=4
Match type Adj. P-value=0.001, Chi-Square=138.736, df=2
Match type Adj. P-value=0.001, Chi-Square=15.814, df=2
Match type Adj. P-value=0.001, Chi-Square=17.083, df=2
Play time Adj. P-value=0.001, Chi-Square=24.270, df=2
Play time Adj. P-value=0.001, Chi-Square=24.910, df=4
Play time Adj. P-value=0.001, Chi-Square=18.273, df=2
Losing Drawing Winning
Unbalanced Balanced Unbalanced Balanced Unbalanced Balanced
17-24 min 33-40 min 0-8/9-16/17-24/25-32min 33-40 min
33-40 min 0-8/9-16/25-32 min
0-8/9-16/17-24/25-32 min
Figure 1.Classification tree analysis of ball possession efficacy. 8 C. MÉNDEZ-DOMÍNGUEZ ET AL.
References
Abdel-Hakim, H. (2014). Quantitative analysis of performance indicators of goals scored in the futsal World Cup Thailand 2012. Pamukkale Journal of Sport Sciences, 5(1), 113–127.
Barbosa, A. (2011). Variação tática de goleiro linha não altera o resultado das partidas de futsal na Taça São Paulo 2009. RBFF-Revista Brasileira De Futsal E Futebol, 3(8), 101–107.
Bezerra, R., & Coppi, A. (2012). Análise dos gols da VI Taça Brasil de Clubes 2010 na categoria sub-20 feminino. RBFF-Revista Brasileira De Futsal E Futebol, 4 (11), 47–54.
Corrêa, U., Davids, K., Silva, S., Denardi, R., & Tani, G. (2014). The influence of a goalkeeper as an outfield player on defensive subsystems in futsal. Advances in Physical Education, 4(2), 84–92. doi:10.4236/ape.2014.42012
Csataljay, G., O’Donoghue, P., Hughes, M., & Dancs, H. (2009). Performance indicators that distinguish winning and losing teams in basketball. International Journal of Performance Analysis in Sport, 9(1), 60–66. doi:10.1080/24748668.2009.11868464
Ferreira, A. (2013). From game momentum to criticality of game situations. In T. McGarry, P. O’Donoghue, & J. Sampaio (Eds.), The Routledge handbook of sports performance analysis (pp. 270–282). London: Routledge International Handbooks.
Ferreira, A., & Volossovitch, A. (2013). Criticalidad e momentos críticos nos jogos desportivos: Una revição teórica. In A. Volossovitch & A. Ferreira (Eds.), Fundamentos e aplicações em análise do jogo (1ª ed., pp. 35–60). Lisbon: Edições FMH.
Ferreira, A., Volossovitch, A., & Sampaio, J. (2014). Towards the game critical moments in basketball: A grounded theory approach. International Journal of Performance Analysis in Sport, 14(2), 428–442. doi:10.1080/ 24748668.2014.11868732
Fukuda, J., & Santana, W. (2012). Análises dos gols em jogos da Liga Futsal 2011. RBFF-Revista Brasileira De Futsal E Futebol, 4(11), 62–66.
Ganef, E., Pereira, F., De Almeida, E., & Coppi, A. (2009). Influência do goleiro-linha no resultado do jogo de futsal. RBFF-Revista Brasileira De Futsal E Futebol, 1(3), 186–192.
Gómez, M., DelaSerna, A., Lupo, C., & Sampaio, J. (2014). Effects of situational variables and starting quarter score in the outcome of elite women’s water polo game quarters. International Journal of Performance Analysis in Sport, 14 (1), 73–83. doi:10.1080/24748668.2014.11868704
Gómez, M., Lago-Peñas, C., & Pollard, R. (2013). Situational variables. In T. McGarry, P. O’Donoghue, & J. Sampaio (Eds.), The Routledge handbook of sports performance analysis (pp. 259–269). London: Routledge International Handbooks.
Gómez, M., Lorenzo, A., Ibañez, S., & Sampaio, J. (2013). Ball possession e ffec-tiveness in men’s and women’s elite basketball according to situational variables in different game periods. Journal of Sports Sciences, 31(14), 1578–1587. doi:10.1080/02640414.2013.792942
Gómez, M., Méndez, C., Indaburu, A., & Travassos, B. (2018). Goal effectiveness after players’ dismissals in professional futsal teams. Journal of Sports Sciences, 37(8), 857–863. doi:10.1080/02640414.2018.1531498
Gómez, M., Moral, J., & Lago-Peñas, C. (2015). Multivariate analysis of ball possessions effectiveness in elite futsal. Journal of Sports Sciences, 33(20), 2173–2181. doi:10.1080/02640414.2015.1075168
Göral, K. (2018). Analysis of Serbia UEFA Futsal Euro 2016 competitions in terms of some variables. Journal of Education and Training Studies, 6(10), 1–6. Lago-Ballesteros, J., Lago-Peñas, C., Rey, E., Martínez, L., & Domínguez, E. (2012).
El éxito ofensivo en el fútbol de élite: Influencia de los modelos tácticos empleados y de las variables situacionales. European Journal of Human Movement, 1(28), 145–170.
Lago-Peñas, C. (2009). The influence of match location, quality of opposition, and match status on possession strategies in professional association football. Journal of Sports Sciences, 27(13), 1463–1469. doi:10.1080/ 02640410903131681
Maneiro, R., Casal, C., Ardá, A., & Losada, J. (2019). Application of multivariant decision tree technique in high performance football: The female and male corner kick. PloS One, 14(3), e0212549. doi: 10.1371/journal.pone.0212549 Méndez, C. (2018). Rentabilidad del portero jugador de futsal, y la
con-veniencia de su entrenamiento desde las etapas de formación. Revista Pedagógica De Educación Física ADAL, 21(36), 34–39.
Méndez, C., Gómez, M., Rúiz, L., & Travassos, B. (2019). Goalkeeper as an outfield player: Shooting chances at critical moments in elite futsal. International Journal of Performance Analysis in Sport, 19(2), 179–191. doi:10.1080/ 24748668.2019.1581967
Méndez, C., Gómez-Ruano, M., Ruiz, L., & Cui, Y. (2017). Unfavorable critical moments and way of facing them from the futsal coach’s point of view through ad hoc questionnaire. RICYDE. Revista Internacional de Ciencias del Deporte, 13(50), 331–355. doi: 10.5232/ricyde2017.05002
Mendez, C., Gonçalves, B., Santos, J., Ribeiro, J., & Travassos, B. (2019). Attacking profiles of the best ranked teams from elite futsal leagues. Frontiers in Psychology, 10, 1370. doi: 10.3389/fpsyg.2019.01370
Méndez, C., & Méndez, V. (2005). Madrid Patent No. 2.622.587. O. E. d. P. y. Marcas.
Miloski, B., Pinho, J., Gobo, C., Rebouças, P., & Schultz, A. (2014). Quais ações técnico-táticas realizadas durante as partidas de futsal podem discriminar o resultado de vitória ou derrota? Revista Brasileira De Educação Física E Esporte, 28(2), 203–209.
Moore, R., Bullough, S., Goldsmith, S., & Edmondson, L. (2014). A systematic review of futsal literature. American Journal of Sports Science and Medicine, 2 (3), 108–116. doi: 10.12691/ajssm-2-3-8
Navarro, R., Gómez, M., Lorenzo, J., & Jiménez, S. (2013). Qualitative analysis of critical moments in basketball. Revista de Psicología del Deporte, 22(1), 249–251. Navarro, R., Lorenzo, A., Gómez, M., & Sampaio, J. (2009). Analysis of critical moments in the league ACB 2007-08. Revista de Psicología del Deporte, 18(3), 391–395.
Newton-Ribeiro, F. (2011). A influência do goleiro linha no resultado do jogo de futsal. RBFF-Revista Brasileira De Futsal E Futebol, 3(9), 187–198.
Paz-Franco, A., Bores-Cerezal, A., Barcala-Furelos, R., & Mecias-Calvo, M. (2014). Analysis of the conducts of elite futsal goalkeeper in the different situations of the game. American Journal of Sports Science and Medicine, 2(3), 71–76. doi: 10.12691/ajssm-2-3-1
Pereira-Guimarães, P., Neves, J., Rodrigues, E., & Coppi, A. (2010). O número de faltas não teve influência no resultado do mundial de futsal de 2008. RBFF-Revista Brasileira De Futsal E Futebol, 2(5), 116–121.
Poffo, I., & Lima, E. (2012). Análise dos gols na primeira fase da liga de futsal 2012. RBFF-Revista Brasileira De Futsal E Futebol, 4(12), 118–123.
Robinson, G., & O’Donoghue, P. (2007). A weighted kappa statistic for reliability testing in performance analysis of sport. International Journal of Performance Analysis in Sport, 7(1), 12–19. doi: 10.1080/24748668.2007.11868383 Sampaio, J., Lorenzo, A., & Ribeiro, C. (2006). Momentos críticos en los partidos
de baloncesto: Metodología para identificación y análisis de los aconteci-mientos precedentes. Cultura, ciencia y deporte: revista de ciencias de la actividad física y del deporte. Universidad Católica de San Antonio, 2(5), 83–88. Sampedro, J., & Prieto, J. (2011). La territorialidad como factor asociado a la ventaja de jugar en casa. Un estudio comparativo por regiones en la liga de fútbol y en la liga de fútbol sala de España. European Journal of Human Movement, 1(26), 93–104. Sampedro, J., & Prieto, J. (2012). El efecto de marcar primero y la ventaja de jugar
en casa en la liga de fútbol y en la liga de fútbol sala de España. Revista de Psicología del Deporte, 21(2), 301–308.
Schnell, A., Mayer, J., Diehl, K., Zipfel, S., & Thiel, A. (2014). Giving everything for athletic success!–Sports-specific risk acceptance of elite adolescent athletes. Psychology of Sport and Exercise, 15(2), 165–172. doi: 10.1016/j. psychsport.2013.10.012
Siqueira, O., Da-Silva, M., Aragonez, V., Damico, J., & Crescente, L. (2016). O tempo de incidência dos gols em equipes de diferentes níveis competitivos da liga nacional de futsal. Revista Brasileira De Ciências Do Esporte, 36(2), 789–801. Travassos, B., Araújo, D., Vilar, L., & McGarry, T. (2011). Interpersonal coordination
and ball dynamics in futsal (indoor football). Human Movement Science, 30 (6), 1245–1259. doi: 10.1016/j.humov.2011.04.003
Vicente-Vila, P. (2012). La influencia del portero-jugador en la eficacia ofensiva de un equipo de fútbol sala. Futbolpf: Revista De Preparacion Física En El Futbol, 1 (5), 29–43.
Vicente-Vila, P., & Lago-Peñas, C. (2016). The goalkeeper influence on ball possession effectiveness in futsal. Journal of Human Kinetics, 51(1), 217–224. doi: 10.1515/hukin-2015-0185
Viera, A., & Garrett, J. (2005). Understanding interobserver agreement: The kappa statistic. Family Medicine, 37(5), 360–363.
Volker, M. (2006). Reporting effect size estimates in school psychology research. Psychology in the Schools, 43(6), 653–672. doi: 10.1002/ pits.20176