1
Technological Adjustments in Textile,
Clothes and Leather Industries: An
Alternative Pathway for Competitiveness
Marisa Cesário1 & Maria Teresa de Noronha Vaz2
CIEO – Research Centre for Spatial and Organizational Dynamics University of Algarve, Portugal
1
Abstract
Labour-intensive industries, located in medium/high-cost areas are presently facing increasing low-cost competition and outsourcing with tremendous consequences at the regional employment level. The ability to react and technologically adjust to the challenges of these harder market conditions is what determines whether a region is a producer of high value-added goods or just a merely subcontractor. In fact, alternative employment opportunities may arise from complementary areas linked to technological innovations and although one can expect further job decline in manufacturing productive units, it is also expectable that more qualified jobs may be created in complementary areas, such as design, marketing, retail and
management.
The first objective of the present research is to characterise the process of adoption of new technologies in textile, clothes and leather (TCL) sectors from a group of Southern European regions, characterised by their economic vulnerability and dependence on these sectors. The results revealed that we are in the presence of a process: a) developed internally; b) supplier dominated and c) motivated by the international market.
The second objective is to observe the impacts of technical change on local employment structures, namely regarding employment levels and skills. The results indicate that firms investing in new plant and equipment and firms investing in the development of new products are more likely to be increasing employment than the others. Also, firms hiring in these sectors, look for adequate qualifications, in particular regarding the ability to work with internet and marketing technology tools.
We conclude that alternative pathways for competitiveness in these industries can be found through higher productivity levels driven from a much reduced workforce, if greater proportion of their turnover could be invested in technology and
employment qualification.
Acknowledgements: This paper has been partially supported by the Portuguese
2
1. Introduction
Labour-intensive industries, located in medium/high-cost areas are presently facing increasing low-cost competition and outsourcing with tremendous consequences at the regional employment level. The ability to react and technologically adjust to the challenges of this harder market conditions is what determines whether a region is a producer of high value-added goods or just a merely subcontractor. In fact, alternative employment opportunities may arise from complementary areas linked to technological innovations and although one can expect further job decline in manufacturing productive units, it is also expectable that more qualified jobs may be created in complementary areas, such as design, marketing, retail and management.
The first objective of the present research is to describe the process of adoption of new technologies in textile, clothes and leather (TCL) sectors from a group of Southern European regions. The way how technological capabilities depend on localized assets vary according to the type of sectors and regions considered. This first diagnostic allows to better understand the technological dynamics of labour-intensive industries located in European regions highly specialized in TCL sectors and strongly affected by low-cost competition. We are also interested in observe the impacts of such behaviors on local labour demand. Given the labour-intensive nature of these sectors, those impacts are expected to be significant.
Finally, we argue that technological adjustment strategies are crucial for regional employment and income perspectives since they provide alternative pathways for
competitiveness in regions were low-strategies are not able to supply competitive advantages.
2. Regional competitiveness in the global economy
Economic globalisation is leading firms to face an increasingly openness to rival producers, whatever their original location of production. Not only firms but also industries and regions are now much more vulnerable to price and quality competition. Camagni (2002) suggests that regions compete on the basis of absolute competitive advantages, arising when a region possess superior technological, social, infrastructural or institutional assets, which are external to firms but of their benefit. Territories compete with one another and both attractiveness and local competitiveness depend on similar common factors, which goes beyond physical conditions and refer to relational capital and the learning capacity expressed by the territory. This approach and other similar ones stress the discussion on how important is geographic proximity for the strategic
positioning of firms (Hudson, 1999; Kirat and Lung, 1999; Malmberg and Maskell, 1997).
Agglomeration is significant since it facilitates transactional interactions and increase opportunities for matching needs and capabilities, for instance: it eases the dynamics of backward and forward inter-linkage of firms, it allows the formation of dense local labour markets around multiple workplaces and, it facilitates the emergence of localised relational assets promoting learning and innovation effects (Storper and Harrison, 1991; Scott and Storper, 1992). The advantages of location proximity go beyond transactional efficiencies, and include various kinds of externalities, such as knowledge spillovers and dependence on human relations, rules and customs that enable
3
firms to coordinate under conditions of uncertainty.
This nexus of untraded interdependencies (Storper, 1995) correspond to regionalized relationships that extend beyond traditional customer/supplier links and embrace formal and informal collaborative and information networks. Inspired in
evolutionary economics this argument states that technological change is path dependent because it involves interdependencies between choices made over time. These choices have a spatial dimension, and though direct input-output relations may play a role, when organisations travel along a technological trajectory they have interdependencies that are untraded and include labour markets, conventions, common languages and rules. Those links are said to be in the basis of the regional competitive advantages, even facing globalization and economic integration.
In spite of increasing global flows of ideas, capital, goods and labour, the role of proximity in the creation of economically-useful knowledge appears to be even more important than before (Scott et al., 2001; Scott and Storper, 2003; Sonn and Storper, 2008).
This is even truer when considering the specific case of small firms. Contrarily to big firms, SMEs interact intensely with the territory in which they locate, as a signal of their embeddedness. The particular tight links they develop with the external
environment also reduce uncertainty risks. In general, SMEs do not only locate nearby the residence of their owners but also the geographical and sociological proximities
constitute their main sources of assets and information (Julien, 1995; Vaz, 2006). This fact determines the perspectives and strategic choices of the firms, because most of the market perception arises from the inputs that the territorial institutional context supplies. Small firms learn from close interaction with suppliers, customers and competitors and knowledge processes are deeply influenced by local resources, institutions, social and cultural structures (localised capabilities). Most of the small and medium sized companies and respective entrepreneurs are to a large extent generated by the local context and, in order to face changing and uncertain economic conditions, their decision-making process is firmly based on socialised practices, thereby stressing the importance of geographic proximity as a mediating factor (Camagni, 2002).
When referring to technological trajectories, Dosi (1988) mentions the importance of both the public elements of knowledge, constructed upon the interdependencies
between sectors, technologies and firms that represent a structured set of technological externalities for individual companies, but also the local and firm-specific technological competences. Those competences were labelled by Cohen and Levinthal (1990) as firm's absorptive capacity. The authors argue that the ability of a firm to recognize the value of new, external information, assimilate it, and apply it to commercial ends is critical to its innovative capabilities. A similar idea is given by Julien et al. (1999) arguing that the main factor distinguishing SMEs using new technologies from those continuing to use traditional equipment are management quality and the organization’s ability to obtain and process technological information. The author define technological scanning as the activity through which the external information needed for technological change is gathered, analysed and disseminated in the firm. Firm’s human capital endowments and networking aptitudes play an important role in this context (Cesário and Vaz, 2008; Vaz et al., 2006; Vaz and Cesário, 2008).
We believe that, as a result of different regional settings’ attributes, entrepreneurs may develop different technological abilities. When considering the European labour-intensive industries, those abilities may represent a crucial competitive advantage, given the inability to win low-cost competition. The fact that these industries are, in most cases,
4
located in highly specialised territorial agglomerations, represents an important issue. The question is then, why are labour-intensive European industries losing competitive
advantages for their low-cost competitors? And, which are the alternative pathways for their long-term success?
The competitive advantages of high-cost regions are mainly based on the use of territorial inputs, which allow firms to differentiate according to their technological trajectory. Although those trajectories are largely territorially path dependent, there is a growing list of territorial inputs being transformed in ubiquities as the outcome of the ongoing globalization process. Maskell and Malmberg (1999) and Maskell et. al (1998) used the term ‘ubiquitification’ to describe the process whereby former tacit knowledge gradually becomes codified, so in open markets and when knowledge of new
technologies and new organisational designs become globally available, firms in low-cost areas become more competitive.
When a localised input becomes a ubiquity, regional specialisation patterns and competitive levels are consequently jeopardised. Firms may respond through cost
reduction or knowledge creation. The first strategy means the relocation of manufacturing production activities and the consequent job lost in high-cost areas. The second strategy means the creation of new territorialised inputs, through the development on new tacit and non-traded knowledge.
We believe that the competitiveness of labour-intensive European industries depends on the capacity to develop the second strategy, inescapably combined with the first.
3. Method
3.1. Question addressed
Assuming the importance of localised assets for the technological capabilities of small firms, the first question addressed is:
Q1: How do firms’ human capital endowment and networking aptitudes affect
firms’ technological adjustment strategies?
More than to prove such causal-effect relation, we expect to identify the most significant effects produced by localised assets upon the technological capabilities of European labour-intensive firms.
Secondly, we expect that the adoption of new technologies influence the structure of the workforce at the firm-level. Not only regional employment perspectives are likely to be affected, also the need for adequately skilled employees is expected to vary. The second question addressed is:
Q2: How does the adoption of new technologies influence the regional labour
demand?
5
Figure 1: Methodological framework
In order to answer Q1, the following variables were considered as indicators of human capital and networking aptitudes: employees, type of ownership and management, supply/distribution/customers’ networks and institutional links.
We rely on Hall (1987), who distinguishes between general environments and specific (or task) environments. Firms’ general environments include technological, legal, economic, demographic and cultural conditions and the second includes customers, suppliers, competitors, industry associations, universities, and so on. While firms can hardly influence the first, task environments correspond to the firms’ decisional space, allowing different strategic options, particularly those that concern technology.
The literature review suggested that regional settings can provide an essential level of economic coordination and be a major source of region-specific material and non-material assets (network collaborations, untraded interdependencies or associational behaviours are concepts supporting this idea).
When referring to technological trajectories, Dosi (1988) mentions the importance of both the public elements of knowledge, as untraded interdependencies between
sectors, technologies and firms that represent a structured set of technological externalities for individual companies, but also the importance of the local and firm-specific technological competences.
As mentioned by Pavitt (quoted in Dosi, 1988), textile, clothing and leather sectors belong to what he called the supplier-dominated group of sectors, where:
‘…innovations are mainly process innovation: innovative opportunities are generally embodied in new varieties of capital equipment and intermediate inputs, originated by firms whose principal activity is outside these sectors themselves. Thus the process of innovation is primarily a process of diffusion of best-practice capital-goods and of innovative intermediate inputs…The knowledge base of innovation in these sectors mainly relates to incremental improvements in the equipment produced elsewhere, to its efficient use and to organisational innovations. Appropriability of firm-specific technological capabilities is rather low and firms are typically not very big…’
In the previous approach we note two major ideas: the importance of the contacts developed among firms along the productive chain, as important sources of technological knowledge, and the importance of efficiency and organisational innovations, where employees and managers play an essential role.
Malecki and Poehling (1999) suggest that the ‘personality’ of the small firm reflects the personality of its owner/manager. With regard to the search of external information, the authors classify this personality as extrovert or introvert type,
distinguishing between different abilities to obtain technical and engineering information. In agreement with these considerations, and in order to answer Q1, the following research hypotheses are proposed:
H1: The origin of the firms’ employees is a significant predictor of the adoption of new technologies.
6
H2: The upgrading of skills of employees is a significant predictor of the adoption of new technologies.
H3: The type of ownership is a significant predictor of the adoption of new technologies. H4: The type of management is a significant predictor of the adoption of new
technologies.
The review of literature also suggests the importance of supply, distribution and customer links, recognising that small firms frequently form component parts of extended networks with different possible geographies (local, regional, national, EU, and
international). By accessing other markets, assets and technologies, the firms release themselves from the limits of local and internal competences and gain control over the technological trajectories of their competitors (Camagni, 1991, 1995).
H5: The scope and geography of firms’ networks are significant predictors of the adoption of new technologies.
The informal contacts that occur inside firms, or between them and other surrounding agents, are also seen in the literature as important sources of technological knowledge. The term ‘untraded interdependencies’ was used by Storper (1995) to define regionalized relationships which extend beyond traditional customer/supplier links (also referred as input-output linkages or traded interdependencies) and embrace formal and informal collaborative and information networks. With a similar view but a different conceptualisation, Cooke and Morgan (1998) refer to a collective social order that induces firms to collaborate and display ‘associational behaviours’. The interactive learning among business networks is argued to be the most effective and credible way for knowledge acquisition (Morgan, 1996). In agreement with these concepts, the following research hypothesis is also proposed:
H6: The nature of institutional links is a significant predictor of the adoption of new technologies.
After analysing the factors that better explain different behaviours towards technological change, the question then addressed is Q2: How do those technological adjustments impact on local labour demand?
The literature revision suggests that there is consistently positive association between proxies for technical change and employment, as in the empirical surveys developed by Chennells and Van Reenen (2002); Van Reenen (1997); Enfort, Gollac and Kramarz (1999) or Blanchflower and Burgess (1998) and that the type of technological advances (product, process or organisational innovations) matters in this process, as shown in Smonly (1998), Greenan and Guellec (2000) or Osterman (2000).
In agreement with this theoretical and empirical framing, and in order to answer Q2, the following research hypotheses are considered:
H7: The adoption of new technologies affects the employment at the firm-level in TCL sectors.
H8: The type of technologies adopted affects the employment at the firm-level in TCL sectors.
These hypotheses are tested in the following sections.
3.2. Sampling
Empirically, the analysis is based on the application of a common questionnaire to a sample of 167 small-and medium-sized firms from the clothing, textile and leather sectors (table 1) belonging to the following southern European areas: North (Portugal), Valencia (Spain), Macedonia (Greece) and South Italy (Italy).
7
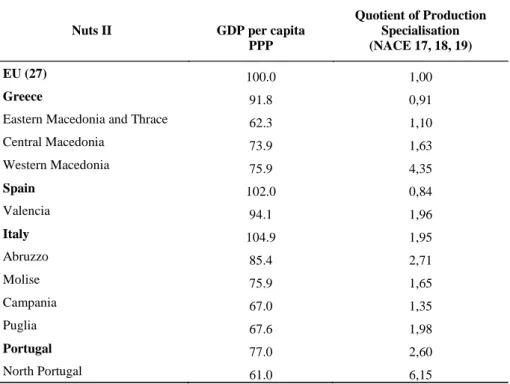
This set of regions was selected given their economic vulnerability established in three common features: a) this set of regions is lagging behind the EU-27 average in terms GDP per capita; b) their heavy industrial tissues are mainly composed by labour-intensive activities, the ones most affected by low-wage competition and c) their peripheral
geographic location constitutes an economic restraint (see Table 2).
Table 1: Sample distribution by region and sector Footwear and Leather Products Textiles and clothes Total North, Portugal 14 52 66 Greek Macedonia 14 36 50 South Italy - 24 24 Valencia, Spain 15 12 27 Total 43 124 167
Source: Author’s elaboration.
Table 2: GDP per capita and QPS regional values: 2005
Nuts II GDP per capita
PPP Quotient of Production Specialisation (NACE 17, 18, 19) EU (27) 100.0 1,00 Greece 91.8 0,91
Eastern Macedonia and Thrace 62.3 1,10
Central Macedonia 73.9 1,63 Western Macedonia 75.9 4,35 Spain 102.0 0,84 Valencia 94.1 1,96 Italy 104.9 1,95 Abruzzo 85.4 2,71 Molise 75.9 1,65 Campania 67.0 1,35 Puglia 67.6 1,98 Portugal 77.0 2,60 North Portugal 61.0 6,15
Source: EUROSTAT data.
3.3. Statistical data and methodology
In order to answer Q1, the following variables (listed in table 3) are used as predictors of the probability of adoption on new technologies by firms: employment sources (EMPLS); type of ownership (OWNE); type of management (MANG); supply, distribution and customers networks (NETS, NETD, NTEC); institutional links (LINK) and skills’ upgrading of employees (SKILL).
The variable EMPLS distinguishes among four different sources of employment: family members, local community, people from outside the region and parent firm (four different binary variables are considered).
8
Table 3: Description of database variables for answering Q1
Question Variable Description Codification
Predictor variables Q8a) Q8b) Q8c) Q8d) Q10 Q11 Q15a) Q15b) Q15c) Q15d) Q15e) Q17a) Q17b) Q17c) Q17d) Q17e) Q19a) Q19b) Q19c) Q19d) Q37a) Q37b) Q37c) Q37d) Q37e) Q43rec EMPLS EMPLSa) EMPLSb) EMPLSc) EMPLSd) OWNE MANG NET NETSa) NETSb) NETSc) NETSd) NETSe) NETDa) NETDb) NETDc) NETDd) NETDe) NETCa) NETCb) NETCc) NETCd) LINK LINKa) LINKb) LINKc) LINKd) LINKe) SKILL Employment Sources Family members Local community
People from outside the region Parent firm
Type of Ownership
Type of Management
Supply, distribution and customers networks
Suppliers: associated local firms Suppliers: other local/regional firms Suppliers: national firms
Suppliers: EU firms Suppliers: international firms Distributors: associated local firms Distributors: other local/regional firms Distributors: national firms
Distributors: EU firms Distributors: international Customers: local/regional market Customers: national market Customers: EU market Customers: international market
Institutional links
Internal personnel Customers Suppliers
Industry associations Universities and/or colleges
Skills’ upgrading of employees
1=yes; 0=no 1=yes; 0=no 1=yes; 0=no 1=yes; 0=no
1 = Owned by one person; 2 = A partnership; 3 = Family Owned; 4 = A limited company (reference category)
1 = The owner-manager; 2 = Other family personnel; 3 = External manager (reference category) 1=yes; 0=no 1=yes; 0=no 1=yes; 0=no 1=yes; 0=no 1=yes; 0=no 1=yes; 0=no 1=yes; 0=no 1=yes; 0=no 1=yes; 0=no 1=yes; 0=no 1=yes; 0=no 1=yes; 0=no 1=yes; 0=no 1=yes; 0=no 1=yes; 0=no 1=yes; 0=no 1=yes; 0=no 1=yes; 0=no 1=yes; 0=no 1=yes; 0=no Dependent variable
Q35rec TECH Adoption of technological changes 1=yes; 0=no
Source: Author’s elaboration
Regarding the type of ownership (OWNE) firms may be owned by one person, a partnership, family owned or a limited company. According to the type of ownership, different management situations are possible. The variable MANG aggregates the following options regarding the firm’s manager: owner-manager, other family personnel or external manager.
The variable NET includes supply (NETS), distribution (NETD) and customer (NETC) links. The first two distinguish among five different possible network
geographies: associated local firms, other local/regional firms, national firms, EU firms and international firms. Firms’ sales destination may be: local/regional markets, national markets, EU markets or international markets.
9
sources of technological knowledge by sample firms and differentiates among internal personnel, customers, suppliers, industry associations and universities/colleges.
Finally, sample firms were also examined with respect to the upgrading of their employees’ skills. The variable SKILL is measured by a binary scale (1 = yes; 0 = no).
The adoption of new technologies by the sample firms – TECH, also measured by a binary scale (1 = yes; 0 = no) was used as a dependent variable.
To obtain observable measures of technology (Chennells and Van Reenen, 2002) we distinguish between three types of measures: inputs into the knowledge production function, outputs from the knowledge production function and subsequent diffusion of these outputs around the economy. Inputs are generally measured by R&D activities. Although R&D expenditure has the advantage of being measured in a reasonably
standard way, it has a disadvantage related to spillovers. A firm might invest significantly in R&D without receiving any benefit from it, either in the form of innovation for the firm or in the form of the ability to learn from other firms’ innovations. Patents, on the other hand, are a widely available and standard way of measuring the outputs of
knowledge. However, a large number patents appear to be of very low value, and there is no obvious method of measuring them when this factor is taken into account.
According to the authors, diffusion measures seem to be closely related to what is usually thought of as technology. Examples of diffusion measures proposed by Chennells and Van Reenen (2002) are: the use of computers in a firm (word processors,
mainframes); the production-based technologies (lasers, robots, CAD, CAM); the weight of usage (the proportion of people using the computer), and so on.
Based on these ideas, and having in mind that the sample is composed by small-and medium-sized firms from low-tech sectors small-and located in vulnerable European regions (where R&D departments and patents are remote realities) the following technology measures were considered in the present survey:
(a) inventory control (e.g. PC, software, etc.) (b) production process technology (e.g. CAM) (c) product design technology (e.g. CAD)
(d) marketing technology (e.g. internet, websites, etc.) (e) e-mail/ website/ internet
(f) business to business electronic networks
The firm was considered to have adopted new technologies if, at least two of the previous technologies were adopted in the past three years. This criterion was considered to be of good sense taking into account the possible combinations of answers given by the firms.
The quantitative contribution of each of the previous predictors was compared using a binomial logistic regression model constructed by iterative maximum likelihood estimation (MLE), as given by the following equation:
r r r r r r
logit(TECH)= + EMPLS + SKILL+ OWNE+ MANG+α β γ δ ε ζ NET +ηLINK , (1) where r stands for the option of the corresponding question, when variables are subdivided in different yes/no options, each one corresponding to a binary variable itself (see table 3).
For the binomial logistic regression, the predicted dependent variable is a function of the probability that a particular subject will be in one of two categories. In this case, the probability that sample firms adopted new technologies in the past three years (TECH=1). The logistic regression will predict the logit, that is, the natural log of the odds, given by ln P(TECH
{
=1) 1 P(TECH[
− =1)]
}
.The results for the set of recommendedprocedures and statistical tests developed in order to assure the adequacy of the model are subsequently presented.
10
In order to answer Q2, the variation in firms’ employment is used as dependent variable and the following variables as predictors (listed in table 4): variation in sales;
investments; variation in the need for adequately skilled employees; adoption of new technologies and their type.
The dependent variable EMPL stands for the variation in firms’ employment and distinguishes among three levels: employment has decreased, remained about the same or increased, over the past three years.
Careful was taken when considering the proxies for technological adjustment strategies. When analysing the impacts of technical change on employment a wide diversity of variables can be found:
- technical changes in general: Blanchflower and Burgess (1998), Van Reenen (1991);
- product or process innovations: Greenen and Guellec (1997), Smonly (1998); - organisational innovations: Osterman (2000), Black et al. (2004);
- computer use: Enfort et al. (1999) ;
- R&D intensity: Brouwer et al. (1993), Klette and Førre (1998).
This diversity clearly indicates the complexity around the assessment of technological strategies in firms. Dealing with small and medium sized firms from textiles, clothes and leather sectors, where innovative activities are embodied in new varieties of capital equipment and intermediate inputs (as discussed in chapter four), the variables selected as indicators of technological strategies intend to reflect this reality.
Firstly, it is expected that the variation in firms’ employment depend on the adoption or not of new technologies as well as on the type of technologies adopted.
Variable ATECH distinguishes among six different types of new technologies: inventory control (e.g. PCs, software etc.); production process technology (e.g. CAM); product design technology (e.g. CAD); marketing technology (e.g. internet, web sites etc); e-mail/ web site/ internet; business to business electronic networks. Six binary variables are considered.
Variable TECH is similar to the previous but has a yes/no possibility standing directly for the adoption or not of new technologies by the sample firms, as used in the first empirical analysis.
Additional information on firms’ technology-related strategies is given by the variable INV, used to identify the different investments made by firms: new plant and equipment; information technology; purchase of patents and licensing; development of existing products; development of new products.
Variable NSKILL stands for the variation in firms’ need for adequately skilled employees and it is included as it comprises complementary valid information on firms’ technological activities. Three levels are considered: the need for adequately skilled employees has decreased, remained about the same or increased, over the past three years.
11
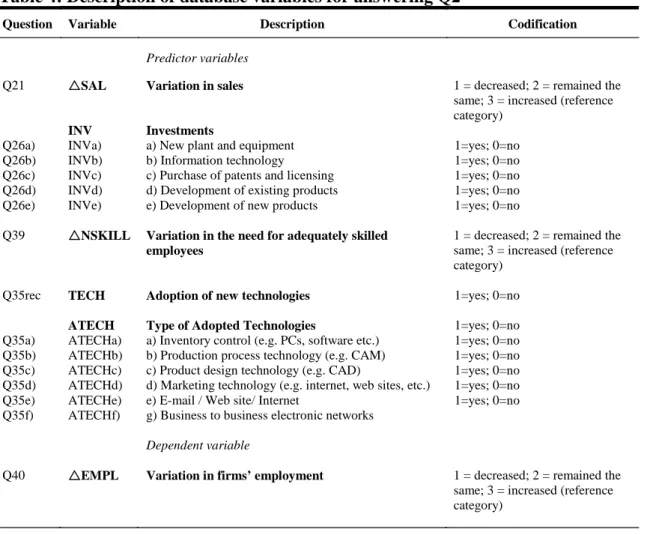
Table 4: Description of database variables for answering Q2
Question Variable Description Codification
Predictor variables Q21 Q26a) Q26b) Q26c) Q26d) Q26e) Q39 Q35rec Q35a) Q35b) Q35c) Q35d) Q35e) Q35f) SAL INV INVa) INVb) INVc) INVd) INVe) NSKILL TECH ATECH ATECHa) ATECHb) ATECHc) ATECHd) ATECHe) ATECHf) Variation in sales Investments
a) New plant and equipment b) Information technology c) Purchase of patents and licensing d) Development of existing products e) Development of new products
Variation in the need for adequately skilled employees
Adoption of new technologies Type of Adopted Technologies
a) Inventory control (e.g. PCs, software etc.) b) Production process technology (e.g. CAM) c) Product design technology (e.g. CAD)
d) Marketing technology (e.g. internet, web sites, etc.) e) E-mail / Web site/ Internet
g) Business to business electronic networks
1 = decreased; 2 = remained the same; 3 = increased (reference category) 1=yes; 0=no 1=yes; 0=no 1=yes; 0=no 1=yes; 0=no 1=yes; 0=no
1 = decreased; 2 = remained the same; 3 = increased (reference category) 1=yes; 0=no 1=yes; 0=no 1=yes; 0=no 1=yes; 0=no 1=yes; 0=no 1=yes; 0=no 1=yes; 0=no Dependent variable
Q40 EMPL Variation in firms’ employment 1 = decreased; 2 = remained the same; 3 = increased (reference category)
Source: Author’s elaboration
Finally, variable SAL stands for the variation in firms’ sales and also distinguishes among three levels: sales has decreased, remained about the same or increased, over the past three years. This variable allows identifying possible impacts on employment variation driven by market expansion/recession.
Given the ordinal nature of the dependents, the ordinal regression model was selected to build the following equation:
j j r r r r
ln(θ = α − β∆) ( SAL+ γ INV + δ∆NSKILL+ εTECH+ ζ ATECH ) (2), with j prob(score j) (1 prob(score j))
θ = ≤ − ≤ , where j goes from 1 to the number of categories minus 1 and r for the option of the corresponding question, when variables are subdivided in different yes/no options, each one corresponding to a binary variable itself (according to table 4).
This procedure allows evaluating the importance of various predictor variables in cases where the dependent variable is ordinal. In ordinal logistic regression, the event of interest is observing a particular score or less (cumulative probabilities). That is why there is a minus sign before the coefficients, so that larger coefficients indicate an association with larger scores, which in this case means smaller cumulative probabilities for lower scores. In this case, for the variation in employment, the following odds are modelled: θ =1 prob(score=1) prob(score>1) ,θ =2 prob(score=1or2) prob(score>2) ,where a score equal to 1, 2 or 3 means that the employment has decreased, remained about the same or increased over the past three years.
12
4. Results
4.1. Results for the first question addressed
According to Menard (1995) the first and most important assumption in logistic regression is that the model is correctly specified. One crucial component of correct specification is the correct functional form of the model. Logistic regression does not require linear relationships between the independent factors or covariates and the dependent – as does OLS regression – but it does assume a linear relationship between the independents and the log odds (logit) of the dependent. When the assumption of linearity in the logit is violated, then logistic regression will underestimate the degree of relationship of the independents to the dependent and will lack power (generating Type II errors, assuming that there is no relationship when there actually is). To assess linearity, as suggested by Menard (1995) the proposed model was compared with a larger model, including the square and cubic values of the original independent variables1
Another issue to avoid is multicollinearity among variables. High
multicollinearity is a problem as it affects the reliability of the coefficients. In this case, the highest correlation registered among two independent variables was 0.633, which does not represent a problem.
. The coefficients associated with these variables are jointly non-statistically significant
(p=0.531), that is, there is no evidence of nonlinearity between the logit of the dependent variable and the set of independent variables.
Following these procedures, the logistic regression results are presented. These results include statistics for: the goodness-of-fit of the model (chi-square statistics), the estimated parameters, and the predictive capacity of the model (annex 4.1 provides detailed information).
The model’s goodness-of-fit was assessed using the Omnibus test of model coefficients – the null hypothesis that the coefficients of the variables are all jointly equal to zero was rejected (p = 0.000) – and the Hosmer and Lemeshow test – the null
hypothesis that the model adjusts well to the data is not rejected (p = 0.574).
Table 5 lists the b coefficients, the Wald statistic and its significance, and the odds ratio, for the final independent variables in the model. The Nagelkerke R-square is also presented. Logit coefficients (logits), also called unstandardized logistic regression coefficients, are interpreted as the expected change in the propensity (log odds) to adopt new technologies for a unit change in the associated explanatory variable, holding all the other variables constant. Logit coefficients are easier to interpret when converted to an odds ratio using the exponential function. The odds ratios are simply measures of effect size and will be used to comment on their relative sizes when comparing independent variables effects.
1
13
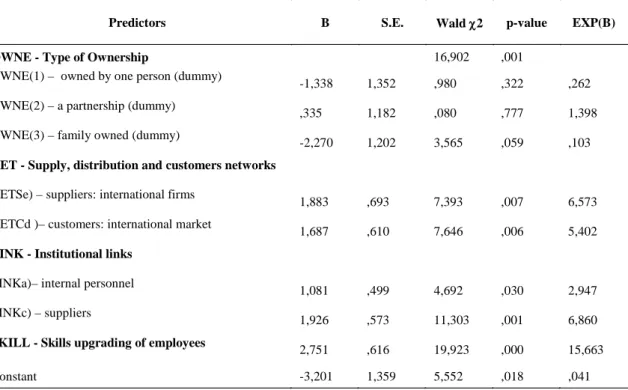
Table 5: Results of the estimation of a logistic regression model with the final independent variables
Predictors B S.E. Wald χ2 p-value EXP(B)
OWNE - Type of Ownership 16,902 ,001
OWNE(1) – owned by one person (dummy)
-1,338 1,352 ,980 ,322 ,262
OWNE(2) – a partnership (dummy)
,335 1,182 ,080 ,777 1,398
OWNE(3) – family owned (dummy)
-2,270 1,202 3,565 ,059 ,103
NET - Supply, distribution and customers networks NETSe) – suppliers: international firms
1,883 ,693 7,393 ,007 6,573
NETCd )– customers: international market
1,687 ,610 7,646 ,006 5,402
LINK - Institutional links LINKa)– internal personnel
1,081 ,499 4,692 ,030 2,947
LINKc) – suppliers
1,926 ,573 11,303 ,001 6,860
SKILL - Skills upgrading of employees
2,751 ,616 19,923 ,000 15,663
Constant -3,201 1,359 5,552 ,018 ,041
Nagelkerke R2=0.601
The Wald statistic is used to test the significance of individual logistic regression coefficients for each independent variable (that is, to test the null hypothesis in the logistic regression that a particular logit (effect) coefficient is zero).
Of the list of independents initially considered, the following ones are statistically significant: type of ownership (OWNE), suppliers – international firms (NETSe),
customers – international market (NETCd), sources of technological knowledge –
internal personnel (LINKa), sources of technological knowledge – suppliers (LINKc) and employees’ skills upgrading (SKILL). All the others are not.
As stated earlier, the analysis of the odds rations allows comparing the effect size of each one of the independents on the odds of the dependent. In other words, among the significant predictors earlier identified, it is possible to identify which ones produce bigger positive (odds ratios > 1) or negative (odds ratios < 1) effects on the odds of adoption of new technologies.
For instance, the odds of a firm in a partnership to adopt new technologies are 1.398 times the odds of a limited company2
From the 84 firms that adopted new technologies, 90.5% were correctly predicted , while the odds of a firm owned by one person or a family owned firm to adopt new technologies are 0.262 and 0.103 times, respectively, the odds of a limited company. The odds of a firm using international firms as suppliers and customers are 6.573 and 5.402 times, respectively the odds of a firm not using these networks. On the other hand, the odds of firms using internal personnel and suppliers as sources of technological knowledge are 2.947 and 6.860 times, respectively, the odds of firms not using these sources. Finally, the odds to adopt new technologies by firms upgrading employees’ skills are 15.663 times the odds of firms not doing it.
2
When the independent variable is categorical, the odds ratios need to be interpreted in terms of the left-out reference category, which in this case is the option: limited company.
14
(sensitivity), while from the 63 firms that did not adopt new technologies, 77.8% were correctly predicted (specificity)3
In order to test research hypothesis H1, H2, H3, H4, H5 and H6, the likelihood of the model with all the independent variables was compared with the likelihood of the model without the variables implicated in each research hypothesis.
. The overall percent of correctly predicted cases is 85% which is very reasonable.
In testing the first research hypothesis, H1, that the origin of firms’ employees is a significant predictor of technological behaviour, the null hypothesis is
0 11 2 3 4
H
:
β = β = β = β =
0
. In this case, H01 was not rejected (p=0.899), meaning that the origin of employees (family members, local community or outsiders) is not a significant predictor.With respect to the second hypothesis, H2, that the employees’ skills upgrading is a significant predictor, the null hypothesis (
H
02:
γ =
0
) was rejected (p=0.000)indicating the importance of employment qualification, as one basic condition for the industry capacity to survive in the present competitive environment.
In the third research hypothesis (H3), which states that the type of ownership is a significant predictor, the null hypothesis (
H
03:
δ =
0
) was rejected (p = 0.002), meaning statistical evidence in favour of H3. The individual parameter results (in table 4.5) demonstrate that the category ‘a partnership’ produces the higher positive effect on the probability of adoption of new technologies when compared with the other categories, indicating that the responsibility towards the partners (not necessarily family members) increases the pressure for better results and necessary changes.Regarding the fourth research hypothesis, H4, that the type of management is a significant predictor, there is statistical evidence in favour of
H
04:
ε =
0
(p=0.472), leading to the rejection of H4.Concerning the fifth research hypothesis, H5, that the scope and geography of the firms’ networks are significant predictors, the test was performed for the three network’ scopes considered: supply, distribution and customer networks, therefore testing
separately three null hypotheses:
H
05S, H
05D, H
05C . For the first case,H
05S, the likelihood of the model with all the independent variables was compared with thelikelihood of the model without the variables NETr, considering r=1...5, that is, variables NETSa, NETSb, NETSc, NETSd and NETSe. For the second case,
H
05D, the variables dropped were NETr, with r=6...10, that is, the variables NETDa, NETDb, NETDc, NETDd and NETDe. Finally, for the last case,H
05C, the restricted model dropped the variables NETr, with r=10...14, that is the variables NETCa, NETCb, NETCc and NETCd.The null hypothesis H0 :ζ = ζ = ζ = ζ = ζ =51 s2 3 4 5 0, was rejected (p=0.016), confirming the importance of the relationships with suppliers as a way of creating critical mass and exploit standardisation opportunities in the TCL sectors.
The null hypothesis H05D:ζ = ζ = ζ = ζ = ζ =6 7 8 9 10 0 , was not rejected (p=0.454), meaning that the use of different geographically located distributors is not a significant predictor.
3
Sensitivity and specificity are statistical measures of the performance of a binary classification test. Sensitivity measures the proportion of actual positives which are correctly identified as such and Specificity measures the proportion of negatives which are correctly identified.
15
Regarding the null hypothesis H05C:ζ = ζ = ζ = ζ =11 12 13 14 0, the result for the qui-square statistic with 4 degrees of freedom, means barely the rejection of this null hypothesis (p=0.062), indicating that the variables related with different geographically located customers are jointly nonstatistically significant. Nevertheless, considering such a small p-value, and taking into account the individual parameter result (table 5) for the use of international customers (p=0.006), this variable should not be ignored when drawing conclusions.
Indeed, the individual parameter results demonstrate that, in both situations, suppliers and customers networks, the contacts with international firms (networks’ geography) were the ones with statistical significance, producing positive effects on the odds of the adoption of new technologies by the sample firms. The importance of exploring international and quality conscious markets is corroborated by these results.
Finally, considering the sixth research hypothesis, H6, that the nature of institutional links is a significant predictor, the null hypothesis
0 16 2 3 4 5
H :η = η = η = η = η =0was rejected (p=0.000). Individual parameter results confirm the importance of the use of internal personnel (p = 0.030) and suppliers (p= 0.001) as sources of technological knowledge. These results validate again the
importance of employment qualification and skills but also suggest that the technological adjustment process in TCL sectors is substantially driven by supplier demanding
mechanisms.
So, in answering Q1, and also considering the different effect sizes produced by each one of the significant predictors (given by the individual parameter estimates, correspondent Wald statistics and odds ratios – table 5), it may be concluded that the adoption of new technologies is a process:
- developed internally, depending largely on the skills of workforce;
- supplier dominated, in the sense that the ideas, suggestions and/or impositions of suppliers (even more if international) play an important role in the technological process;
- motivated by the international market, as the importance of international customers is also present for firms engaged in technological changes.
4.1. Results for the second question addressed
For an adequate use of ordinal regression, some attention must be taken about the model assumptions. A first assumption is that the model does not support multiple dependents. Ordinal regression is used with one ordinal dependent (response) variable, where the independents may be categorical or continuous. Also, and as in other chi-square tests, there should be an adequate cell count. A rule of thumb is that 80% of cells should have a count of 5 or more, and no cells should have a zero count. This situation is confirmed in both cases. In ordinal regression there will be multiple regression equations, one for each level of the ordinal dependent except the highest. The regression lines are assumed to be parallel for each level of the dependent, indicating that the independents have the same relationship to the link function4
4
The link function specifies what transformation is applied to the dependent variable (that is, to the cumulative probabilities of the ordinal categories). Complementary log-log was used in the present regression as it is recommended when higher categories of the response variable are more probable than lower categories.
. This means that ordinal regression requires assuming that the effect of the independents is the same for each level of the dependent. If an independent is the variation of sales, for example, then the effect on the dependent for a
16
change in this variable should be the same whether the difference is between score 1 to score 2, or from score 2 to score 3. Violation of this assumption can render the use of ordinal regression inappropriate since estimates may be seriously biased. The ‘test of parallel lines assumption’ was performed in order to test this critical assumption.
The null hypothesis that the parameters are the same across response categories was not rejected (p=0.553).
Following these procedures, the ordinal regression results are presented for the model in equation 2. These results include statistics for: the goodness of fit of the model; the estimated parameters and the predictive capacity of the model.
The goodness-of-fit of the model was assessed both performing the likelihood ratio test – the null hypothesis that all predictors’ coefficients are jointly equal to zero was rejected (p=0.000) as well as the chi-square goodness of fit test – the null hypothesis of a well-fitting model was not rejected (p= 0.099 for the Pearson chi-square and p=0.621 for the deviance chi-square). Table 6 list the parameter estimates, the Wald statistic, its significance as well as the results for the Nagelkerke R-square.
As in other types of categorical analysis, parameter estimates are presented for all but the reference level of any given factor. A positive parameter estimate means that, for that value of the independent variable, the likelihood of higher scores on the ordinal dependent variable increase.
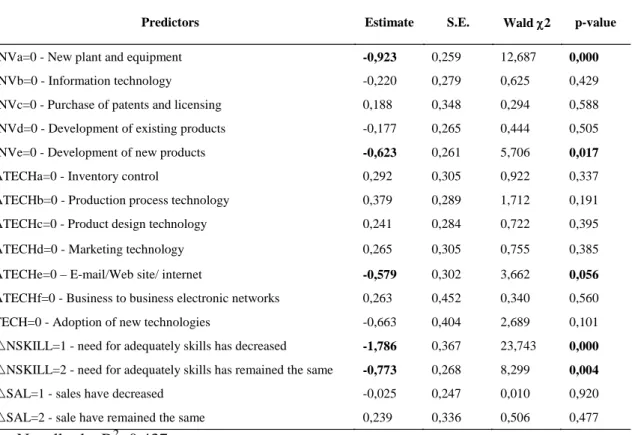
Table 6Results from ordinal regression estimation: dependent EMPL
Predictors Estimate S.E. Wald χ2 p-value
INVa=0 - New plant and equipment -0,923 0,259 12,687 0,000
INVb=0 - Information technology -0,220 0,279 0,625 0,429 INVc=0 - Purchase of patents and licensing 0,188 0,348 0,294 0,588 INVd=0 - Development of existing products -0,177 0,265 0,444 0,505 INVe=0 - Development of new products -0,623 0,261 5,706 0,017
ATECHa=0 - Inventory control 0,292 0,305 0,922 0,337 ATECHb=0 - Production process technology 0,379 0,289 1,712 0,191 ATECHc=0 - Product design technology 0,241 0,284 0,722 0,395 ATECHd=0 - Marketing technology 0,265 0,305 0,755 0,385 ATECHe=0 – E-mail/Web site/ internet -0,579 0,302 3,662 0,056
ATECHf=0 - Business to business electronic networks 0,263 0,452 0,340 0,560 TECH=0 - Adoption of new technologies -0,663 0,404 2,689 0,101 NSKILL=1 - need for adequately skills has decreased -1,786 0,367 23,743 0,000
NSKILL=2 - need for adequately skills has remained the same -0,773 0,268 8,299 0,004
SAL=1 - sales have decreased -0,025 0,247 0,010 0,920 SAL=2 - sale have remained the same 0,239 0,336 0,506 0,477
Nagelkerke R2=0.437
The Wald statistic is used to test the significance of individual logistic regression coefficients for each independent variable (that is, to test the null hypothesis that a particular coefficient is zero).
From the list of predictors initially considered, the following are statistically significant: Investment in new plant and equipment (INVa), Investment in the development of new products (INVe), Adoption of new technologies: email/web
17
site/internet (ATECHe) and the Need for adequately skilled employees (NSKILL). For dichotomous variables, like INVa, where level 0 is estimated and level 1 is the reference category, a negative coefficient (-0.923) means that the category coded 0 is more likely to have lower scores on the ordinal dependent (here, variation in
employment). This means that firms investing in new plant and equipment (INVa=1) are more likely to increase employment than the others.
The same happens with the investment in the development of new products and the use of internet tools, although in these cases the effects are slightly weaker (-0.623 and -0.579 respectively).
The stronger relation is found with the need for adequately skilled employees (-1.786). Firms decreasing the demand for skilled employees are less likely to be increasing employment in general.
The model achieves a reasonable predictive capacity. It correctly classifies 63% of the cases in the first category, 50.8% in the second and 62.9% of the cases in the third.
In testing the seventh research hypothesis (H7), that the adoption of new
technologies affects the employment at the firm-level in TCL sectors, the null hypothesis (H01:ε =0) was not rejected (p=0.101), meaning that the variable TECH is not
statistically significant. This first result confirms the difficulty in the selection of indicators of technical change. The uncertainty associated with the question: ‘Did the firm adopted new technologies in the past three years?’ may well explain this outcome. From the 167 inquired firms, 61.7% gave a positive answer to this question. That is why the model proposed included the investments in fact made by firms, in order to avoid ambiguity. Complementarily, the 5 null hypotheses H01':γ =r 0 were also tested, with r=1...5. From the observed significance levels in table 6, it is possible to reject
01' 1
H :γ =0 and H01':γ =5 0 , confirming the importance of the independent variables INVa - investment in new plant and equipment (p=0.000) and INVe – investment in the development of new products (p=0.017) in equation 2.
The coefficient parameters associated with these variables indicate that firms investing in new plant and equipment, and firms investing in the development of new products are more likely to present increasing employment than the others.
Although not directly related to H1, complementary information is given by the observation of the independent variables NSKILL and SAL. The null hypothesis
0
H :δ =0was rejected (p=0.000 and p=0.004 for the first and second levels of the variable), with the coefficient parameters indicating that firms increasing the demand for more skilled employees are more likely to be increasing employment. Finally, the
variation in firms’ sales (SAL) was not a significant predictor (H :0 β =0 was not rejected) in explaining the variation in firms’ employment (p=0.920 and p=0.477 for the first and second levels of the variable).
Following, and regarding the last research hypothesis (H8), that the type of technologies adopted also affects the employment levels, the results are less conclusive. From the 6 null hypotheses (H02:ζ =r 0, with r=1...6) only H02:ζ =5 0, which is related to the independent variable ATECHe - use of internet tools, was barely not rejected (p=0.056).
These results are not strong enough to confirm that the effects of technological advances on employment depend on the type of innovations being produced: more product, process or organisational oriented.
18
empirical evidence in other regions and support the recommendations made by the EU for TCL sectors to introduce high quality and creativity patterns, only achievable through investments in technology and innovation, in order to achieve competitiveness and employment growth.
5. Final remarks
The importance of the textile, clothing and leather sectors in Europe is recognisable. A predominantly small- and medium-sized enterprise (SME)-based industry with a turnover of more than 230 billion Euros produced in around 273 thousands enterprises, these sectors employ more than 3 million people in the EU27 5
The liberalisation process following the signature of the WTO Agreement, has increased import penetration in these sectors, with the EU industry experiencing serious difficulties in competing with foreign operators working with lower labour costs and less stringent social and environmental regulations.
.
The new global economy is getting firms to face two different phenomena: increasing competition, as a result of the liberalisation process, and increasing
outsourcing, in search of lower production costs. The result is an increasing job loss as the direct result of firms’ disinvestment, bankruptcy and delocalisation, in regions where economic issues are not able to provide employment alternatives.
Two strategic responses may be given by firms: cost reduction or knowledge creation. In labour-intensive industries, the first option means the relocation of
manufacturing production activities to low-cost areas. The second reveals to be the only alternative pathway for high-cost regions.
Given the restraints in winning through price competition, the quality argument appears as a strong weapon for the European industry. In contrast with the more price-competitive and scale advantageous industries of northern Europe, the medium-cost countries in the south have a customised fashion-oriented industry, which is less vertically concentrated and less oriented to outsourcing in low-cost countries.
It is important to investigate the technological dynamics of such enterprises in order to know whether or not they can profit from novel and creative extensions at the end of the value chain, thus improving job creation and turnover.
This research indicates that new dynamic competitive advantages emanate not from low-cost and low-wage production, but from the technological capacity of firms to produce high-value-added goods (in terms of quality, creativity, design and fashion) even for textiles, clothes and leather (TCL) industries. Their economic performance depends on their technological capabilities, and those depend on local learning processes. In the end, the adjustment capacity of local agents to new production technologies is what determines whether regions or firms are producers of high value-added sophisticated goods and services or merely low-cost subcontractors.
The learning and technological capacity of TCL firms is largely influenced by the relationship patterns that producers develop with their suppliers and customers. Those are essential to information exchange in sectors where the process of innovation is primarily a process of diffusion of best-practice (Dosi, 1988). Firms committed with export-production suffer serious decline when their products are not of a specialised nature. Low-cost production indicates the use of unskilled labour and firm inadequacy to
5
19
absorb and diffuse knowledge (Tsampra and Palaskas, 2002).
In the observed sample, the results confirmed that technological adjustment processes in TCL sectors from Southern regions are supplier- dominated, largely dependent on the qualifications of the workforce and motivated by the international market.
Besides the firm-specific technological competences, different technological trajectories may arise from different public elements of knowledge (Dosi, 1988). The role of regions in favouring the technological capabilities of firms is identified in the
territorialised forms of untraded interdependencies and intangible synergies among agents (Storper, 1995) that form a collective social order that induces firms to collaborate and display associational behaviours (Cooke and Morgan, 1998).
Technological investments allow raising quality and creativity patterns that are necessary for the industry survival given the present economic restraints. But those investments produce effects on the regional labour demand. In the sampled firms, the main effects of investment on the workforce are the demand for higher skilled employees but also the demand for more flexible temporary ones.
From the empirical observation of the sample, it was also possible to detect that the investments in new plants and equipments as well as the investments in the
development of new products are more related with employment increase than with employment decline. Such technological adjustments are preceded with the necessary upgrading of employment qualifications. These results corroborate the idea that the future of TCL sectors in Southern Europe requires higher quality standards, only possible trough technological advances and the correspondent employment qualification.
But not all firms have the capacity to carry out such investments. Difficulties in the access to credit and the uncertain of future benefits are factors that inhibited the adoption of new technologies in the observed group of firms. Technological and competitive adjustments are, therefore, made in a defensive way: firms respond to changes in sales by adapting production capacity to market demand, rather than reacting by upgrading their added value on the basis of their technological capabilities.
The tendency has been the employment decline in these industries with the increasing relocation of manufacturing jobs in low-cost areas. Only successful firms, the ones with higher technological capabilities, are able to develop the proper investments and create employment. In these cases, people employed are more flexible and with higher language and technological skills, hence able to work in the several
complementary areas of the textiles and fashion chain, such as design, marketing, management or sales.
But what is being done by successful firms? Table 4 summarises the most
important networking strategies being developed by successful companies across Europe. All of them implicate relocation and further job loss in manufacturing production. But we remark that relocation can be transformed in a positive strategic reality if firms are able to lower production costs and logistics in order to make the necessary technological
investments. Networking strategies reveal to be mandatory so costs can be reduced and investments in innovation, creativity and fashion can be made. One can expect further job decline in manufacturing productive units, but more qualified jobs in complementary areas, such as design, marketing, retail and management.
20
Table 7: Networking strategies implemented in successful companies across Europe
1. Brand and design strategies: competitiveness is drawn from a strong market identity and firms are positioned in the high or medium-high price ranges. As delocalisation is urged by the need to increase margins, marketing and retailing are key aspects for these industries.
• Localisation of value added (headquarters and design offices): High cost EU
• Localisation of production: Euromed + Asia + Medium cost EU (Hungary, Poland, Lithuania, Bulgaria, Romania - highly qualified multi-skilled operators with better price segment)
2. Partner strategies: firms position themselves as the industrial partner of their clients, selling components or finished products to be offered to the consumer, under their clients’ label.
• Localisation of value added (clients and partners’ headquarters): High cost EU
• Localisation of production: Euromed + Asia + Medium cost EU (Hungary, Poland, Lithuania, Bulgaria, Romania - highly qualified multi-skilled operators with better price segment)
3. Industry-retail strategies: gradual integration of retailing activities as the delocalisation of production increases.
• Localisation of value added (headquarters, local retail structure and part of production): EU and Euromed
• Localisation of production: Medium cost EU (for quality inputs) + Low cost areas close to the final market (proximity is important: short time responses, ease of communication, cultural proximity)
4. Subcontracting strategies: Business to business with customers, who have their own brands and stores. These strategies rely on flexibility, high level of specialisation, quick response and cost control so delocalisation is highly pressured due to the direct need for lower costs and local shortages in labour and capacity.
• Localisation of production: Medium cost EU + Euromed (flexibility + cost advantage)
Source: EC (2007)
The harder market conditions have brought a tremendous change in vision which may constitute a strong competitive advantage if more market oriented attitudes and less confrontational relationships in the value-chain are developed.
21
References
Black, S., L. Lynch & Krivelyova, A. (2004). How workers fare when employers innovate? Industrial Relations, 43(1), 44-66.
Blanchflower, D. & Burgess, S. (1998). New technology and jobs: comparative evidence from a two country study, Economics of Innovation and New Technology, 5, 109-138.
Brouwer, E., Kleinknecht, A. & J. Reijnen, J. (1993). Employment growth and innovation at the firm level: an empirical study, Journal of Evolutionary Economics, 3, 153-159.
Camagni, R. (1991). Local milieu, uncertainty and innovation networks: towards a new theory of economic space, in: R. Camagni (ed.), Innovation networks: spatial perspectives. Belhaven Press, London and New York, 121 – 144.
Camagni, R. (1995). Global network and local milieu: towards a theory of economic space, in S. Conti, E. Malecki and P. Oinas (eds.), The Industrial Enterprise and its environment: Spatial Perspectives, Avebury, England, 195 - 213.
Camagni, R. (2002) On the concept of territorial competitiveness: sound or misleading? Urban Studies, 39(13), 2395 – 2411.
Chennells, L. & Van Reenen, J. (2002). Technical change and the structure of employment and wages: a survey of the microeconometric evidence, in Greenan, N.,L’Horthy Y. & Mairesse J.
(eds.) Productivity, inequality and the digital economy: a transatlantic perspective, MIT
Press, 175-223.
Cohen, W. M & Levinthal, D. A. (1990). Absorptive Capacity: A new perspective on learning and innovation, Administrative Science Quarterly, 35, 128-152.
Cooke, P. & Morgan, K. (1998). The Associational Economy: Firms, Regions and Innovation, Oxford, Oxford University Press.
Cesário, M. & Vaz, M. T. N. (2008). How do small firms from European rural regions learn and innovate? WSEAS Transactions on Environment and Development, Vol.4, issue 10, 835-845, ISSN:1790-5079.
Dosi, G., Freeman, C.,Nelson, R., Silverberg, G. & Soete, L. (1988)(eds.). Technical change and Economic Theory, Pinter Publishers, London.
Enfort, H., Gollac, M. & Kramarz , F.(1999). New technologies, wages and worker selection, Journal of Labor Economics, 17(3), 464-491.
European Commission (2007). Study on the competitiveness, economic situation and location of production in the textiles and clothing, footwear, leather and furniture industries, Enterprise and Industry Directorate-General.
Greenan, N. & Guellec, D. (2000). Technological innovation and employment reallocation, Labour, 14(4), 547-90.
Hall, R. H. (1987). Organizations: Structures, Processes and Outcomes, 4th ed, Englewood Cliffs, N.J. Prentice-Hall.
Julien P. A. (1995). Economic Theory, Entrepreneurship and New Economic Dynamics, in S. Conti, E. Malecki and P. Oinas (eds.), The Industrial Enterprise and its environment: Spatial Perspectives. Avebury, England, 123 - 142.
Julien P.A., Raymond, L., Jacob, R. & Ramangalahy, C. (1999). Types of technological scanning in manufacturing SMEs: an empirical analysis of patterns and determinants,
Entrepreneurship and Regional Development, 11, 281-300.
Hudson, R. (1999). The learning economy, the learning firm and the learning region, European Urban and Regional Studies, 6(1), 59–72.
Kirat, T. & Lung, Y. (1999). Innovation and Proximity: Territories as loci of collective learning processes, European Urban and Regional Studies, 6(1), 27-38.
Klette, T. & Førre, S. (1998). Innovation and job creation in a small open economy: evidence from Norwegian manufacturing plants 1982-92, Economics of Innovation and New Technology, 5, 247-272.
22
Malecki, E. & Poehling, R. (1999). Extroverts and introverts: small manufacturers and their information sources, Entrepreneurship and Regional Development, 11, 247-268.
local, 59 - 73.
Malmberg, A. & Maskell, P. (1997). Towards an explanation of regional specialization and industry agglomeration, European Planning Studies, 5(1), 25-42.
Maskell, P. & Malmberg, A. (1999). The competitiveness of firms and regions: ‘ubiquitification’ and the importance of localized learning, European Urban and Regional Studies, 6(1), 9-25. Maskell, P.,Eskelinen, H.,Hannibalsson, I.,Malmberg. A. & Vatne, E. (1998) Competitiveness,
Localised Learning and Regional Development. Specialisation and Prosperity in Small Open Economies, Routledge, London.
Menard, S. (1995). Applied logistic regression analysis, Thousand Oaks, Sage Publications. Morgan, K. (1996). L’apprentissage par l’interaction : réseaux d’entreprises et services d’appui
aux entreprises, in: OCDE (Ed), Réseaux d’entreprises et développement
Osterman, P. (2000). Work Organisation in an era of restructuring: trends in diffusion and effects on employments welfare, Industrial and Labour Relations Review, 53(2), 179-196.
Scott, A. (2000). Regions and the World Economy - The Coming Shape of Global Production, Competition, and Political Order, Oxford University Press, 75-120.
Scott, A., Agnew, J. & Storper, M. (2001). Global City-Regions: an overview, in A. Scott (Ed), Global City-Regions: Trends, Theory, Policies, Oxford: Oxford University Press, 11-30. Scott, A. & Storper, M. (1992). Industrialisation and regional development, in M. Storper and A.
Scott (eds.), Pathways to industrialisation and Regional Development, London: Routledge, 3-17.
Scott, A. & Storper, M. (2003). Regions, Globalization, Development, Regional Studies, 37(6/7), 579-593.
Smolny, W. (1998). Innovations, prices and employment: a theoretical model and empirical application for West German manufacturing firms, Journal of Industrial Economics, XLVI(3), 359 – 382.
Storper, M. & Harrison, B. (1991). Flexibility, hierarchy and regional development: the changing structure of industrial production systems and their forms of governance in the 1990s,
Research Policy, 20, 407-422.
Storper, M. (1995). The resurgence of regional economies, ten years later: the region as a nexus of untraded interdependencies, European Urban and Regional Studies, 2, 191-221.
Sonn, J.W. & Storper, M. (2008). The increasing importance of geographical proximity in knowledge production: an analysis of US patent citations, 1975 – 1997, Environment and Planning A, 40(5), 1020-1039.
Tsampra, M. & Palaskas, T. (2002). Small-firm production systems and regional vulnerability in Greece: Low-cost versus knowledge-intensive specialization strategies in globalizing
economy, Working Papers in Employment, Work and Finance, School of Geography and the Environment, University of Oxford.
Van Reenen, J. (1997). Employment and Technological innovation: evidence from U.K. manufacturing firms, Journal of Labor Economics, 15(2), 255-284.
Vaz, M.T.N. (2006). Entrepreneurship in small firms and local development, in: M.T.N. Vaz, E. Morgan and P. Nijkamp, (eds.), The New European Rurality: Strategies for Small Business, Ashgate, London, United Kingdom, 13-25.
Vaz, M. T. N. & Cesário, M. (2008). Driving Forces for Innovation: are they measurable? International Journal of Foresight and Innovation Policy, Vol.4, nºs1/2.
Vaz, M. T. N., Cesário, M. & Fernandes, S. (2006). Interaction between Innovation in Small Firms and their Environments: an exploratory study, European Planning Studies, 14(1), 95-117.