ACOUSTICS OF CHURCHES FROM PORTUGAL AND
PERU WHEN THEY WERE ONCE THE SAME COUNTRY
Carlos Jiménez Dianderas
Departamento de Arquitectura, Pontifícia Universidad Católica de Perú, Av. Universitaria 1801, Lima 32, Perú e-mail: cjimene@pucp.pe
António P. O. Carvalho
Laboratory of Acoustics, Faculty of Engineering, Univ. of Porto, P-4200-465 Porto Portugal e-mail: carvalho@fe.up.pt
This paper compares the interior acoustics of Catholic churches of Portugal and Peru, built in the late 16th and early 17th centuries. In situ measured data of Reverberation Time and other parameters are presented and compared controlling for country.
1. Introduction
From 1580 to 1640 Portugal and Peru were the same country. Or, better said, they were ruled by the same king. In 1580 Portugal lost its 437 years-old independence (when the 68 year-old king Henrique died with no direct heir) and the Spanish king became also the king of Portugal (because he was the “closest” relative). For 60 years the Portuguese and the Spanish world Empires were united (until a Revolution in Portugal put the History back on its tracks). King Filipe II, III and IV were then in charge.
During these years many churches were built in Peru; the first half-century of domination and the stage of pacification and acculturation have been consolidated in these years to make away for a cultural boom and evangelization of the natives. The churches were necessary for the presence and physical demonstration of Catholicism in the new territories.
In Portugal, on the contrary, the times were not for the construction of churches (Portugal had lost its dynasty and the control for all its old sources of money). Also, the country had already hun-dred of churches built during the four centuries before.
In Portugal, in the late 16th century and in the early 17th century, the dominant architectural style was the Late Gothic (“Manueline”, a Portuguese flamboyant Gothic), the Renaissance and then the Baroque.
In Peru, this long period, was dominated by the same European architectural styles, often ar-riving a few years later and staying beyond the time prevailing in Europe. The styles of the Peruvian churches analyzed are Renaissance and Baroque, with constructive and aesthetic influence of the natives.
2. Sample
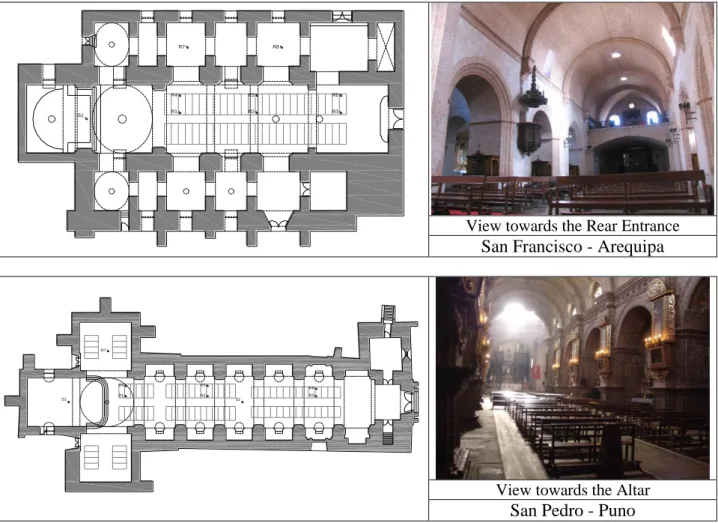
The sample used -ten churches in each country- is shown in Table 1. Figures 1 to 4 present examples of those churches.
PORTUGAL PERU
# Church name Year V(m3) # Church name Year V(m3)
PT1 Golegã 16th c. 5563 PE1 Compañía-Arequipa 1654 10471
PT2 Misericórdia-Évora
1554-1590 3338 PE2 S. Francisco-Arequipa 1687 9777 PT3 S. Francisco-Évora early
16th c. 18631 PE3 Sta. Catalina-Arequipa 1580 5723 PT4 S. João
Baptista-Moura
early
16th c 6300 PE4 Compañía-Ayacucho 1645 8185
PT5 Azeitão 16th c. 1239 PE5 S. Agustín-Ayacucho 1637 5616
PT6 S. Roque-Lisboa late
16th c. 14207 PE6 S. Francisco Paula-Ayacucho 1613 4466
PT7 Tibães early
17th c. 8608 PE7 S. Juan de Dios-Ayacucho 1627 5739 PT8 Viana do Alentejo 16th c. 3358 PE8 Recoleta-Cusco 1601 2284 PT9 Vila do Bispo late
16th c. 1290 PE9 Sta. Clara-Cusco 1622 8393 PT10 Serra do
Pilar-V.N.Gaia
1538-1670 11566 PE10 S. Pedro-Puno 1579 11225
View towards the Altar Mosteiro de Tibaes
View towards the Altar Serra do Pilar – Vila Nova de Gaia
SAN FRANCISCO AREQUIPA 0 5 10 S1 R4 R1 R5 R2 R6 R3 R7 R8
View towards the Rear Entrance San Francisco - Arequipa
SAN PEDRO JULI 0 5 10 S1 S2 R7 R1 R4 R2 R5 R3 R6
View towards the Altar San Pedro - Puno
Figures 3 and 4-Examples of churches in Peru in the sample used3
3. Results
3.1 Reverberation time and Clarity C80
The Table 2 shows the averaged data (500 and 1k Hz octave bands) for the RT and C80 of the
churches used in this study 1,2,3.
Table 2. RT and C80 data (average 500-1k Hz) from the sample of churches in Portugal and Peru used in this study. 1,2,3 PORTUGAL PERU # Church name RT (s) C80 (dB) # Church name RT (s) C80 (dB)
PT1 Golegã 3.6 -5.0 PE1 La Compañía-Arequipa 3.2 -14.6
PT2 Misericórdia-Évora 2.3 -2.1 PE2 S. Francisco-Arequipa 2.5 -19.3
PT3 S. Francisco-Évora 5.0 -6.5 PE3 Sta. Catalina-Arequipa 3.3 -19.4
PT4 S. João Baptista-Moura 6.6 -7.7 PE4 Compañía-Ayacucho 3.8 -18.0
PT5 Azeitão 2.3 -1.6 PE5 S. Agustín-Ayacucho 3.6 -17.8
PT6 S. Roque-Lisboa 3.8 -4.6 PE6 S. Francisco Paula-Ayacucho 2.6 -9.1
PT7 Tibães 2.7 -3.6 PE7 S. Juan de Dios-Ayacucho 3.3 -7.9
PT8 Viana do Alentejo 3.1 -2.7 PE8 Recoleta-Cusco 2.2 -3.2
PT9 Vila do Bispo 1.8 0.1 PE9 Sta. Clara-Cusco 2.0 -3.2
PT10 Serra do
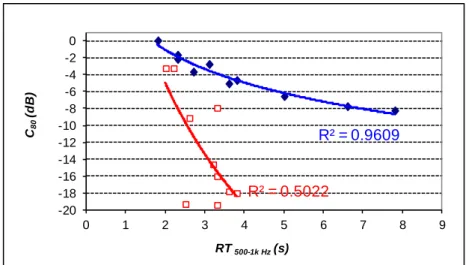
while for C80 reverse situation occurs, that is, lower interval in the case of the Portuguese churches
–between 0.1 dB and 8.2 dB, and for the Peruvian churches the variation is between 3.2 dB and -19.4 dB. However, the relationship between RT and C80, as seen in the figure 5, indicate more sig-nificant R2 values among the churches of Portugal (R2=0,96) than for the churches of Peru (R2=0,50), existing in the latter case a wide dispersion related to the regression line obtained, indi-cating an independence degree between those two acoustics parameters.
R² = 0.9609 R² = 0.5022 -20 -18 -16 -14 -12 -10 -8 -6 -4 -2 0 0 1 2 3 4 5 6 7 8 9 C80 (d B ) RT 500-1k Hz(s)
Figure 5 – Average RT and C80 data for each church, controlling for the country (blue dots and line for Portugal and red open squares and line for Peru)
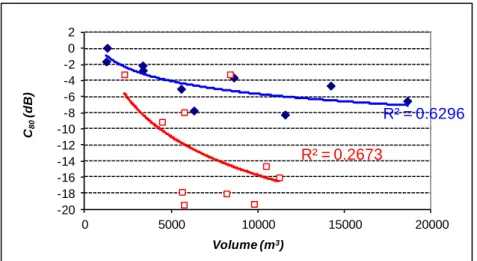
When individually analyzed, the relationship between these two acoustical parameters and two basic architectural parameters such as maximum height and volume, of each temple, as shown in figures 6 to 9, again, the churches of Peru have very low R2, nothing significant for both acoustic parameters, while for the churches of Portugal are obtained significant values of R2, especially considering the C80 with the two architectural parameters. This wide dispersion of the samples from
the churches of Peru may be due to two considerations: the different physical configurations of the samples (during this period the new European architecture were just consolidating this type of construction) like narrow nave, three naves, or wide nave with transept; and building materials used: sillar (porous volcanic stone) in the churches of Arequipa, stone in churches from Cusco and Puno, and adobe (earth) in the churches of Ayacucho.
R² = 0.6212 R² = 0.0858 -20 -18 -16 -14 -12 -10 -8 -6 -4 -2 0 2 0 5 10 15 20 25 30 35 40 C80 (d B ) Height maximum (m)
Figure 6 – Average C80 and Maximum Height data for each church, controlling for the country (blue dots and line for Portugal and red open squares and line for Peru)
R² = 0.6296 R² = 0.2673 -20 -18 -16 -14 -12 -10 -8 -6 -4 -2 0 2 0 5000 10000 15000 20000 C80 (d B ) Volume (m3)
Figure 7 – Average C80 and Volume data for each church, controlling for the country (blue dots and line for Portugal and red open squares and line for Peru)
R² = 0.565 R² = 0.003 0 1 2 3 4 5 6 7 8 9 0 5 10 15 20 25 30 35 40 R T500 -1 k H z (s ) Height maximum (m)
Figure 8 – Average RT and Maximum Height data for each church, controlling for the country
(blue dots and line for Portugal and red open squares and line for Peru)
R² = 0.5279 R² = 0.0466 0 1 2 3 4 5 6 7 8 9 0 5000 10000 15000 20000 R T500 -1 k Hz (s ) Volume (m3)
Figure 9 – Average RT and Volume data for each church, controlling for the country
(blue dots and line for Portugal and red open squares and line for Peru)
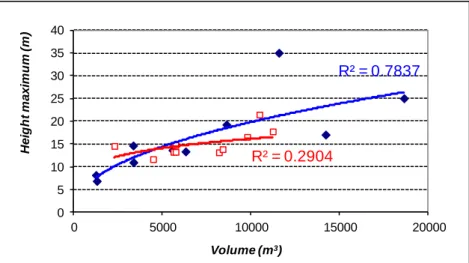
A similar statistical analysis between the physical characteristics of maximum height and volume in churches can again prove that even though the churches of Peru have a smaller dispersion about the regression line, R2 = 0.29 is lower than that obtained for churches in Portugal: R2 = 0.78,
there is a noticeable improvement in the correlation established between the two categories, for example, the R2 values when interacting RT with C80 (R2 = 0.97), RT with Maximum Height (R2 =
0.96) and C80 with Maximum Height (R2 = 0.99). The relations between the RT and C80 with the
Volume also increase the values of R2 but to a lesser extent. Probably the difference in materials and construction procedures between both types of churches belonging to the same historical period and architectural styles, could explain the difference in sound quality of churches from Portugal and Peru. R² = 0.7837 R² = 0.2904 0 5 10 15 20 25 30 35 40 0 5000 10000 15000 20000 H e ig h t m a x im u m ( m ) Volume (m3)
Figure 10 – Average Maximum Height and Volume data for each church, controlling for the country
(blue dots and line for Portugal and red open squares and line for Peru)
4. Conclusions
Ten churches in Portugal and ten churches in Peru were compared, whereas in the period 1580-1640, when they were built, were part of a same country, even though they belong to different continents, but maintaining the same patterns of architectural styles of the time.
Statistical analysis of dispersion and regression lines between the acoustic parameters RT and C80 and the architectural parameters Maximum Height and Volume determine differences in their
R2 values being lower for the churches of Peru than the churches of Portugal in all cases. This condition could be due mainly to different building procedures and materials typically used in churches in Peru.
ACKNOWLEDGEMENTS
To the Pontifícia Universidad Católica de Peru and CEC – Centro de Estudos da Construção (FEUP) for the financial support.
REFERENCES
1
Silva, T., Guião da Acústica de Igrejas em Portugal, Master of Science Thesis, Civil Eng., Fac. Eng. University of Porto, Portugal, (2008).
2
Carvalho, A.P.O., Influence of architectural features and styles on various acoustical meas-ures in churches, Ph.D. dissertation, University of Florida, USA, (1994).
3
Jimenez, C., Correlación entre parámetros acústicos objetivos y características físico arqui-tectónicas en templos católicos del período colonial en ciudades representativas del Perú, Ph.D. Dissertation, ETSII, Universidad Politécnica de Madrid, Spain, (2010).