Universidade de Lisboa
Faculdade de Farmácia
Development of a capillary electrophoresis
method for the determination of timolol in
urine of neonates
Catarina Mourato Cândido
Mestrado Integrado em Ciências Farmacêuticas
3
Universidade de Lisboa
Faculdade de Farmácia
Development of a capillary electrophoresis
method for the determination of timolol in
urine of neonates
Catarina Mourato Cândido
Trabalho de Campo de Mestrado Integrado em Ciências Farmacêuticas
Supervisors: Prof. Dr. João F. Pinto
Prof. Dr. Martin A. Wahl
5 This work was developed under the Erasmus+ Programme, at the
Mathematisch Naturwissenschaftliche Fakultät of the Eberhard Karls Universität, Tübingen, Germany
7
Abstract
Infantile hemangioma (IH) is the most common type of benign tumor affecting children. Although most of the IH are small and localized, some may result in severe complications, which justifies the treatment. Beta-blockers have been currently used as first-line treatment for this pathology. However, there are concerns regarding systemic effects of topical timolol in preterm neonates, a population with increased risk for the development of this pathology. In order to study skin permeation of timolol in preterm infants, a capillary electrophoresis (CE) method to determine timolol was developed in the present work. CE method was optimized using aqueous samples. Parameters related to the buffer (type, pH and concentration) and to the equipment were investigated, including separation voltage and duration of injection. The best CE analysis to detect and separate timolol and propranolol (internal standard) peaks was achieved using phosphate buffer 0.1 M pH 2.0, 10 kV injection voltage, 13 kV separation voltage and duration of injection of 300 s. The method was validated in accordance to ICH guideline- Validation of Analytical Procedures Q2 (R1). Nonetheless, there is still a concern regarding the lack of reproducibility of the method, since elevated standard deviations were obtained and the current was sometimes unstable when separation voltages of 7 and 18 kV and low pH levels were applied. It is important in future experiments to determine the cause of this situation to consolidate the method validation. Since the CE method will be applied to urine samples, a sample pre-treatment method is required. Solid-phase extraction (SPE) using Isolute® ENV+ columns was the method selected. Using this method, peak detection in CE was only possible by applying hydrodynamic injection. SPE alternatives to ENV+ columns have to be investigated, so that the validated CE method can be applied and tested using urine samples.
Key-words: Capillary Electrophoresis, Infantile Hemangioma, Solid-Phase Extraction, Timolol.
8
Resumo
O hemangioma infantil (IH) é a categoria de tumor benigno mais comum em crianças. Entre os fatores de risco para o aparecimento desta patologia encontram-se os recém-nascidos prematuros e de baixo peso, recém- nascidos e crianças do sexo feminino, gestação em idade avançada e gestação múltipla. Embora a maioria dos IH seja pequena e localizada, alguns podem resultar em complicações graves, dependentes da sua dimensão e localização. Bloqueadores- beta têm sido recentemente utilizados como tratamento de primeira linha desta patologia, de forma a evitar a utilização de esteróides, cujos efeitos são sistémicos. Atualmente, o timolol em formulação para aplicação tópica tem vindo a substituir o propranolol, o qual, sendo administrado por via oral, está também associado a efeitos sistémicos. Contudo, existem ainda preocupações relativas a eventuais efeitos sistémicos em resultado da administração de timolol em recém-nascidos prematuros. Esta população possui pele ainda imatura e a sua área de superfície é elevada em relação ao peso corporal, o que promove uma maior permeação do que a pele de adultos.
De forma a estudar a permeação da pele de recém-nascidos prematuros ao timolol, um método de determinação de timolol recorrendo a electroforese capilar (CE) foi desenvolvido neste trabalho. O método CE foi escolhido devido ao seu baixo limite de detecção, característica especialmente importante pelo facto de a quantidade de fármaco administrada a recém-nascidos ser muito reduzida, assim como a consequente absorção. Este método analítico de separação de moléculas baseia-se na aplicação de uma corrente eléctrica que irá promover a migração das moléculas, de acordo com a sua carga eléctrica. Os detetores transmitem os picos obtidos para o sistema informático, no computador. A identificação dos compostos é possível devido aos diferentes tempos de migração dos mesmos.
Sendo o timolol excretado maioritariamente na urina, esta será a amostra biológica a ser analisada. No entanto, por ainda não ter sido testado um método de purificação da mesma para o efeito, o método CE foi desenvolvido no presente estudo recorrendo a soluções aquosas de timolol e propranolol. O propranolol é utilizado como padrão interno de forma a quantificar a concentração de timolol excretada na urina. Foi escolhido pelas suas características físico-químicas semelhantes às do timolol, o tempo de migração em CE ser aproximado ao do timolol, embora seja eluído em separado, é estável nas condições de análise e pelo facto de não se encontrar inicialmente na amostra a analisar.
Neste trabalho foram optimizadas as condições de detecção e separação dos dois bloqueadores-beta em CE, tendo sido testados parâmetros relacionados com a solução tampão (tipo de solução, pH e concentração) e com o equipamento, incluindo a voltagem de
9 separação e a duração da injecção. As amostras foram injectadas nos capilares utilizando injecção electrocinética.
A estabilidade da corrente necessária para realizar as análises em CE revelou-se um desafio. A utilização de voltagens de 7 kV e 18 kV, assim como a aplicação de pH baixos gerou, por vezes, instabilidade na corrente, condicionando a reprodutibilidade dos resultados.
As melhores condições para detetar e separar timolol e propranolol em CE foram obtidas utilizando tampão fosfato 0.1 M pH 2.0, voltagem de injecção de 10 kV, voltagem de separação de 13 kV e duração de injeção de 300 s. O método foi validado de acordo com a guideline ICH- Validation of Analytical Procedures Q2 (R1).
Dado que o desenvolvimento do método CE tem como objetivo a aplicação futura em amostras de urina, é necessário utilizar um método para realizar o pré-tratamento das amostras, de forma a impedir o bloqueio dos capilares do equipamento e a eliminar interferências. O método selecionado para o efeito foi a extração em fase sólida (SPE) com colunas Isolute® ENV+. Neste método as amostras são introduzidas colunas previamente equilibradas. Mediante a aplicação de solvente apropriado o composto em análise será extraído da coluna, apresentando-se numa forma purificada e concentrada. Neste projecto, o metanol revelou ser o solvente de eluição mais efetivo para extrair os analitos da coluna. Contudo, a deteção dos analitos em CE só foi possível recorrendo a injeção hidrodinâmica. Embora o método SPE testado tenha permitido a eluição dos analitos da coluna, os picos de detecção obtidos foram mais pequenos e estreitos comparativamente com aqueles que foram detetados sem que as amostras tivessem sido sujeitas a SPE. Existem vários fatores que podem ter influenciado esta situação, nomeadamente o elevado pH utilizado, a escolha dos solventes e das colunas. Alternativas às colunas Isolute® ENV+ devem ser investigadas, para que a análise seja realizada nos analitos na forma catiónica e a aplicar o método CE validado neste estudo a amostras biológicas de recém-nascidos aos quais está a ser administrado timolol.
Palavras-chave: Eletroforese Capilar, Extração em Fase Sólida, Hemangioma Infantil, Timolol.
10
Acknowledgments
We can hardly find a challenge we can win on our own. Inevitably, those who are around us will shape our decisions or even our mindset. They will give us the strength and the courage required to go on and never give up. Even if we think the victory is all due to ourselves, we must never forget that our qualities were, in part, influenced by those who have been around us. Although this project is the result of a work I started developing seventeen years ago, when Prof. Margarida taught me the gift of reading and writing, I was, surely, never alone. To those who have guided me, helped me, criticized me, made me laugh and made sure I was never alone, I have to say, from the bottom of my heart,
Thank you.
To my parents, Rosa and Nuno, my permanent support, for always sharing their true thoughts, their love and for providing me the education I aimed.
To my brother Bernardo, the quietest person I know, for being my companion in the adventure of growing up.
To my grandparents, Eugénia and António, for being the best cheerleaders I could have and for always highlight the best of me.
To my grandfather Abel, for is constant encouragement to study hard and for believing in myself. I know you would be proud.
To Álvaro, for all the love, all the friendship and the incredible support he always gives me. To the department of Pharmaceutical Technology from the Eberhard Karls Universität, Tübingen, for their friendly welcoming, nice conversations and delicious cakes. In special, I would like to acknowledge Prof. Martin Wahl for his guidance and Anja Bork, for being always available to help me.
To Prof. João Pinto, for being available to be my supervisor, for his guidance and for encouraging me to develop my critical thinking.
To Dr. Manuela Gaspar, for teaching me the art of scientific investigation.
To my friends Tomás, Luís, Rui, Anastasia, André, Sara, Cátia, Joana and Carolina, for being masters in making me laugh.
To all the friends FFUL gave me, because these five years would have been more difficult without them.
To Faculdade de Farmácia, Universidade de Lisboa, for being my second home during the past five years.
11
Abbreviations
ACN - Acetonitrile
ACN/TFA, 1% - Acetonitrile/ Trifluoroacetic acid, 1%
CE - Capillary electrophoresis
EOF - Electroosmotic flow
HPLC - High-performance liquid chromatography
IH - Infantile hemangioma
IS - Internal standard
L - Total capillary length
l - Effective capillary length
LD - Limit of detection
LQ - Limit of quantification
MeOH - Methanol
MeOH/TFA, 1% - Methanol/ Trifluoroacetic acid, 1%
NaOH - Sodium hydroxide
NCBI - National Center for Biotechnology Information
P - Propranolol
R2 -Correlation coefficient RSD - Relative standard deviation S - Slope of the calibration curve
SD - Standard deviation
SPE - Solid-phase extraction
T - Timolol
VEGF - Vascular endothelial growth factor
tm - Migration time
V - Voltage
𝑬 - Electric field strength
𝜻 - Zeta potential of the liquid-solid interface 𝜼
- Viscosity of the buffer
𝝁𝒆𝒑 - Electrophoretic mobility
12 𝒗𝒆𝒑
- Electrophoretic velocity
σ - Standard deviation of the response
13
Table of Contents
Abstract ... 7 Resumo ... 8 Acknowledgments ...10 Abbreviations ...11 Introduction ...17 1. Infantile Hemangioma ...17 Treatment ...18 Preterm neonates ...202. Capillary electrophoresis for the detection of timolol ...21
Sample selection ...21
Method Selection...21
Theoretical background of CE ...22
3. Solid- phase extraction for sample purification ...26
Theoretical background ...26
Objective of the project ...27
Materials and Methods ...29
1. Materials and Apparatus ...29
2. Methods ...29
Databases and criteria to include sources ...29
Sample preparation ...30
Timolol and Propranolol detection ...30
Sample purification ...33
Data treatment and analysis ...36
Results ...37
1. Timolol and Propranolol detection in CE ...37
1.1 Acetate buffer ...37
1.2 Phosphate buffer (pH test)...40
1.3 Separation Voltage ...41
1.4 Duration of Injection...43
1.5 Buffer concentration test ...45
1.6 Method Validation ...47
2. Solid Phase Extraction (SPE) with CE detection ...50
2.1 CE injection ...50
Discussion ...57
1. Capillary Electrophoresis (CE) ...57
2. Solid- phase Extraction (SPE) ...58
Conclusion ...61
Future perspectives ...62
14
List of Figures
Figure 1: A) Severe Infantile Hemangioma in a 9 weeks child. B) Infantile Hemangioma
affecting the right cheek of a 26-day-old female ... 18
Figure 2: Chemical structure of timolol ... 20
Figure 3: Effect of the electroosmotic flow and electrophoretic mobility on migration ... 24
Figure 4: Types of injection in CE ... 25
Figure 5: Steps of Solid-Phase Extraction (SPE) ... 26
Figure 6: Sample preparation for the experiments ... 30
Figure 7: Capillary electrophoresis a) simplified scheme of a capillary electropherograph b) Capillary Electrophoresis System used in the present work. ... 32
Figure 8: System Isolute® ENV+ column with a positive pressure manual pump. ... 34
Figure 9: Peak detection of propranolol and timolol in CE using acetate buffer pH 4.0 ... 38
Figure 10: Peak detection of a mixture with propranolol and timolol in water, using acetate buffer pH 4.0 ... 38
Figure 11: Peak detection of propranolol and timolol in CE using acetate buffer pH 5.6 ... 39
Figure 12: Peak detection of a sample containing propranolol and timolol in water, using acetate buffer pH 5.6 ... 39
Figure 13: Peak detection of propranolol and timolol in CE using phosphate buffer pH 2.0 .. 40
Figure 14: Peak detection of a sample containing propranolol and timolol in water, using phosphate buffer a) pH 1.26, b) pH 2.0 and c) pH 3.0 ... 41
Figure 15: Graphics of the CE current during the CE analysis. a) Stable current and well-succeeded analysis and b) Unstable current, which led to unsuccessful peak detection. ... 43
Figure 16: The comparison of graphics obtained for propranolol and timolol separately allowed the identification of the peaks presented in the graphic from the sample analysis.... 47
Figure 17: Calibration curve of timolol ...48
Figure 18: a) Sample of propranolol analyzed in CE before SPE column elution, pH 11.42. b) Sample of propranolol analyzed in CE, pH 2.0 ... 52
Figure 19: CE detection of propranolol analyte eluted from the SPE column using a) Methanol (MeOH), b) Methanol/ Trifluoroacetic acid, 1% (MeOH/TFA, 1%), c) Acetonitrile (ACN), d) Acetonitrile/ Trifluoroacetic acid, 1%. (ACN/TFA, 1%) ... 53
Figure 20: CE detection of propranolol sample mixed with a) MeOH, b) MeOH/TFA, 1%, c) ACN, d) ACN/TFA, 1%... 54
Figure 21: CE detection of propranolol analyte eluted from SPE with a) MeOH/TFA, 1% and diluted in water, 50:50 (v/v), b) ACN diluted in water, 50:50 (v/v) and c) ACN/TFA, 1% diluted in water ... 54
Figure 22: CE detection of timolol a) sample before SPE, b) analyte eluted in SPE with MeOH, c) analyte eluted in SPE with MeOH/TFA, 1% and d) analyte eluted in SPE with ACN/TFA, 1% ... 55
Figure 23: CE detection of a sample containing timolol and propranolol a) sample detection and b) analytes eluted in SPE with MeOH ... 56
15
List of Tables
Table 1. Experimental procedure of SPE. ... 35 Table 2: Separation voltage test in CE with phosphate buffer pH 2.0, injection voltage 10 kV and duration of injection 300 seconds. ... 42 Table 3. Duration of injection test in CE with phosphate buffer pH 2.0, injection voltage 10 kV and separation voltage 13 kV. ... 44 Table 4. Phosphate buffer concentration test, pH 2.0. ... 46 Table 5. Regression data sets of calibration curve for timolol ... 48 Table 6. Validation of the CE method to detect and separate Propranolol and Timolol peaks with phosphate buffer pH 2.0 ... 49 Table 7. Limit of detection (LD) and limit of quantification (LQ) of Timolol in CE. ... 49 Table 8. Injection pressure test in CE performed with propranolol samples. ... 51 Table 9. CE analysis of a sample containing propranolol and timolol before and after SPE.. 56
17
Introduction
1.
Infantile Hemangioma
Infantile hemangiomas (IH) are defined as benign tumors ofthe head and neck in childhood (1,2). With a prevalence estimated at 1-10 % of the infants worldwide, IH are the most common type of tumors at this age range (2,3). Despite being benign tumors, usually small and self-limited, in some cases they can cause severe or life-threatening problems (4). The risk of developing this type of tumor is higher for premature neonates with the weight of less than 1500 g and for Caucasian females, as well (5). Advanced maternal age and multiple gestation are also considered to be risk factors for this pathology (6).
Although the pathogenesis is not completely understood, angiogenesis and vasculogenesis were proposed as mechanisms to explain the vascularization of this type of tumors. Angiogenesis is the growth of new vessels from pre-existing vessels, whereas vasculogenesis is defined as the de novo formation of new blood vessels from circulating endothelial progenitor cells (6,7).
There are several theories to explain these mechanisms. One suggests that cells are “embolized” from the placenta (8), which is in accordance with North’s discoveries that demonstrate similarities of IH and placenta (9), and with Barnés et al studies (10) demonstrating high levels of genetic similarity between IH and placenta, in comparison with other vascular tumors and structures. Placenta releases angiostatic factors (sFLT1), which are wasted after birth, leading to IH development by endothelial cell proliferation (3). Another theory suggests that IH is the result of somatic mutation in components of critical vascular growth-regulatory pathways (11). Recent studies (6) defend that hypoxia stimulates endothelial progenitor cells to proliferate inappropriately, as an attempt to normalize hypoxic tissue, in order to maintain homeostasis.
The clinical course of IH is usually classified in six stages: (1) nascent, (2) early proliferative, (3) late proliferative, (4) plateau, (5) involution and (6) abortive (2). Nascent stage refers to a premonitory mark, which appears until 3 months after birth; early proliferative stage has a rapid growth, whereas in late proliferative the tumor growth slows down and, combined, these stages last for 6 to 10 months; plateau or stabilization phase, where the hemangioma reaches its maximum size, has a variable duration; during involution the tumor diminishes in size or the texture becomes softer and flatter; in the final stage, the abortive phase, the hemangioma will never start proliferating again, which happens after 5 years, in 50 % of the cases, 7 years in 70 % or 9 years in 90 % of the patients (2,12,13).
18 Although the majority of the IH cases are uncomplicated, there are some situations that require special attention, due to the location of the hemangioma (14). It is estimated that 10 % of IH develop complications (15). Some of the consequences of IH are related with lesions of the periocular area, such as amblyopia and occlusion of the visual axis. Although they are less common, they can lead to strabismus, proptosis, exposure keratopathy or compressive optic neuropathy, which requires urgent intervention (2,16). The most common non-ocular lesion is ulceration, which can be responsible for significant blood loss, pain, and predisposition to secondary infection (2). Other types of complications are airway obstruction, multiple cutaneous hemangiomas, large cutaneous hemangiomas and large hepatic or parotid hemangiomas (14).
Figure 1: A) Severe Infantile Hemangioma in a 9 weeks child. Adapted from (17). B) Infantile Hemangioma affecting the right cheek of a 26-day-old female (18).
Treatment
Non-complicated IH are not usually treated, since the majority of the lesions will spontaneously involute. These lesions are monitored to evaluate their growing process. However, some lesions, due to their location, size or risk of residual deformities, have to be treated (14,19,20).
Steroids
Systemic steroids (2-5 mg/kg/day) have been the main treatment for complicated IH, since it has demonstrated high response rate decreasing IH by inhibiting angiogenesis (3). The mechanism of action of this class of drugs relies on the down-regulation of the vascular endothelial growth factor (VEGF), which plays a key role in the regulation of vasculogenesis and angiogenesis. It is thought that steroids may affect other molecules related to these processes (5). Prednisolone is the most common steroid used for treating IH. However,
19 systemic steroids are also associated to a large amount of side effects (15,20,21). Locally applied steroid therapy, such as intralesional or topical steroids, was developed in order to minimize systemic effects of steroids. Nonetheless, intralesional steroids are only used as second line therapy for refractory lesions and topical steroids are effective just is superficial lesions (2).
Interferon alpha
By inhibiting endothelial cells and fibroblast proliferation, interferon was administrated to patients with life- or sight-threatening corticosteroid resistant hemangiomas (16). Due to severe side effects regarding neurotoxicity, this antiangiogenic agent has limited utility (1).
Vincristine
Vincristine is used, in low doses, for the treatment of severe, potentially function-altering or life threatening infantile hemangiomas (22). This alkaloid binds to tubulin, which leads to the inhibition of mitosis and prevention of hemangioma growth (23) Despite being used in low dosage, Vincristine is not commonly used due to its severe side effects and the existence of other effective therapies (14,20).
Cryotherapy
This type of therapy, consisting in the destruction of small vascular channels and stimulation of thrombosis, represents an alternative for tumors at an initial stage, and has the advantage of not having side effects (1,16,20).
Laser
Pulsed dye laser therapy can be applied to the treatment of residual and refractory lesions (24). It slows the proliferation of IH by promoting the obstruction of vessels related to the tumor (23). However, it presents risks, such as scars or ulceration (3).
Surgery
IH treatment with surgery allows the removal of the IH. However, it has many challenges, since the procedure involves highly vascularized areas and includes preoperative embolization (1). For that reason, it is only applied to refractory hemangiomas (25).
Beta-Blockers
Propranolol
Léauté- Labrèze et al (17) found that propranolol, a non-selective beta-blocker, induced
hemangiomas involution, by administrating it to 11 children. Other studies confirmed these surprising results, which contributed to put propranolol as first-line treatment of IH (21). It is thought that propranolol performs its therapeutic effect through three mechanisms: 1)
20 vasoconstriction; 2) inhibition of angiogenesis or vasculogenesis through decreased expression of VEGF; 3) induction of apoptosis of capillary endothelial cells (15,17,19). Although oral propranolol represents a better option than corticosteroids regarding side effects, it also has some risks related to its usage (19). The most common adverse effects described include changes in sleep, such as fatigue, insomnia, nightmares, night restlessness and sleep disturbance, acrocyanosis, respiratory and gastrointestinal symptoms. The most serious adverse effects noticed were hypotension, bradycardia and hypoglycemia (26).
Timolol
Topical formulations of beta-blockers have been administered to children with IH, in order to minimize the development of side effects associated to oral propranolol (14,27). Timolol is an alternative to propranolol due to the efficacy demonstrated in several studies (27–29). Studies reveal that this compound is mainly excreted in urine, where 20% is eliminated unchanged. Its half-life is 4 h (30). However, pharmacokinetic parameters still need to be studied, in order to ensure the safety of this therapeutic option (19,31).
Figure 2: Chemical structure of timolol (32).
Preterm neonates
Beta-blockers are, nowadays, considered as first line treatment for IH. Topical formulations with Timolol are seen as an alternative to oral propranolol, since it is thought that they prevent systemic side effects (28,31).
However, premature neonates have an immature skin and larger surface area relative to body weight, which translates into a higher permeation when compared to adults (33,34). With a potency four to eight times greater than propranolol, there are concerns regarding systemic side effects of timolol topical formulations, such as sleep disturbances, usually
21 known for their localized effect (28,35,36). Weibel et al (37) demonstrated that systemic absorption of topical timolol in young infants exists. Therefore, the amount of Timolol absorbed through the skin needs to be monitored (28,35).
The aim of this work is the development of a method for the determination of timolol in the urine of premature neonates.
2.
Capillary electrophoresis for the detection of timolol
Sample selection
Sample collection in neonates is subject of many regulations. In order to protect this special population from the invasive and painful methods of sample collection, the World Health Organization established a maximum limit on blood sampling of 3 ml/kg/day for clinical research (38).
Urine was the biological sample chosen to perform the timolol measurements since this compound is primarily excreted in urine and it is a non-invasive method (39,40).
Method Selection
At the first glance, the obvious choice to quantify compounds such as beta-blockers is high-performance liquid chromatography (HPLC) (41). This method has proved to be effective for the separation and quantification of Timolol in samples (42). It is an established method to analyze a variety of compounds, including beta-blockers, and ensures sensitivity, specificity and high reproducibility between assays (43,44).
However, HPLC has a high limit of quantification for Timolol in urine samples (30,45). Since the samples are obtained from premature neonates, the method to be developed has to be sensitive to low concentrations of Timolol. For this reason, Capillary Electrophoresis (CE) was the method chosen to determinate Timolol in the urine of neonates. A number of studies demonstrate this method suitable for detecting and quantifying beta-blockers, including timolol, and represents an alternative to HPLC (30,41,46,47). Besides the lower limits of detection, CE also has the advantage of requiring low sample volume, which is important considering the small urine volumes that premature neonates have. This method needs small amounts of buffer and has a wide working range as well (48).
22
Theoretical background of CE
Capillary electrophoresis (CE) is an analytical method to separate molecules from a sample with high efficiency (49). The sample inside fused-silica capillaries is subject to an electric field, responsible for the migration of the molecules, according with its electric charge (50). CE detectors transmit the peaks corresponding to the compounds under analysis to the software. The peaks identification is possible due to its different migration time (tm). tm is the
time it takes for the analyte to migrate from the beginning of the capillary to the detection point and it is defined by equation 1 (47,51).
𝑡
𝑚=
𝐿𝑙
𝑉(𝜇𝑒𝑝+𝜇𝑜𝑠𝑚) (1)
L: total capillary length
l : effective capillary length
V : voltage
𝜇𝑒𝑝: electrophoretic mobility
𝜇𝑜𝑠𝑚: electroosmotic mobility
According to equation 1, a reduced migration time can be achieved by reducing the capillary length, total and effective, increasing the voltage or using high electrophoretic mobility and electroosmotic flow (47).
Electrophoretic mobility and electroosmotic flow (EOF) are important phenomena for the determination of molecule mobility.
According to IUPAC, electrophoretic mobility is the observed rate of migration (in electrophoresis),𝑣, (or electrophoretic velocity, 𝑣ep) divided by the magnitude of the electric
field strength, E, in a given medium (51). Equation 2 is applied for the determination of the apparent mobility, which differs from the experimental obtained mobility (52):
23
𝜇
𝑒𝑝=
𝑣𝑒𝑝 𝐸=
𝐿𝑑⁄𝑡𝑚 𝑉 𝐿⁄ 𝑡 (2) 𝜇𝑒𝑝: electrophoretic mobility (cm2/Vs) 𝑣𝑒𝑝: electrophoretic velocity (cm/s)𝐸: electric field strength (V/cm)
𝐿𝑑: length of the capillary to the detector (cm)
𝑡𝑚: migration time
𝑉: voltage (kV)
𝐿𝑡: total length of the capillary (cm)
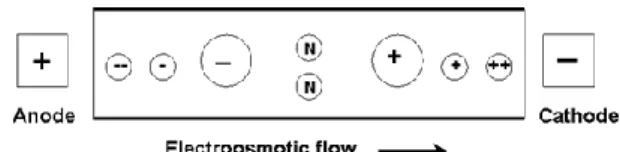
Electroosmosis consists in the movement of the liquid through the capillary, due to the application of an electric field in the capillary membrane (51). This movement is orientated towards the CE cathode, the negative electrode, as represented in Fig. 3. Therefore, cations will have an increased mobility (49). The velocity of the flow is designated as electroosmotic flow (EOF) and is described in Equation 3 (53).
𝐸𝑂𝐹 =
∈𝜁4𝜋𝜂
𝐸
(3)EOF: electroosmostic flow ∈: dielectric constant
𝜁: zeta potential of the liquid-solid interface 𝜂: viscosity of the buffer
The electrophoretic mobility depends on the buffer type, buffer concentration, pH level and temperature (49,52). Buffering is important to ensure the pH level does not change, despite the production of protons, oxygen and hydroxide ions at the electrodes during electrolysis (49).
24 Sample temperature can be affected by the passage of current during CE analysis. The temperature variation can, consequently, have impact on the current, among other factors, including viscosity and the velocity of molecules in the capillary. Moreover, a change in pH is also able to change current and hence, temperature (54).
Figure 3: Effect of the electroosmotic flow and electrophoretic mobility on analytes migration. Analytes migrate according to its charge, in the direction of the negatively
charged cathode (55).
Changes in CE parameters are also able to influence the compounds analysis. Establishing the right parameters leads to an optimization of the method and, thereby, an improvement of the results obtained (56).
In CE, there are two strategies to load samples into the capillary: electrokinetic injection and hydrodynamic injection. In electrokinetic injection samples enter in the capillary as a result of the application of a potential and analytes migrate according to their electrophoretic mobility and the electroosmotic flow. Hydrodynamic injection uses differences of pressure between inlet and outlet vials to promote sample injection to the capillary, which can be achieved through the employment of positive pressure to the inlet vial or vacuum to the outlet vial, where the end of the capillary is located (49,52,56). Fig. 4 schematizes these two types of injection.
25 Figure 4: Types of injection in CE. Hydrodynamic injection applies positive pressure to the inlet vial or vacuum to the outlet vial, in order to promote pressure differences between vials that inject the sample into the capillary. In electrokinetic injection, a voltage leads the sample to the capillary, where the analyte migration depends on
electrophoretic mobility and electroosmosis (52).
The choice between the two existing types of injection relies on the characteristics of the sample to be analyzed. Hydrodynamic injection loads a defined volume of sample into the capillary, which ensures the sample inside the capillary has the same composition as the sample in the vial. On the opposite, in electrokinetic injection the composition of the sample introduced into the capillary depends on the electrophoretic mobility of the analytes existing in the sample. Therefore, different analytes are injected in a different extent: there is more quantity of ions with high mobility (cations) inside the capillary than ions with lower mobility (anions), which leads to the achievement of lower detection limits for cations (49,52,56). Hence, hydrodynamic injection is more suitable to analyze complex sample matrixes with both cations and anions, whereas electrokinetic injection is chosen when the aim is the analysis of compounds with high electrophoretic mobility and when low detection limits are desired, which is the case of biological samples (56).
26
3.
Solid- phase extraction for sample purification
Theoretical background
In order to have a sample suitable for CE analysis, a step of sample pre-treatment is required (57). This step aims to prevent the capillaries from being blocked with impurities and to ensure there are no other peaks than those which are meant to be detected (58).
There are several strategies to perform sample preparation, including centrifugation, liquid-liquid extraction and solid-phase extraction (59). The method chosen for the present work was solid-phase extraction (SPE).
SPE not only removes impurities from the sample, but also provides sample pre-concentration (60). This is a strategy to increase the method sensitivity, to have a lower limit of detection and to optimize CE injection (41,43).
SPE is performed in a SPE column, which contains a sorbent that selectively retains the analyte to be studied. The theoretical background of this method relies on the greater affinity the analytes have to the solid phase than to the sample matrix (57).
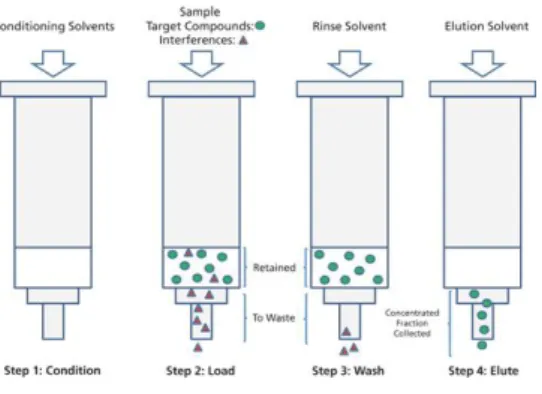
The analyte extraction from the column results from a procedure with several steps, described in Fig. 5. Firstly, the column is conditioned using conditioning solvents to activate the sorbent. Having a rinse step after conditioning is optional. In the next step, the sample is introduced into the column. Afterwards, the SPE column is filled with a rinse solvent, so that interferences can be eliminated from the SPE column. The final step consists in eluting the target analyte, using an appropriate elution solvent (61,62).
The analyte obtained in the end of this process is highly purified and concentrated (61,63).
Figure 5: Steps of Solid-Phase Extraction (SPE). In the first step, the SPE column is conditioned with solvents. In the second step, the sample is loaded into the column, followed by the rinse step, where interferences are eluted from the column. The final step consists in the elution of the analyte using appropriate elution solvents (62).
27
Objective of the project
Topical timolol has recently been used to treat infantile hemangiomas in preterm neonates, although there is no evidence of its safety. Due to the increased skin permeation in newborns, especially in preterms, there are concerns regarding systemic effects of timolol when applied topically to treat IH (28,35,36).
The aim of the project is the development of a method to detect timolol in the urine of premature newborns, which will allow further studies on skin permeation of timolol in this population. The method will be firstly developed in aqueous sample, which is the objective of the present work. In the future it will be applied to urine samples.
The first objective of the project consists in developing a CE method for the detection of timolol, since it is sensitive to low concentrations of the drug to be studied and it has been proved to be suitable for detecting and quantifying beta-blockers (30,46,47).
The second objective of the project is the development of a SPE method for urine samples pre-treatment.
29
Materials and Methods
1. Materials and Apparatus
Propranolol hydrochloride (internal standard, batch no. 379125) and potassium dihydrogen phosphate (≥99% pure; batch no. 443230) were purchased from Flucka Chemie GmbH. Timolol maleate salt (batch no. 061K1290V), sodium acetate (batch no. SLBF4608V), sodium phosphate monobasic dihydrate (batch no. BCBP8183V) and Sodium Hydroxide 1.0 M (batch no. SZE91460) were provided by Sigma-Aldrich. Phosphoric acid (85%; batch no. 11K100009) and methanol (filtrated at 0.2 μmM batch no. 15G010506) were obtained from VWR Chemicals. Potassium hydroxide extra pure (batch no. 908), sodium hydroxide 0.1 M (batch no. HC261315) and trifluroacetic acid (batch no. UN2699) were supplied by Merck. Acetonitrile (batch no. 15G010506) was obtained from J.T.Baker.
Sodium acetate buffer and phosphate buffer were prepared as indicated in Pharmacopoeia (64).
CE was performed in a Capillary Electrophoresis System Beckman Coulter Proteome Lab PA800 using untreated fused silica capillaries eCAPTM Capillary Tubing (batch no.M502670) with 60 cm of total length (50 cm of effective length), 75 μm I.D. and 375 μm O.D, from Beckman Coulter.
pH measurements were performed in a Mettler Toledo Seven Easy pH meter.
In order to remove impurities, 30 mL omnifix syringes (Braun) and high flow hydrophilic filters (Minisart syringe filters, Sartorius) were used.
For SPE, Isolute ENV+ columns from Biotage were required. Columns with bed mass of 200 mg (batch no. 9011806EB) and columns with 100 mg bed mass (batch no. 9266907GB) were employed, both of them with 6 mL cartridge size.
For all the experiments highly purified water (generated with Purelab Option-Q, Elga) was used.
2. Methods
Databases and criteria to include sources
In order to present a reliable theoretical background, several databases were consulted, such as the National Center for Biotechnology Information (NCBI), Science Direct and Drug Bank. From NCBI, PubMed and PubChem were the most consulted databases.
30 The main research concepts searched in databases were Infantile Hemangioma, Timolol,
Propranolol, Capillary Electrophoresis, Solid Phase Extraction and the combination of these
concepts.
Scientific articles, including both review and research papers, were the main foundation for the theoretical background of this project. Books and guidelines were also a source of information. To become valid sources of information, the materials consulted had to be clearly identified with, at least, name of the authors, title of the work, name of the institution, name and date of the publication.
Sample preparation
Aqueous solutions were prepared using 5 μg/mL of Timolol and 5 μg/mL of Propranolol as internal standard (IS), withdrawn from solutions with 971 μg/mL and 1070 μg/mL, respectively. Due to its instability under light, Timolol had to be protected from the light during this step (65).
Figure 6: Sample preparation for the experiments. The sample was prepared with 5
μg/mL of Timolol and 5 μg/mL of Propranolol in 10 mL of highly purified water.
Timolol and Propranolol detection
Propranolol as internal standard
In order to quantify the amount of timolol in urine samples, a known concentration of Propranolol (5 μg/mL) is used as internal standard (IS). IS is added to the sample in known quantities. Its fractional recovery is measured, which provides information related to the recovery of the original analyte under analysis (66).
Propranolol has the desirable properties to be the IS of a sample containing timolol:
Propranolol has physicochemical similarities with timolol, such as the pka, which has the value of 9,21 for timolol and 9,42 for propranolol (67,68).
Propranolol is chemically stable under CE experiments (47).
The compounds have different migration times but can be eluted as closely as possible.
10 mL highly purified water 5 μg/mL Propranolol 5 μg/mL Timolol
31
The analytical sample does not contain propranolol.
CE method parameters have to be tested and optimized, so that timolol and propranolol peaks separation can be ensured, with the best accuracy and precision possible.
Combining the IS method with external calibration using solutions of the standard analyte represents an advantage by eliminating the uncertainty of the method (66).
Method
Timolol and Propranolol (IS) were detected in the sample using CE with electrokinetic injection. CE parameters, such as separation voltage and duration of injection, were tested at 25 ºC.
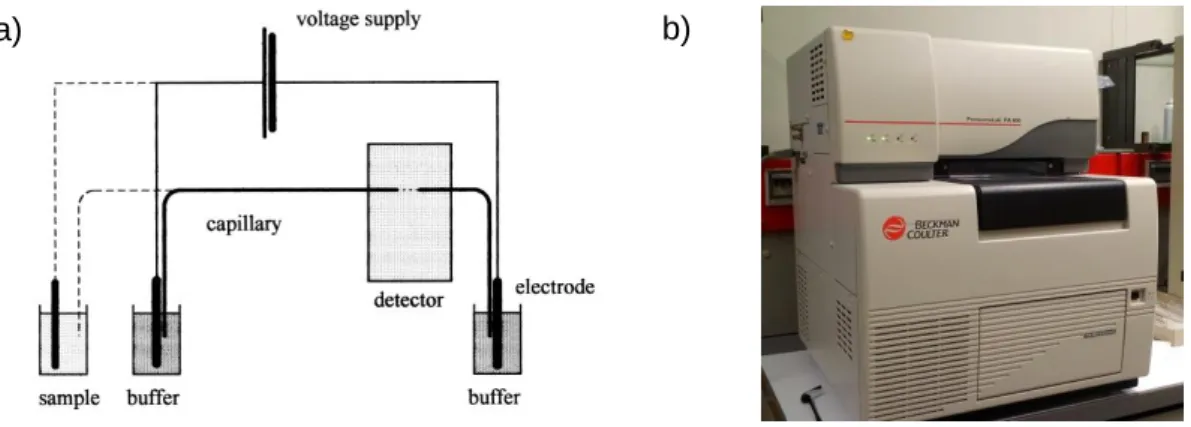
CE equipment is schematized in Fig. 7, consisting in a fused-silica capillary, a high voltage source, two electrodes, inlet and outlet vials containing buffer and the ends of the capillary, a vial containing the sample and an UV detector. Firstly, the capillary is filled with buffer. Afterwards, the end of the capillary immerses into the vial containing the sample. The mobility of sample compounds inside the capillary is detected by UV detectors and graphics are displayed in the computer (49,69).
Injection voltage is the voltage applied to load the sample into the capillary during the electrokinetic injection and it was constant for all the experiments, at 10 kV (70).
Separation voltage, defined as the voltage employed to separate molecules according to its charge, was studied by testing a range of voltages (7 kV, 13 kV and 18 kV) during 40 minutes each (70). Durations of injection of 50, 75, 100, 150, 200 and 300 s were also evaluated.
Every day, before starting the experiments or when the buffer was changed, the capillary was conditioned twice with three wash cycles: 1) 1 M NaOH, 10 min, 30 psi, 2) buffer, 10 min, 30 psi and 3) buffer, 10 min, 10 kV.
Rinsing steps were also performed between measurements, using 1) 0.1 M NaOH, 3 min, 30 psi, 2) water, 3 min, 30 psi, 3) buffer, 3 min, 30 psi and 4) buffer, 3 min, 10 kV.
Experiments were carried out in two buffer systems, acetate and phosphate buffer, separately. These buffer systems have been reported as good systems to keep these molecules protonated and suitable for CE analysis (43,48). Working with protonated molecules represents an advantage in CE considering it decreases migration time (47,49). The effectiveness of acetate buffer was assessed for pH 4.0 and 5.76. For phosphate buffer, pH levels of 1.26, 2 and 3 were evaluated. The chosen pH levels were inside of the buffer effect range and below the pka of the molecules tested, which ensured that the molecules were positively charged (30).
32 Buffer concentration is one of the factors that influences electrophoretic mobility and, consequently, migration time (49,52).Taking this into account, sample analysis was performed using several concentrations of phosphate buffer (0.01 M, 0.025 M, 0.05 M, 0.06 M, 0.07 M, 0.08 M, 0.09 M and 0.1 M), in order to optimize this parameter.
For the photometric detection of timolol, the UV detector was set for 280 nm wavelength, which corresponds to the closest wavelength to the maximum absorption of the compound and leads to the detection of wider peaks (30).
Figure 7: Capillary electrophoresis a) simplified scheme of a capillary electropherograph (49); b) Capillary Electrophoresis System Beckman Coulter
Proteome Lab PA800 used in the present work.
Method Validation
Method validation was performed according to ICH guideline- Validation of Analytical
Procedures Q2 (R1) (71).
The identification of the drugs tested was achieved by comparing peaks detected in the sample analysis with the isolated peak, obtained after the analysis of each compound separately.
Linearity was evaluated using five different concentrations of Timolol, in the range of 0.05- 5
μg mL-1. Each solution was injected three times, with injection voltage of 10 kV, separation
voltage of 13 kV and duration of injection of 300 s. Fresh phosphate buffer, pH 2.0, was prepared for each measurement. Calibration curves were constructed by plotting peak areas against timolol concentration and the regression equation was established. Linear least-squares regression analysis provided linearity evaluation.
33 Accuracy and precision were investigated by performing three independent experiments, with six measurements each, using fresh phosphate buffer pH 2.0 in each experiment. The CE parameters were set for injection voltage of 10 kV, separation voltage of 13 kV and duration of injection of 300 s.
Relative standard deviation (RSD) was calculated by applying the equation:
𝑅𝑆𝐷 =
𝑆𝐷𝑀𝑒𝑎𝑛
× 100
(4)SD= standard deviation
The limit of detection (LD) of timolol was assessed using the equation:
𝐿𝐷 =
3.3𝜎𝑆 (5)
σ= standard deviation of the response S= slope of the calibration curve
The limit of quantification (LQ) of timolol was determined with the equation:
𝐿𝑄 =
10𝜎𝑆 (6)
σ= standard deviation of the response S= slope of the calibration curve
Sample purification
When analyzing biological samples, CE capillaries surface is exposed to modifications that can influence the resolution and reproducibility of the method (54). Since the aim of this project is the development of a CE method to detect timolol from urine samples, it is important to establish a method to purify urine samples, in order to prevent capillaries blockage, interferences detection and to improve the sensitivity of the detector (72).
Method
Solid-phase extraction (SPE) was the method chosen to perform sample purification before CE. The method development was based on the recommendation of Step by step Guide to
34
Isolute® ENV+ columns were employed to test the method. These columns with
functionalized copolymers can be applied to analytes in a wide range of polarity (73). ENV+ columns have a non-polar sorbent and a hydrophobic mechanism, based on Van der Waals forces (61). In addition, they require previous sample treatment with phosphate buffer two units above pK, pH 11.42, to neutralize propranolol and timolol.
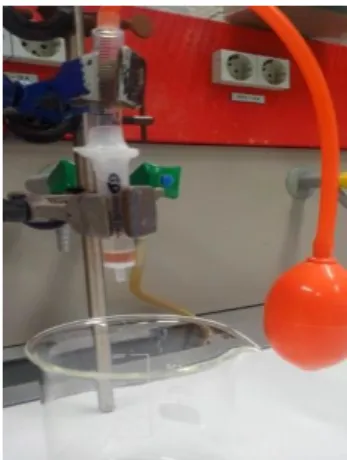
A manual pump was attached to the column inlet in order to provide positive pressure, fundamental for the sample flow through the column, as demonstrated in Fig. 8.
Four types of elution solvents for SPE were tested: Methanol (MeOH); Methanol/ Trifluoroacetic acid, 1% (MeOH/TFA, 1%); Acetonitrile (ACN); Acetonitrile/ Trifluoroacetic acid, 1% (ACN/TFA, 1%).
SPE experimental procedure begins with column conditioning, using the chosen solvent, followed by column equilibration with phosphate buffer, at the same pH level as the sample (pH 11.42). Afterwards, the sample is loaded into the column, at a 10 mL min-1 rate. Interferences are eluted from the column with phosphate buffer, pH 11.42. Subsequently, the column dries for 10 minutes. Then, the analyte is eluted from the column by applying elution solvent into it, and it is analyzed in CE. Since this was the initial phase of the method experiment, none of the steps recommended was eliminated.
Figure 8: Image of the system Isolute® ENV+ column with a positive pressure manual pump.
35 Table 1. Experimental procedure of SPE.
Sample Pre-treatment Adjust the pH level with phosphate buffer 2 units above pka- pH 11.42
Conditioning 4 mL Solvent (1)
Column Equilibration 4 mL 20 mM phosphate buffer pH 11.42
Sample Loading Loading rate: 10 mL min-1
Interference Elution 4 mL 20 mM phosphate buffer pH 11.42
Column Drying 10 minutes
Analyte Elution 2 mL Elution solvent (1)
Analyte Detection Capillary Electrophoresis
(1) Four types of elution solvents were tested: Methanol (MeOH); Methanol/ Trifluoroacetic acid, 1% (MeOH/TFA, 1%); acetonitrile (ACN); acetonitrile/ Trifluoroacetic acid, 1%. (ACN/TFA, 1%).
CE parameters
CE detection of the analytes obtained from SPE was performed with phosphate buffer 0.1 M and pH 2.0, at the wavelength of 280 nm.
Two methods of injection were tested: hydrodynamic injection with pressure and electrokinetic injection. For electrokinetic injection, the sample was injected using 10 kV during 300 seconds and the separation voltage employed was 13 kV for 40 minutes. In the hydrodynamic injection method, a range of pressures was tested, from 0.2 psi to 5.0 psi, during 10 seconds. The separation voltage applied was 13 kV for 40 minutes. According with the literature, the combination of voltage with hydrodynamic injection provides faster and improved separations (43).
Every day the capillary was conditioned twice with three wash cycles: 1) 1 M NaOH, 10 min, 30 psi, 2) buffer, 10 min, 30 psi and 3) buffer, 10 min, 10 kV.
Rinsing steps were performed between measurements, using 1) 0.1 M NaOH, 3 min, 30 psi, 2) water, 3 min, 30 psi, 3) buffer, 3 min, 30 psi and 4) buffer, 3 min, 10 kV.
36
Data treatment and analysis
Results from sample analysis in CE were presented in graphics, displayed in the computer software connected to the CE equipment. In those graphics, compounds peaks were analyzed and its area and migration times were registered. The software also allowed examining current stability of CE and the parameters applied to the analysis.
37
Results
1. Timolol and Propranolol detection in CE
In the present work, aqueous samples containing only timolol and propranolol in equal concentrations were employed in the development of the CE method for the determination of timolol in urine of preterm neonates. At this stage, the aim of the project was the optimization of the CE parameters, in order to separate timolol and propranolol peaks and achieve wider peaks of detection, as well. The importance of optimizing peak areas lies on the fact that it is directly related to the quantity of analyte in the sample (70).
Therefore, several parameters, such as type of buffer, buffer pH, buffer concentration, separation voltage and duration of injection, were tested and optimized (49,52).
Buffers tested had pH at least two units below timolol and propranolol pka, to ensure both compounds were protonated.
1.1 Acetate buffer
The first buffer tested was acetate buffer, due to previous reports that demonstrated it was suitable for timolol detection in CE (48). Since acetate buffer has a pH buffering range from 3.6 to 5.6, pH levels of 4.0 and 5.6 were tested (74). For that purpose, electrokinetic injection was performed, by applying an injection voltage of 10 kV. Three separation voltages (7 kV, 13 kV and 18 kV) and three durations of injection (100 s, 200 s and 300 s) were tested. CE detection of propranolol and timolol, in separate samples, is well-succeeded when acetate buffer pH 4.0 and pH 5.6 is employed, as presented in Fig. 9 and 11, respectively. In these graphics clear and wide single peaks are detected. Nonetheless, when the aqueous sample containing both compounds was analyzed, only one peak was detected, which is demonstrated in Fig. 10 and 12.
Fig. 10 and 12 (corresponding to pH 4.0 and pH 5.6) show that, despite testing a range of separation voltages (7 kV, 13 kV and 18 kV) and durations of injection (50, 75, 100, 150, 200 and 300 s), a clear separation of propranolol and timolol peaks was not obtained when acetate buffer was employed.
These results demonstrate the buffer inefficiency in separating the two compounds, even though tests using different separation voltages and different durations of injection were performed.
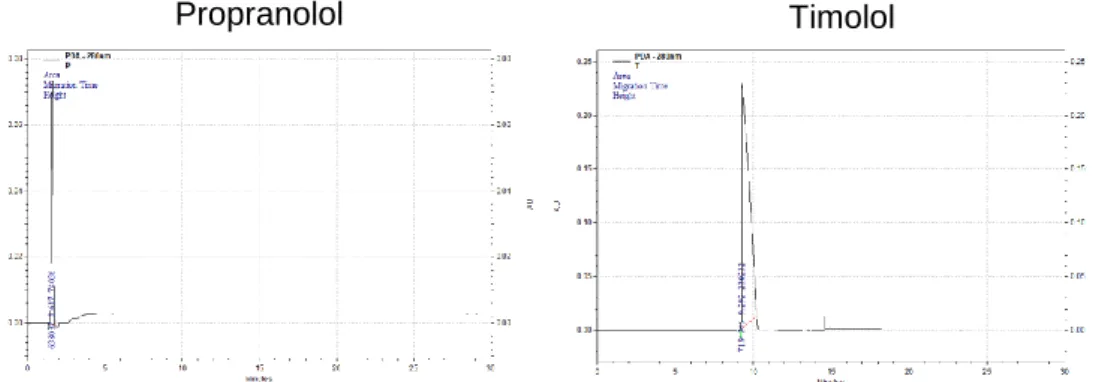
38 Figure 9: Peak detection of propranolol and timolol in CE using acetate buffer pH 4.0,
injection voltage 10 kV, separation voltage 13 kV, duration of injection 300 s. Propranolol has a migration time of 6.133 minutes and timolol has a migration time of
7.521 minutes.
Figure 10: Peak detection of a mixture with propranolol and timolol in water, using acetate buffer pH 4.0, injection voltage 10 kV, a) separation voltage 7 kV, duration of injection 300 s, b) separation voltage 13 kV, duration of injection 100 s, c) separation voltage 13 kV, duration of injection 200 s, d) separation voltage 13 kV, duration of injection 300 s. Peak detection of a mixture with propranolol and timolol in water, using acetate buffer pH 4.0 was not possible when a separation voltage of 18 kV was
applied due to unstable current.
a) b)
c) d)
39 Figure 11: Peak detection of propranolol and timolol in CE using acetate buffer pH 5.6,
injection voltage 10 kV, separation voltage 13 kV, duration of injection 300 s. Propranolol migrated at 1.617 minutes and timolol at 9.292 minutes.
Figure 12: Peak detection of a sample containing propranolol and timolol in water, using acetate buffer pH 5.6, injection voltage 10 kV, a) separation voltage 7 kV, duration of injection 300 s, b) separation voltage 13 kV, duration of injection 100 s, c)
separation voltage 13 kV, duration of injection 200 s, d) separation voltage 13 kV, duration of injection 300 s and e) separation voltage 18 kV, duration of injection 300 s.
a) b)
c) d)
e)
40
1.2 Phosphate buffer (pH test)
Due to the unsuccessful results obtained with acetate buffer, the buffer system was changed. Phosphate buffer was the system chosen, since other studies described it as an efficient alternative for beta-blockers detection in CE (30,43,48).
Phosphate has 3 pka at 25 ºC (pka1= 2.15, pka2= 7.20 and pka3= 12.33), which allows a wide
range of buffer effect (75). Since Timolol and Propranolol have to be protonated for CE detection, a low pH buffer is required (43). Therefore 3 pH levels (pH 1.26, 2.0 and 3.0) of phosphate buffer were tested to determine its effect on peaks shape and separation.
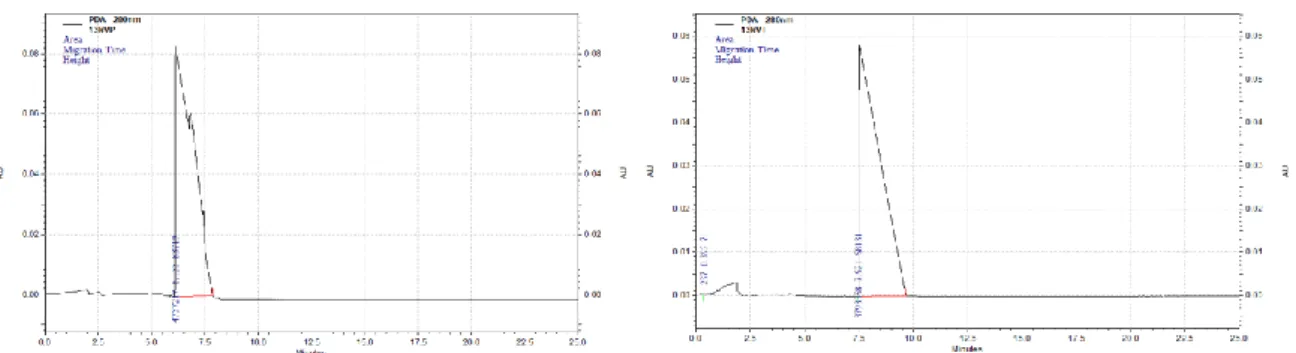
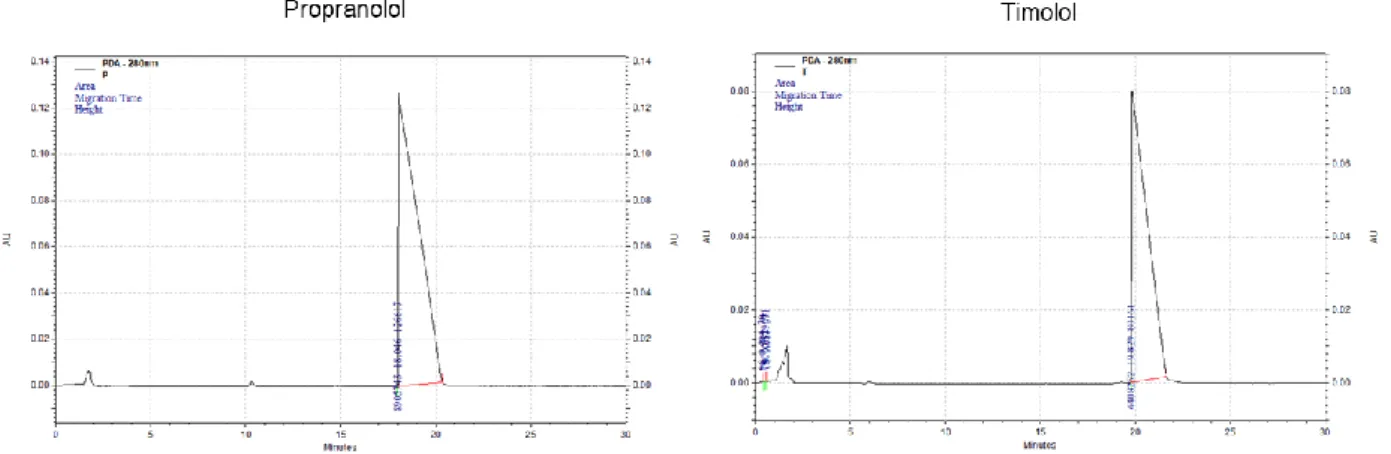
CE detection of propranolol and timolol, in separate samples, was achieved using phosphate buffer, as displayed in Fig. 13. The peaks obtained separately are wider, in comparison to those obtained when acetate buffer was used. By performing the CE analysis with phosphate buffer pH 2.0, the migration times determined were 18.046 minutes for propranolol and 19.829 minutes for timolol. Hence, it is possible to identify peaks presented in Fig. 14. In all the graphics, the first peak corresponds to propranolol and the second peak to timolol.
Figure 13: Peak detection of propranolol and timolol in CE using phosphate buffer pH 2.0, injection voltage 10 kV, separation voltage 13 kV, duration of injection 300 s. Migration times correspond to 18.046 minutes for propranolol
41
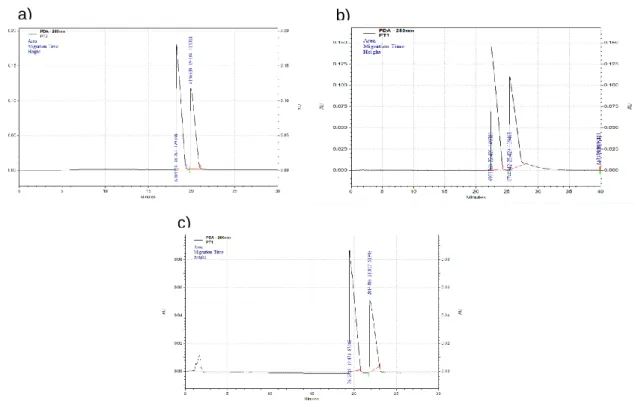
a) b)
c)
Figure 14: Peak detection of a sample containing propranolol and timolol in water, using phosphate buffer a) pH 1.26, b) pH 2.0 and c) pH 3.0, with injection voltage of 10
kV, separation voltage 13 kV and duration of injection 300 sec.
Phosphate buffer proved to have an efficient capacity to separate peaks in its range of effect, which is shown in Fig. 14, where two peaks are displayed. By comparing Fig. 13 with Fig. 14, it is possible to identify the peaks detected in the sample and associate them to each compound.
However, separation voltages variations demonstrated that phosphate buffer pH 1.26 was not suitable, since the CE current was not stable. This result is in accordance with studies referring that changes in pH can affect the current (54).
Phosphate buffer with pH level of 2.0 was chosen for further experiments.
1.3 Separation Voltage
Voltages in the range of 5 to 30 kV are usually chosen to perform the compounds analysis in CE (43). The effect of separation voltage on peaks detection and separation was tested, starting with voltages of 7 kV, 13 kV and 18 kV.
The results, in evidence in Table 2, demonstrate that timolol and propranolol peaks were separated in the range of separation voltages tested. It also indicates that separation
42 voltages of 13 and 18 kV lead to the detection of wider peaks than those obtained with lower voltage. However, analytes migration times were shorter when 7 kV and 18 kV separation voltages were employed. The experiments with different voltages were only performed twice, which is not enough to produce valid data. Nonetheless, these results are important to test whether the method is suitable or not. In order to have the method validated, further experiments have to be performed, as it will be presented later in this report.
Despite the results presented in Table 2, the majority of attempts to analyze the mixture with an 18 kV separation voltage were unsuccessful, due to the CE current failure. This situation is described in literature as a problem of voltage containment when higher voltages are applied, even though higher voltages allow faster analysis (43). The ideal graphic for a stable current during a CE analysis and the current graphic usually obtained during analysis with 18 kV are displayed in Fig. 15.
Table 2: Separation voltage test in CE with phosphate buffer pH 2.0, injection voltage 10 kV and duration of injection 300 seconds.
Sample Separation Injection (kV) Duration of Injection (s)
Peak Area Migration Time (min) Sample Propranolol (P)/ Timolol (T) 7 300 P 216709 ± 4850 3.144 ± 0.256 T 76533 ± 32974 12.76 ± 0.042 13 300 P 3366439 ± 246490 20.75 ± 1.279 T 1148497 ± 865891 23.49 ± 1.623 18 300 P 3839963 ± 1093245 13.419 ± 0.119 T 1434319 ± 654919 15.225 ± 0.158 The results represent mean ± S.D of two experiments.
43 Figure 15: Graphics of the CE current during the CE analysis. a) Graphic
corresponding to a stable current and well-succeeded analysis and b) graphic corresponding to unstable current, obtained in a measurement using a separation
voltage of 18 kV, which led to unsuccessful peak detection.
1.4 Duration of Injection
The duration of injection was the next parameter studied. To test its influence in peaks detection and separation, a range of durations of injection, from 50 seconds to 300 seconds, was tested. The tests were performed using phosphate buffer pH 2.0 and CE was set for an injection voltage of 10 kV and separation voltage of 13 kV. Results are displayed in Table 3. According with Table 3, no significant variations were determined as a result of the alterations in duration of injection. For all durations of injection tested, both timolol and propranolol were detected and its peaks were successfully separated. According to these results, there is no visual relationship between longer injection times and worse RSD. There is not a loss of reproducibility either. Therefore, it is possible to continue using an injection time of 300 s, so that higher peak areas can be obtained and smaller concentrations of timolol and propranolol can be detected.
44 Table 3. Duration of injection test in CE with phosphate buffer pH 2.0, injection voltage 10 kV and separation voltage 13 kV.
Sample Separation Injection (kV) Duration of Injection (s)
Peak Area Relative SD % Migration Time (min) Relative SD % P 13 300 8905743 18.046 T 13 300 263952 19.696 Sample P/T 13 300 P 10789796 12.165 23.058 4.284 T 1312629 10.119 26.276 3.782 P 13 200 4637775 17.558 T 13 200 4408252 19.829 Sample P/T 13 200 P 3609133 75.339 19.642 8.371 T 2881060 55.543 22.206 8.739 P 13 150 7634659 18.675 T 13 150 4309927 21.325 Sample P/T 13 150 P 4847522 21.859 19.927 2.312 T 2642281 47.282 22.568 2.694 P 13 100 6387347 18.806 T 13 100 3970637 20.696 Sample P/T 13 100 P 30970637 30.729 20.271 5.756 T 1899819 24.727 22.869 5.925 P 13 75 4561529 18.029 T 13 75 2971485 20.692 Sample P/T 13 75 P 3108373 21.933 20.352 3.504 T 1782877 19.015 23.099 4.450 P 13 50 3126542 18.658 T 13 50 1857305 20.954 Sample P/T 13 50 P 1905565 16.341 19.825 3.685 T 1096832 16.193 22.234 3.822
P- propranolol; T- timolol; The results represent mean ± S.D: of three independent experiments.
45
1.5 Buffer concentration test
Since buffer concentration is one of the factors influencing electrophoretic mobility and migration time, a range of phosphate buffers concentrations was employed in sample analysis with the aim of optimizing this parameter (49,52). Concentrations of phosphate buffer pH 2.0 tested were 0.01 M, 0.025 M, 0.05 M, 0.06 M, 0.07 M, 0.08 M, 0.09 M and 0.1 M. Buffer concentrations higher than 0.1 M were not tested. Substances peak areas and migration times determined in each test are shown in Table 4.
According with the results presented in Table 4, only phosphate buffer in the range of concentrations from 0.05 M to 0.1 M was able to detect and separate timolol and propranolol peaks. However, for the buffer concentrations that allowed peaks separation, it was not possible to detect a relation between this variant and peak area or migration time.
46 Table 4. Phosphate buffer concentration test, pH 2.0.
Buffer Concen- tration Sample Separation Injection (kV) Duration of Injection (s)
Peak Area Migration Time (min) 0.1 M P 13 300 8905743 18.046 T 13 300 263952 19.696 Sample P/T 13 300 P 3366439 20.750 T 1148498 23.490 0.09 M P 13 300 12741714 21.117 T 13 300 4995870 21.992 Sample P/T 13 300 P 2780391 21.980 T 1287911 24.832 0.08 M P 13 300 13822441 19.792 T 13 300 5286448 21.804 Sample P/T 13 300 P 6553781 19.927 T 3779617 23.117 0.07 M P 13 300 8018798 20.163 T 13 300 3245621 25.190 Sample P/T 13 300 P 4750695 21.290 T 3154124 23.180 Buffer Concen- tration Sample Separation Injection (kV) Duration of Injection (s) Peak Area Migration Time (min) 0.06 M P 13 300 13105497 19.342 T 13 300 5897200 18.038 Sample P/T 13 300 P 4309924 18.113 T 2515664 21.390 0.05 M P 13 300 3826866 19.696 T 13 300 4452187 18.625 Sample P/T 13 300 P 705676 17.980 T 660423 19.542 0.025 M P 13 300 3922034 16.567 T 13 300 3897031 19.254 Sample P/T 13 300 5360879 15.513 0.01 M P 13 300 2313163 14.033 T 13 300 3266844 13.917 Sample P/T 13 300 2553045 13.481 P- propranolol; T- timolol.
1.6 Method Validation
The CE method for detecting and separating Timolol and Propranolol peaks was validated according to ICH guidelines for Validation of Analytical Procedures Q2(R1) (71). For that purpose, phosphate buffer pH 2.0 and 0.1 M was the running buffer chosen and CE parameters were set for injection voltage of 10 kV, separation voltage of 13 kV and duration of injection of 300 s.
The identification of the substances tested was achieved by comparing peaks detected in the sample analysis with the isolated peaks, obtained after the analysis of each compound separately, as demonstrated in Fig. 16.
Figure 16: The comparison of graphics obtained for propranolol and timolol separately allowed the identification of the peaks presented in the graphic from the sample analysis. All the peaks displayed were detected in CE by employing injection voltage of 10 kV, separation voltage of 13 kV, duration of injection of 300 sec and phosphate
buffer pH 2.0 0.1 M as running buffer.
Calibration plots were determined with five different concentrations, as previously described in “Materials and Methods” section. The calibration curve of timolol is presented in Fig. 17
Sample containing Propranolol (P) and Timolol (T)
48 and the regression data sets of this calibration curve are displayed in Table 5. As demonstrated in these results, a good correlation coefficient was obtained.
Figure 17: Calibration curve of timolol. This calibration curve was constructed using five different concentrations of Timolol in the range of 0.05- 5 μg mL-1. Each solution was injected three times, with injection voltage of 10 kV, separation voltage of 13 kV and duration of injection of 300 s. Fresh phosphate buffer pH 2.0 0.1 M was prepared
for each measurement.
Table 5. Regression data sets of calibration curve for timolol
Compound Slope (m) Interception (b) Correlation
coefficient (R2)
Timolol 1x10⁶ 143781 0.9897
The results represent mean ± S.D. of three independent experiments.
Accuracy and precision of this method were assessed by performing six measurements per day of the sample containing propranolol and timolol, during three days, using fresh phosphate buffer pH 2.0 each day. CE parameters employed were those previously optimized: separation voltage of 13 kV, duration of injection of 300 s, phosphate buffer with pH 2.0 and concentration of 0.1 M. RSD (%) equation applied is described in the “Materials and Methods section”. The mean results are expressed in Table 6.
y = 1E+06x + 143781 R² = 0.9897 0 1000000 2000000 3000000 4000000 5000000 6000000 7000000 8000000 0 1 2 3 4 5 Peak Ar e a Concentration (μg/ml) Timolol Linear (Timolol)
49 Table 6. Validation of the CE method to detect and separate Propranolol and Timolol peaks with phosphate buffer pH 2.0. The results presented in the table are the mean results of 6 determinations performed per day in three different days.
Sample Separation Voltage (kV) Duration of Injection (s)
Peak Area Migration Time (min) Sample Propranolol/Timolol 13 300 P T P T 10789796 1312629 23.058 26.276 Relative SD (%) 12.165 10.119 4.284 3.782
The results represent mean ± S.D. of 18 independent experiments.
The final step of this validation was the determination of the limit of detection (LD) and limit of quantification (LQ) of timolol in CE. The equations selected are expressed in the “Materials and Methods” section and the results are presented in Table 7. Timolol has an LD of 1.466
µg mL-1 and a LQ of 4.442 µg mL-1.
Table 7. Limit of detection (LD) and limit of quantification (LQ) of Timolol in CE.
Limit of Detection (LD) 1.466 µg mL-1