A PROPOSAL TO IMPROVE
MARKETING EFECTIVENESS IN A
BUSINESS TO BUSINESS MODEL
Pedro Lourenço Silvino
Project Report
Master in Business Administration
Supervisor:
Professor Eduardo Correia; ISCTE Business School
ISCTE BUSINESS SCOOL, INSTITUTO UNIVERSITÁRIO DE LISBOA ABSTRACT
A proposal to improve marketing effectiveness in a business to business model
by Pedro Silvino
Supervisor: Professor Eduardo Correia
A project presenting a proposal for marketing effectiveness and return on marketing investments (ROMI) improvement in a business to business company that operates in food packaging industry, starting from the analysis of the company’s actual approach to maximize effectiveness. Answers to questions surrounding the effectiveness of marketing investments like: are our investments together with our partners (customers) really benefiting our market shares and derived long term sales volume?
The project’s basic framework assumption is that proper ROMI modelling tends to contribute significantly to increase ROMI. The key recommendation is to implement marketing effectiveness modelling based on the Boston Consulting Group (BCG) approach covering the majority of the company’s marketing investment with their business partners (customers). The expected results will be a significant improved ROMI and a line item in the budget specifically designated to support the three elements of the marketing effectiveness culture: measurement and metrics, modelling and simulation, and management and monitoring.
If you work in marketing in a business to business environment and you are pressurized to demonstrate the contribution of marketing in the long term, worried about your advertising’s effects, want to value your partner’s brands and wondering how to allocate marketing budget across partners and categories, so this document should definitely read on.
Key words: marketing, marketing effectiveness, return on marketing investment (ROMI),
ISCTE BUSINESS SCOOL, INSTITUTO UNIVERSITÁRIO DE LISBOA RESUMO
Proposta de melhoria de eficiência e eficácia de marketing num modelo de negócio de marketing business to business
por Pedro Silvino
Orientador: Professor Eduardo Correia
Um projecto de apresentação de uma proposta de melhoria da eficácia e eficiência de marketing e retorno de investimentos em marketing (ROMI), numa empresa multinacional de embalagens para alimentos líquidos. Iniciando por uma análise da abordagem actual da empresa na maximização e garantia do retorno dos seus investimentos indirectos com os seus clientes da industria alimentar. Procurando respostas às questões que normalmente rodeiam a temática de eficiência e eficácia de investimentos em marketing como: estão os nossos investimentos indirectos com os nossos clientes da indústria alimentar realmente a beneficiar a nossa quota de mercado e o nosso volume de vendas a logo prazo?
O projecto assenta no pressuposto base do quadro conceptual utilizado que a modelação adequada do ROMI contribui significativamente para o aumento deste. A recomendação de melhoria assenta na implementação uma abordagem de modelação proposta pelo Boston Consulting Group (BCG), que dê cobertura à maioria dos investimentos que a companhia faz indirectamente com a indústria alimentar. Os resultados esperados são uma significativa melhoria no ROMI e uma linha no orçamento anual da empresa especialmente para suportar os três elementos fundamentais de uma cultura de marketing effectiveness: medição de desempenho, modelação e simulação, e gestão e monitorização.
Se desempenha funções em marketing e está pressionado para demonstrar a sua contribuição para os resultados no longo prazo, se está preocupado com o impacto publicitário dos seus
1 ACKNOWLEDGMENTS
This project is dedicated to the memory of my father António, who with his persistence always encouraged me to work hard for personal and professional growth. I owe him my eternal gratitude.
I would like to express my gratitude to my supervisor, Professor Eduardo Correia, whose expertise, understanding, and patience, added considerably to my graduate experience.
I would like to thank to Tetra Pak – my second home – for the opportunity to work in such fantastic company and for the openness to support the development of their staff in projects like this one. I must also acknowledge André Pinto from Boston Consulting Group for his suggestions, friendship and provision of some materials evaluated in this study.
A very special thanks goes out to my colleagues from ISCTE Business School’s Executive MBA Programme, Luis Nunes, Diogo Oliveira, Leonel Manaia de Almeida, Jorge Costa and José Hipólito, for our philosophical debates, exchanges of knowledge, skills, and venting of frustration during our graduate program, which helped enrich the experience.
I would also like to thank my family for the support they provided me through my entire life and in particular, I must acknowledge my wife and kids, Filomena, Mariana and Francisco, without whose love, encouragement and editing assistance, I would not have finished this project.
2 TABLE OF CONTENTS
1 Acknowledgments ... i
2 Table of Contents ... ii
3 List of figures and tables ...iii
1 Executive summary ... 1
2 Problem statement ... 2
3 Literutaure review ... 3
3.1 Introduction to business to business marketing ... 3
3.2 Marketing effectiveness ... 4
3.2.1 What is marketing effectiveness?... 5
3.2.2 The new strategic advantage... 6
3.3 Marketing metrics – demonstrating success... 7
3.3.1 Marketing Metrics: opportunities, performance, and accountability ... 8
3.3.2 Keys to an effective Marketing Dashboard...12
3.4 Return On Marketing Investment modeling – the BCG approach... 14
4 A Framework to marketing efectivness in a business market... 18
4.1 The Marketing Effectiveness Continuum model ... 18
4.2 Climbing the Marketing- effectiveness continuum ... 22
5 Research Methodology – The Case Study... 23
6 Case analysis... 24
6.1 Background... 24
6.2 Company Overview ... 25
6.2.1 A History of Innovation ...25
6.2.2 Making Food Safe and Available, Everywhere...26
6.2.3 Responsible, Sustainable Industry Leadership...26
6.2.4 Porfolio – A full systems supplier ...27
6.2.5 2008 in brief...28
6.3 Marketing planning, execution and control at Tetra Pak... 30
6.3.1 Marketing plan ...31
6.4 Measuring marketing effectiveness at Tetra Pak ... 33
6.4.1 Strategic metrics...33
6.4.2 Operational metrics...34
6.4.3 Project’s marketing intents and consumer metrics ...35
7 Conslusions and recomendations... 37
7.1 Concluding remarks ... 37
7.2 Recommendations... 39
7.3 Implementation approach for ROMI modelling and optimization... 43
7.3.1 Data preparation...44
7.3.2 Model development ...45
3 LIST OF FIGURES AND TABLES
Figure 1 – BCG’s approach to ROMI (Adapted from BCG material - 2010)...16
Figure 2 – BCG’s approach to secure long term ROMI (Adapted from BCG material presented to Tetra Pak) ...17
Figure 3– The marketing-effectiveness continuum (Adapted from Powell, Guy. Marketing calculator. John Wiley & Sons, 2008; p.81) ...19
Figure 4– Tetra Pak´s packaging portfolio...27
Figure 5 – Full systems supplier – from food processing to packaging and distribution systems27 Figure 6 – Marketing execution project driven model at Tetra Pak...30
Figure 7- Marketing Plan – The framework ...31
Figure 8– Tetra Pak “As is” in the marketing effectiveness continuum model” (Adapted from Powell, Guy. Marketing calculator. John Wiley & Sons, 2008; p.81) ...37
Figure 9 – Tetra Pak “To be” in the marketing effectiveness continuum model” (Adapted from Powell, Guy. Marketing calculator. John Wiley & Sons, 2008; p.81)...39
Figure 10 – Expected results in a typical case after ROMI modelling application (Adapted from BCG material 2010) ...42
Figure 11 – Model development (adapted from BCG material 2010)...45
Figure 12 – Possible model output – point of diminishing returns (Adapted from BCG material 2010) ...46
Figure 13 – Possible model output – focus investment behind likely winners (Adapted from BCG material 2010) ...46
Figure 14 – Possible model output – marketing actions that contribute more to volume – (Adapted from BCG material 2010) ...47
Figure 15 – Possible model output – vehicles with the highest volume are not always the most efficient – (Adapted from BCG material 2010) ...47
Figure 16 – Possible model output – marketing impact across portfolio (Adapted from BCG material 2010)...48
Figure 17 – Possible model output – eliminating unprofitable TV investment (Adapted from BCG material 2010) ...48
Figure 18 – Possible model output – Marketing impact by product life cycle phase (Adapted from BCG material 2010)...49
Figure 19 – BCG marketing playbook for marketing planning (Adapted from BCG material 2010) 49 Figure 20 – Example of Marketing Dashboard (Adapted from LaPointe, Patrick. Keys to An Effective Marketing Dashboard. Chief! Marketer, http://chiefmarketer.com/crm/marketing_dashboard/. 2006) ...50
Table 1– A marketing performance bell curve (Adapted from Merrick, David; Shaw, Robert. Marketing Payback, is your marketing profitable?. FT Prentice Hall, 2005. p.34) ...10
Table 2– Ambler’s marketing metrics popularity poll (Adatapted from Ambler, Tim. Marketing and the Bottom Line. FT Prentice Hall, 2003) ...11
Table 3– Examples of project metrics – consumer awareness / attitude metrics...34
Table 4– Examples of project metrics – consumer behaviour metrics ...35
Table 5– Examples of project’s Marketing intents and consumer metrics...35
1 EXECUTIVE SUMMARY
This project aims to increase the degree of understanding of influential factors on marketing
effectiveness in a food packaging business market heavily characterized by a derived demand and indirect consumer marketing investments, and at the same time to recommend a path to improve the long term return on marketing investments (ROMI). Tetra Pak – the project case - invest significant amounts in consumer marketing together with his customers and indirectly in his customers’ brands.
The proposed framework to case analysis is based on the concept of “The Marketing
Effectiveness Continuum” which helps marketers to understand the organizational issues and change management associated with delivering long lasting enhanced marketing effectiveness. The framework’s core rely on the thesis that with proper modelling and analytics, marketing can be a reliable generator of real value for your company and increase significantly the long term ROMI.
The case analysis results support the conclusion that Tetra Pak has a long way to go regarding the
level of securing the long term ROMI and linking investments to results. There is strong evidence of no development of sophisticated models for ROMI to calculate marketing efficiencies across their investments with their customers, also there is not enough knowledge of consumer response behavior to deliver further insight into marketing effectiveness, and there is no sufficient partners’ brands attention which reaches the pinnacle in understanding marketing of long term ROMI and effectiveness.
The key recommendation to address this lost opportunity to improve long term ROMI, is to
implement a marketing effectiveness modelling based on the Boston Consulting Group (BCG) approach covering the majority of the company’s marketing investment with their business partners (customers).
2 PROBLEM STATEMENT
The marketing problem identified in our case is the lack of connection between indirect marketing investment and business results, in a consistent way in order to secure long term ROMI and minimizing investment risk.
The marketing investment control function in a company operating in a business market from packaging food industry like Tetra Pak operates, assumes special relevance mainly because of the interdependence with his business partners (customers). The majority of invested amounts by the company in marketing is done indirectly with the final consumer in mind but the marketing initiatives have to be implemented in a joint partnerships with their customers (food industry) reflecting the alignment with both partners business plans and strategies.
Tetra Pak has a good performance tracking marketing investments and on strategic alignment with their partners (customers), but is clearly missing the link between those investments and its return in a consistent way. The problem is that nobody is sure about the ROMI and how to secure marketing effectiveness of these derived marketing investments? How do you improve what you are doing today? What can you do to make marketing activities performed by business partners more effective? How do you – or should even – move up to next level of sophistication in your marketing effectiveness?
These are some of the issues that I will address with this project and recommend a possible solution.
3 LITERUTAURE REVIEW
The literature review is composed of four parts. The first part focuses on key definitions of business to business marketing and derived demand. The second part clarifies the concept of marketing effectiveness and elaborates on why marketing effectiveness could be the strategic advantage for the 21st century. The third part will combine these sections by giving insights into “golden rules” when it comes to marketing in the era of accountability by elaborating on success measurement and marketing metrics and dashboards. Last but not least, the fourth section will focus on ROMI modelling for marketing effectiveness which is the central piece of our project.
3.1 Introduction to business to business marketing
Business to business marketing involves marketing of products and services to another for its own use. This newly emerging discipline has not received as much attention as business marketing to end consumers. The appeal of everyday consumer goods such as soft drinks, cars, perfumes, and fashion clothes plays a more integral role in our everyday lives; where areas we, as consumers, don’t tend to think about products such as food packaging, chemicals, component parts, capital equipment in quite some way (Wright, 2004).
Business to business marketing, however, has enormous hidden depths covering many more industrial and commercial transactions along the supply chain than practitioners might imagine. If all interactions were considered – from raw material suppliers, agents, distributors, manufactures, wholesalers and business buyers – then we would see that business to business markets are substantially larger and often more valuable than business to consumer markets and, surprisingly enough, they can be just as interesting (Wright, 2004).
Another concept linked to the business markets and to this project is the concept of Derived
demand. This term from economics, described as where the demand for one good or service occurs
as a result of demand for another. For example, demand for food leads to derived demand for packaging, as food must be packaged for food to be consumed. There are number of well-known exceptions in which industrial marketers market directly to the end consumer. Probably the most well-known case is Intel, whether it’s “Intel Inside” campaign driving the value to the consumer of having their microprocessor product – as apposed AMD – in a PC or laptop (Powel, 2008). These types of brands are called ingredient brands spend significantly to drive brand awareness through direct investment in their own brands or investment of their partners’ brands to drive derived demand, at the consumer level that they often measure interim outcomes and, in some cases, can track direct outcomes. Other ingredient brands include Dolby Laboratories, Teflon and Tetra
Pak-our project’s case.
3.2 Marketing effectiveness
Marketing faces a crisis of confidence at the top of companies and among investors. We could say that marketing is facing a midlife crisis as uncountable, untouchable, expensive and slippery are common descriptions of marketing nowadays, and marketing budgets are cut more than any others. Marketing is under pressure and is heavily characterized mainly by the following: marketing spending is volatile, swinging up and down year-to-year, marketing education needs to address the issue of payback, and people resist the introduction of controls (Shaw and Merrick, 2005).
Additionally, marketing is a complex discipline which make it difficult to predict or control the effect of marketing actions: the difficulty to know the sales response to a single marketing instrument (example: Advertising); the marketing mix interaction, the competitive effects, the delayed response of most marketing actions, and multiple territories and products, are examples of marketing characteristics that contribute to such complexity (Lilien, Kotler and Moorthy, 1992).
In general, marketing has not been effective at driving consistent results. During the heyday of the late 1990s, spending exorbitant amounts of money on different marketing schemes was a must. Marketers have to became more creative and deliver programs that can drive more revenue and profit at the same cost as we have to prove that they are better than any previous program. Many statistics reveal the following (Powel, 2008):
• Thousands of products are launched and quickly fail
• Most sales promotions lose money
• Most advertising investments are wasted: “Half of my advertising is wasted; I just do not know which half”. – John Wannamacher’s famous quote.
3.2.1 What is marketing effectiveness?
The purpose of marketing effectiveness is to optimize marketing spend for the short and long term in support of, and in alignment with, the brand/company strategy by building a market model using valid and objective marketing metrics and analytics (Powel, 2008).
Marketing effectiveness has two primary components: optimization of the consumer-facing actions (direct marketing, public relations, channel promotions, advertising, personal selling, and customers support and service) and the organizations of the infrastructure to support the optimizations of these actions (Powel, 2008):
• Marketing spend – this includes all consumer-facing investments made to drive
incremental revenue and profit;
• Short and log term – marketing has to make the right decisions to drive
incremental short-term results, such as revenue, profit, cash flow, or share, and to put the company into a position to reap long term results;
• Market model – having a model of what works and what doesn’t, and by how
much allows marketers to make the right marketing decisions. By developing marketing plans that spend in the right areas, in the right amounts, and at the right time, marketers can deliver extraordinary results;
• Valid and objective marketing metrics and analytics – Models of consumer
response to marketing stimuli must be abased on the right data, the right metrics, and the right modeling & analytics.
3.2.2 The new strategic advantage
When we think of strategic advantage we think of product differentiation, or the development of a differentiated brand value for a particular consumer segment, or many other combinations of real or perceived differentiation in the minds of the consumer. But, in many industries, very little differentiation is possible. For instance, what is the intrinsic difference between the ways that main players in mobile phone industry? They all offer their services through company-branded retail outlets. Their advertisement has similar messages. One has the fewest lost connections. The other one has the biggest network. Although one may have short-term advantage through exclusive deals with new cell phone models, does one or the other tell have better coverage? Does one have a better product or service? Are there really significant differences in their pricing plans? Is customer service from on provider significantly different than the other provider? Can the consumer really tell any difference? (Powel, 2008).
Indeed, many industries face these same types of challenges. There is no underlying opportunity for the manufactures to differentiate themselves. Many have begun to do this through process automation, improved consumer service, and improvement in other areas. The last opportunity for them to make substantial improvements is now in their marketing operations and processes. The delivery of persuasive, effective communications into the market place can be optimized and enhanced in significant ways to drive increasing revenue, profit, cash flow, growth, and share at lower cost and risk (Powel, 2008).
Whether a company has significant, perceived differentiation in the market place or not, it can develop a strategic advantage in the way it executes its marketing. In cases where there is little left to differentiate, strategic advantage can still be gained by doing one thing better than competition. It does not matter whether the company is a Fortune 100 consumer-packaged-goods provider, or a small business, as in each case it may have competitive advantage in its own category. But, in order to stay alive, it must continuously find new ways to deliver strategic advantage. The improvement
of long term marketing effectiveness is that new strategic advantage (Powel, 2008).
3.3 Marketing metrics – demonstrating success
A common question asked by senior managers is “what measure can I use to determine if my
company’s marketing is effective?” The answer is that there is no single measure that accomplishes
this. Companies develop with their own unique DNA, including vision, strategies, corporate culture, hiring practices, products and customers. No two companies are identical, even when competing in the same markets with similar products. Relying on industry benchmarks is useful as starting point, but benchmarks hide the biases arising from competitors that have vastly different cost structures, distribution networks, compensation practices and even company cultures. Companies’ management must begin by understanding the context of their business situation (Davis, 2007).
A metric is a measuring system that quantifies a trend, dynamic, or characteristic. In virtually all disciplines, practitioners use metrics to explain phenomena, diagnose causes, share findings, and project the results of future events. Throughout the worlds of science, business, and government, metrics encourage rigor and objectivity. They make it possible to compare observations across regions and time periods and they facilitate understanding and collaboration (Farris, Bendle, Pfeifer, Reibstein, 2006).
Research by Binet and Field (2007) from IPA’s (Institute of Practioneers in Advertising) based in a sample of 880 case studies and analysis, built a set of golden rules for measurement of marketing effectiveness. Bellow there is a selection of these recommended rules that I believe that better suits the scope of this project:
• Use a balanced scorecard of multiple measures to evaluate your marketing campaign, rather than a single metric. It is the number of measures that improve significantly, that indicate commercial success, not any a single movement.
• Use hard data to measure effectiveness of your marketing campaign. Use intermediate measures to explain how it works and (with many combined as metric of metrics) as provisional leading indicators of effectiveness, until hard results become available.
• The primary objective of all commercial campaigns is profit, so if possible use econometrics to measure financial payback.
• Try to account for other factors when judging the business success of your campaign. Focus on market share rather than sales. Use value measures rather than volume. If possible, use econometrics to take full account of all the factors that affect demand.
• Penetration is generally a more important metric than loyalty. But ideally, use a balanced scorecard of behavioral metrics that reflects how communication might be expected to work for your brand.
3.3.1 Marketing Metrics: opportunities, performance, and accountability
Attention to the financial impact of marketing actions is not new, but global competition, recession, and stock market pressure have increased the push for marketing accountability. Further, the large and increasing portion of shareholder value (market capitalization) that it’s seen as attributable to
“intangible” assets such as customers and brands has strengthened the need to link marketing
Besides the IPA’s golden rules application previously presented, diagnosing poor results requires more than a few numbers and there is an urgent need for managers to look more closely at cause-and-effect. Marketing expenditure contributes to increasing profits by increasing process and volumes, and reducing operating costs. For many marketing executives, marketing success stories are useful to silence critics and to intimidate the doubters by blinding them with science. However, cracks are breaking out in the marketing edifice, doubts surfacing about the marketing story, and these flaws are beginning to worry marketers (Shaw and Merrick, 2005).
Treasures-troves of marketing awards are handed out each year, in ceremonies that attract press and practioneers. Success stories sound plausible but they are always conjectural. Where is the proof? Where are the data? Advertising seems self-evident as a driver of success, yet its effect turns out to be very, very hard to catch in the act of changing consumer behaviour, markets being so full of other influences (Shaw and Merrick, 2005).
Even the majority of success stories are true, we cannot move from the particular to the general “to prove that marketing works” always. Clancy and Krieg (2000) calculate that, applying the Pareto principle, it is probable that 20% of all marketing spending creates 80% of the value, following the classic performance bell curve - See next table (Shaw and Merrick, 2005).
Table 1– A marketing performance bell curve (Adapted from Merrick, David; Shaw, Robert. Marketing Payback, is your marketing profitable?. FT Prentice Hall, 2005. p.34)
Zone of death wish marketing Zone of exceptional marketing Zone of death wish marketing Zone of exceptional marketing
WELL BELLOW AVERAGE 2% 14% BELLOW AVERAGE 68% AVERAGE MARKETING PROGRAMME 14% ABOVE AVERAGE WELL ABOVE AVERAGE 2% MARKETING PERFOMANCE
EMBARASSING TROUBLE DISAPOITING PLEASING AMAZING
Market share growth Precipitous decline Significant decline
Modest decline Significant increase Dramatic increase New product success rate 0% 5% 10% 25% 40%+
Advertising ROI Negative Very unprofitable Marginally unprofitable
Profitable Very profitable Consumer and
trade promotion
Disaster Very unprofitable Marginally unprofitable
Profitable Very profitable Customer satisfaction 0-59% 60-69% 70-79% 80-89% 90-95% Customer retention / loyalty 0-44% 45-59% 60-74% 75-89% 90-94% Customer acquisitions programme
Disturbing losses Significant losses Marginal losses Break even Profitable
Brand equity Dramatic declines
Significant declines
Modest declines Stable Improving
Clancy and Krieg (2000) comments that “The evidence that we have collected over a decade on the
performance of marketing programs for consumer and business-to-business products and services incontrovertibly shows that most marketing programs do not provide acceptable return on investment…In fact, an astounding 84% of today’s marketing programs are unprofitable…Marketing is the engine that drives growth, but the engine is in desperate need of an overhaul. And a major problem we see is testosterone decision making – usually male chief marketing officers, advertising directors, and brand managers choosing among alternatives quickly, decidedly, and without real information. It is the mainly way to screw up.
They tell us that their decision is intuitively appealing. To us this means that it is the same decision everyone else would make. It the commonsensical thing to do. Yet our research and experience suggests that decisions made on intuition alone rarely lead to successful outcomes. We instead
believe that counter-intuitive thinking grounded in rigorous analysis of unimpeachable data is the key success in marketing” (Shaw and Merrick, 2005).
A growing multitude of experts now argue that marketing’s success can be assured by gazing at a handful of magic numbers – non-financial numbers such as customer loyalty and brand preference - which are claimed to be inextricably linked to the financial results. The study has small handful of non-financial numbers is advocated in popular business tracts such as The Loyalty Effect (Recichheld 1996), Brand Valuation (Haigh 1996) and Marketing and the Bottom Line (Ambler 2003).
In these accounts of marketing, just a few numbers are conjured up to provide proof of marketing’s success. Ambler (2003) has tracked the magic numbers used by marketers over several years. Next table shows the results of his popularity poll.
Table 2– Ambler’s marketing metrics popularity poll (Adatapted from Ambler, Tim. Marketing and the Bottom Line. FT Prentice Hall, 2003)
METRIC % OF FIRMS
USING MEASURE
% THAT REACH THE TOP BOARD %GIVING TOP RATING FOR MARKETING PERFORMANCE ASSESSMENT Awareness 78,0 28,0 28,0 Market share 78,0 33.5 36.5 Relative price 70.0 34.5 37.5 Number of complaints 69.0 30.0 45.0 Customer satisfaction 68.0 36.0 46.5 Distribution / availability 66.0 11.5 18.0
Total number of customers 65.5 37.4 40.0
Perceived quality/esteem 64.0 32.0 35.5
Loyalty / retention 64.0 50.7 67.0
Ambler (2003) notes that many measures such as awareness and distribution are widely used by marketers but not really considered accurate as indicators of performance. He also notes that Boards typically do not receive all the key measures of marketing performance. Marketers are by no means immune to the drive toward quantitative planning and evaluation. Marketing may once have been regarded as more an art than science. Executives may once have cheerfully admitted
that they knew they wasted half of the money they spent on advertising, but they didn’t’ know which half. Those days are gone (Farris, Bendle, Pfeifer, Reibstein, 2006).
Today marketers must understand their addressable markets quantitatively. They must measure new opportunities and the investment needed to realize them. Marketers must quantify the value of products, customers, and distribution channels – all under various pricing and promotional scenarios. Increasingly, marketers are held accountable for the financial ramifications of their decisions (Farris, Bendle, Pfeifer, Reibstein, 2006).
3.3.2 Keys to an effective Marketing Dashboard
We already now that marketers must understand their addressable markets quantitatively. But how to put it in practice? A marketing dashboard could be the solution.
A marketing dashboard provides you with the same up-to-the minute information necessary to run your operation – sales vs. forecast, distribution channel effectiveness, brand equity evolution, human capital development – whatever is relevant to the role of marketing in your organization. An effective dashboard might focus on only three critical metrics or show the top 20. It could appear in your inbox monthly in the form of a nice colour printout or be beamed over the company intranet first thing each morning. (LaPointe, 2005).
Marketing effectiveness measurement has been characterized by great progress in quantifying the quantifiable. As an industry, have made some terrific strides in measuring those things for which data is available. They’ve learned to build mix models to optimize media expenditures. They’ve reallocated resources across channels and products. And they’ve gone a long way in many industries to understanding customer-specific initiatives (LaPointe, 2006).
The most useful marketing dashboard allows you to measure and manage your marketing effectiveness in ways you probably haven’t tried. It will verify all the things that are working well. It will also shine a bright light on systems, projects, staff, and processes with the opportunity to improve. It will change the away you gather information while helping you to simplify the complex words of moving measurement targets. Most of all, an effective dashboard will focus your thinking and significantly improve the way you communicate it to others. And yes, it just might reveal for all to see where the marketing investments are paying off and where they are not. But how do you get to the “right metrics” and what are the elements of an effective marketing dashboard? (LaPointe, 2006).
LaPointe (2005: 28) refers that a marketing dashboard is made up of the following parts:
1. Business Objectives: The starting point. These are the goals of the company, translated into
a set of marketing objectives.
2. Initiative ROI&resources allocation: An important part of the dashboard is measuring the
incremental cash flows generated by marketing programs and initiatives in the short term. 3. Brand and asset evolution: at least equal importance to the short-term results is the
longer-term evolution of the corporate assets entrusted to marketing – most often including the brand and the customer perceptions/relationships. The dashboard can provide a read of how the assets have been growing and how they are likely to progress.
4. Skills, Process & Tools: a well rounded dashboard tracks the skills and competencies of
the marketing team against a clear set of proficiency goals; Less a metric than a enabler, successful dasboarding employs and continuously refines tools to increase insight and reduce effort in both producing and distributing it.
5. Diagnostic insight: The dashboard must push beyond portrayal of what is happening to
why it is happening, providing insight into where prior expectations were inaccurate to help hone the process of setting expectations and forecast for the future.
3.4 Return On Marketing Investment modeling – the BCG approach
ROMI is defined as the optimization of marketing spend for the short and long term in support of the brand strategy by building a market model using valid, objective marketing metrics. Lennskold (2003: 15) refers that ROMI presents a new and better way to strengthen companies competitive positioning by solidifying the management of your marketing expenses. Improving ROMI leads to improved marketing effectiveness, increased revenue, profit and market share for the same amount of marketing spend.
There are two forms of the ROMI measurement. The first, short term ROMI, is also used as a simple index measuring the amount of revenue (or market share, contribution margin or other desired outputs) for every amount of marketing spend. For example, if a company spends € 100,000 on a direct mail piece and it delivers €500,000 in incremental revenue then the ROMI factor is 5.0. If the incremental contribution margin for that €500,000 in revenue is 60%, then the margin ROMI (the amount of incremental margin for each dollar of marketing spend is 3.0 (= 5.0 x 60%). The value of short term ROMI is in its simplicity. In most cases a simple determination of revenue per euro spent for each marketing activity can be sufficient enough to help make important decisions to improve the entire marketing mix.
In a similar way the second ROMI concept, long term ROMI, can be used to determine other less tangible aspects of marketing effectiveness. For example, ROMI could be used to determine the incremental value of marketing as it pertains to increased brand awareness, consideration or purchase intent. In this way both the longer term value of marketing activities (incremental brand awareness, etc.) and the shorter term revenue and profit can be determined. This is a sophisticated metric modelling that balances marketing and business analytics and is used increasingly by many of the world's leading organizations (Hewlett-Packard and Procter & Gamble to name two) to measure the economic (that is, cash-flow derived) benefits created by marketing investments. For many other organizations, this method offers a way to prioritize investments and allocate marketing and other resources on a scientific basis.
One of these sophisticated approaches that could be used for long term ROMI modeling is the Empirical Response Models (ETS) which focus is the analysis of the relationships between marketing mix variables that are controlled and performance measures, such as sales or market share, which represents the outcomes of marketing plans. For every brand and product category there exists a process generating its sales. Sales response functions and market share models are now core ideas of marketing science (Hanssens, Parsons, Schultz, 2001).
The scope of our project is the long term ROMI. Focusing on long term ROMI and metrics can
yield big pay-offs such as: reductions of inefficient spending, rreallocation of marketing spending to improve tactics, shortened marketing process times, increased profit and mmarketing professionals who focus on marketing metrics and accountability earn more thank those who don’t (Powel, 2008).
Marketing has two main challenges when it comes to long term ROMI: First - How to allocate spend across markets and brands with different starting points and dynamics? What marketing mix and spend is optimal for a given brand and market? Second- How does it affect short term sales and longer term brand objectives?
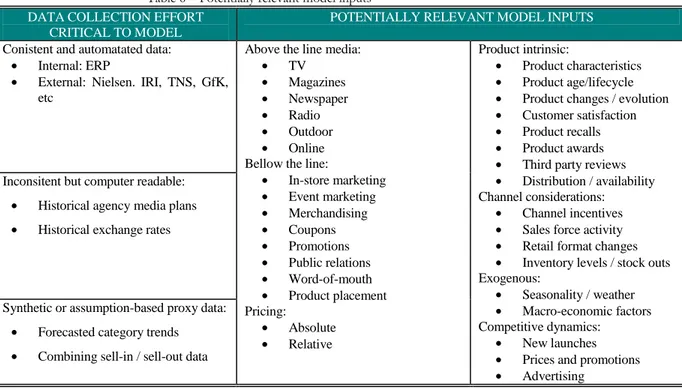
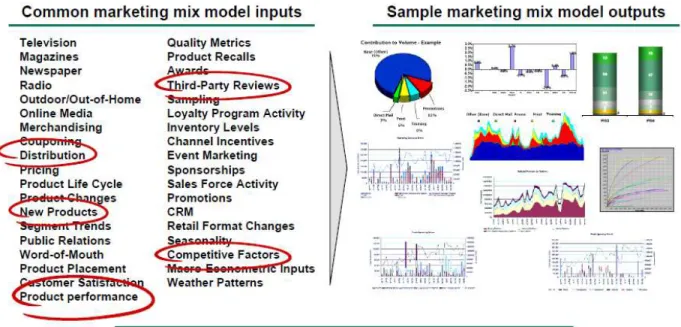
ROMI modelling start with marketing mix models quantifying the sales impact of various marketing activities and determine effectiveness and ROI for each marketing activity. The optimization techniques can provide a roadmap for the future by showing how to adjust marketing strategies, plan budgets, manage channels, create pricing strategies, and produce the highest return for your marketing investments. ROMI modelling typically include all relevant advertising vehicles into standard marketing mix models, and deep dives into those models encompassing a broader range of marketing tactics as well as other environmental factors. This approach enables the model results to provide accurate sales response measures by vehicle that let marketers build more effective media plans. The scope includes the track advertising effectiveness on all types of vehicles: TV, Magazine Print & ROP, Radio, Online, Outdoor/Out of Home, In-Store Radio/TV,
Advertising effectiveness analytics involve examining a wide range of factors, including audience selectivity, reach potential, speed of audience accumulation, geographic flexibility, creative executions, and media weights. It measure ad response by campaign so effectiveness can be compared through key advertising metrics, including carryover after air date, saturation, and diminishing returns levels. Direct and halo effects can also be measured to determine portfolio level effectiveness.
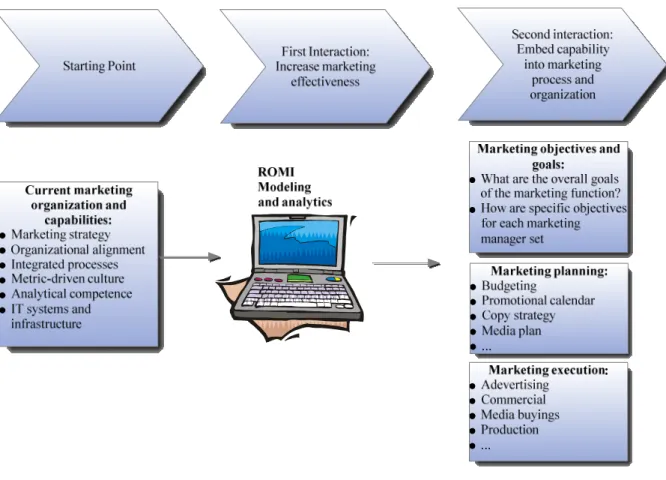
BCG has a approach that could apply to our case study for modeling ROMI. The consultant firm has been implementing this approach to help companies either reducing their marketing investments without compromising the results, or increasing significantly the return. The recommended approach described in the following figure is based on a strong data collection, analytics & modeling complemented by proper organizational design and changes.
To secure long term ROMI improvement it is require more than tools. In this approach it is critical to embed capability into marketing process and organization and really build a marketing effectiveness culture across organization.
Figure 2 – BCG’s approach to secure long term ROMI (Adapted from BCG material presented to Tetra Pak)
4 A FRAMEWORK TO MARKETING EFECTIVNESS IN A BUSINESS MARKET
The proposed framework for this project uncovers the components of driving increased marketing effectiveness and can be applied to just about every industry and marketing challenge. It demystifies how marketers can significantly improve their measurement and management infrastructure in order to improve their return on marketing effectiveness.
The proposed framework is based in the concept of “The Marketing Effectiveness Continuum” which helps marketers understand the organizational issues and change management associated with delivering long lasting enhanced marketing effectiveness. More than that however, is how each of the concepts can be directly applied to their marketing environment. With proper
measurement, modelling and analytics, marketing can be a reliable generator of real value for the company. Connecting marketing activities can increase revenue, profit and market share, putting the company on the critical path to corporate success.
4.1 The Marketing Effectiveness Continuum model
The project basic framework assumption is that proper ROMI modelling tends to contribute significantly to increase ROMI. How do you improve what you are doing today? What can you do to make marketing activities more effective? How do you – or should even – move up to next level of sophistication in your marketing effectiveness?
As marketers move their organizations up the marketing effectiveness continuum, the results delivered from their ability to gauge the effectiveness of their decisions will allow them to move from making more tactically oriented decisions to making more strategically oriented decisions. Its
raison d’être is to benchmark progress and develop plans to move to the next level along the
Once a company has benchmarked their current level on the marketing-effectiveness continuum, they can use the Marketing effectiveness framework to map a course for improved marketing ROI. By using the marketing-effectiveness continuum, marketers can make superior decisions about the definition of marketing programs, the allocation of marketing resources, and response to competitive initiatives, which should lead to improved results at lower cost and risk (Powel, 2008). The marketing-effectiveness continuum classifies an organization’s marketing effectiveness into five levels (Powel, 2008):
• Activity trackers
• Campaign measures
• Mix modellers
• Consumer analyzers
• Brand optimizers
Figure 3– The marketing-effectiveness continuum (Adapted from Powell, Guy. Marketing calculator. John Wiley & Sons, 2008; p.81)
Activity Trackers Campaign Measurers MIX Modelers Consumer Analysers Brand Optimizers
Level of ROI modeling ROMI Activity Trackers Campaign Measurers MIX Modelers Consumer Analysers Brand Optimizers
Level of ROI modeling ROMI
Activity trackers – The activity tracker classification represents the first step to improving
marketing effectiveness. Many marketers have difficulty tracking their activities and attaching costs to them. The key criteria for an organization to be an activity tracker is that marketers focus on activities alone – before link those, activities to revenue, margin, or some other result. Even the largest of organizations have entire divisions, product lines, or regions that are operating completely blind. Becoming an activity tracker can seem daunting, because now clear and concise information across all segments, products, categories, channels, and media must be tracked to show what was spent and how it was spent. For these companies, their next big challenge is to start tracking all of their marketing activities. Once this is done, they will have a baseline of data with which they can take their marketing analytics to the next level. Becoming an activity tracker requires the systematic tracking of activities in the past, and the planning of activities looking into the future. This is a simple test: your company or marketing department is an activity tracker if it can produce both a report that shows associated amounts for all activities having taken place over the last tree years, and a plan of the upcoming activities and associated amounts over the last 12 months (Powel, 2008)
Campaign measurers – Campaign measures can directly measure the results of their
direct-response marketing activities. They can link either revenue, contribution margin, or discounted cash flows to the cost of marketing activities in order to calculate ROMI. Or, they can link indirect results, such as leads generated or the incremental purchase intent or brand awareness developed. The effort required to take this step can be significant for an organization depending on many factors including: the maturity of the brand, product, or division; business-to business versus consumer market; the availability of data; or the channel structure, to name a few. But doing so generates valuable insight into which marketing programs are truly delivering ROMI. For example, the quality of a particular program can be compared against a hurdle rate to determine if the planned programme will deliver the right level of results for a given level of investment and program risk. With this information, budgets can be allocated and marketers can begin to execute their activities (Powel; 2008).
Mix modelers – Mix modelers develop sophisticated models of their markets and calculate
marketing efficiencies across their entire marketing mix. Marketing-mix modelling that uses statistical regression analysis, although more advanced system dynamics or other methods can be used. Statistical analysis develops the best-fit correlation between independent variables (i.e., your marketing inputs) and dependent variables, such as revenue or unit volume. With these types of modelling tools, marketers can now develop effective models to deliver increased revenue and margin across the entire marketing-mix. Additionally, marketers can utilize marketing-mix modelling to measure complex market dynamics such as: Advertising saturation, diminishing returns, and breakthrough; Synergy between marketing media; Halo and cannibalization; Baseline revenue calculation.
Consumer analyzers – Consumer analyzers use their knowledge of consumer response behaviour
to deliver further insight into marketing effectiveness, including incremental value of the brand. By combining data from their major competitors in the category with a greater understanding of the consumer, consumer analyzers can start to answer tactical and strategic questions. What merges from a model of consumer behaviour could be the simulation of the future with great accuracy. With this level of modelling and simulation, tactical and near-strategic decisions can be made with confidence. Even more remarkably, marketers can utilize simulation methods to answer more challenging questions, including: What is the best marketing mix to launch a new product into a new or existing category? What the diffusion dynamics in the market? What is the ROI and expected response to non-traditional media? How can we avoid a price war?
Brand optimizers – Brand optimizers reach the pinnacle in understanding ROMI and
effectiveness. They can evaluate not only how specific program or mix helps to determine increased revenue, profit, or share, but they can also evaluate the impact marketing activities have on the share price. With this information, the particular brand can be valued with the purpose of making a strategic decision of whether a brand should be bough, sold, merged, or totally realigned.
4.2 Climbing the Marketing- effectiveness continuum
Moving up the continuum is not just about executing programs more completely. It is the implementation of structural changes in the marketing organization to look for opportunities to improve the data-gathering process, the measurement and metrics processes, and the analytics function – with the goal o squeezing more results out of every marketing program investment. Making consistent, repeatable small steps to improve the infrastructure is critical to long-term success. It is not enough to improve measurement in one quarter and forget about it in subsequent quarters. The small increments of organizational change must be real, long-lasting, and independent of personnel. They must be systematic and preferably supported by technology, organizational infrastructure and training (Powel; 2008).
Marketing must optimize investments although, in some cases, improvements must come in small measured steps, with the end-result of major improvements for the company as a whole. In other cases, companies can make giant leaps in their effectiveness if they are able to marshal their teams to make significant changes in the way they think about marketing activities and what it takes to drive more revenue in a measurable consistent fashion. Often, however a company can not simply move all at once from where it is today to where it wants to be. Many small consistent steps allow continuous improvement, without the cost and risk of significant organizational and political disruption. The marketing-effectiveness continuum helps companies to benchmark their
current effectiveness, determine weakness that can be corrected in the short term, and allow them to plan where they can be in the long term (Powel; 2008).
5 RESEARCH METHODOLOGY – THE CASE STUDY
The chosen method – case study - allows a deep description of real business situations and practices in organizations, although it is necessary to take precautions building generalizations and inference, due to specific context of the case. From other perspective, the case study approach only describes problems and opportunities that organizations facing, and the way this particularly case is developed reflects a case specific approach and allows the integration of the knowledge assimilated by the recommended bibliography review, within the specific context of the case study (Yin; 1986). The chosen Tetra Pak’s case and secondary data analysis it serves as a vehicle to derive general implications and recommendations for other similar companies which are based business to business model and at the same time are investing indirectly heavily in marketing with the final consumers in mind. Nevertheless, the study relies on a sound theoretical framework allowing deductive reflection of various accepted concepts.
The case study method has been used more often in business research projects, although does not exist one definitive definition. The definition which better fits the present case is an empirical research that (Yin; 1986):
• Investigates a contemporary phenomenon within his real context; where
• The boundaries between phenomenon and context are not evident at all; and where
• The researcher uses multiple sources of evidence.
Primarily, the project is based on a sound theoretical framework, relying on books and papers. By reading up on the topics and concepts surrounding business-to business marketing, marketing effectiveness, marketing modelling and accountability, and ROMI modelling, a general overview is established that helps to define the scope of the project as well as its boundaries and limitations. Secondary data enables to cover case study generally and to identify the main gaps of the
6 CASE ANALYSIS
6.1 Background
The measurement of marketing effectiveness has become one of the most important business needs today as companies face increasing pressures to demonstrate financial returns across the organization from shareholders, investors, senior managers and board of directors. Some of the world most valuable brands belong to business marketers: ABB, Caterpillar, DuPont, FedEx, GE, Hewlett-Packard, IBM, Intel, Siemens, and Tetra Pak. They need to embrace holistic marketing principles, such as building strong relationships with their customers, just like any marketer, but there are some unique considerations selling to other business, especially in a derived demand business model with indirect consumer marketing investments.
The food packaging industry, where Tetra Pak operates, is a case of derived demand, where the package sales are ultimately derived from consumer demand for packed goods, for this reason, the business marketer must also closely monitor the buying patterns of the ultimate consumers. This project will concentrate on investigating the best practices in order to secure the marketing investments effectiveness in a business market of packaging systems for food industry.
The case is structured as follows: 1)Company Overview; 2)Marketing Planning and Execution at Tetra Pak; 3)Measuring marketing effectiveness at Tetra Pak.
6.2 Company Overview
Tetra Pak PROTECTS WHAT’S GOOD™. That’s not only company’s motto—it’s an aspiration that’s reflected in every aspect of its business. As the world’s leading food processing and packaging solutions company, Tetra Pak is committed to making food safe and available, everywhere. And this commitment extends far beyond protecting the contents in a package. It also includes support their customers’ businesses, a responsibility to reduce their environmental impact, and shape a better future for all their stakeholders—from employees, to suppliers and the communities in which it operates. Headquartered in Lausanne, Switzerland, Tetra Pak employs more than 20,000 people in over 150 countries. It is one of three independent industry groups that belong to the Tetra Laval Group, a private industrial group.
6.2.1 A History of Innovation
More than 50 years ago, the founder, Dr. Ruben Rausing, began testing an innovation that would change the way food was distributed around the world. He wanted to create a practical, cost-effective package for milk and cream—which up to this point were sold primarily in glass bottles or loosely over the counter. With this inspiration, Dr. Rausing founded Tetra Pak in Lund, Sweden. In 1952 the first Tetra Pak machine was delivered and in 1961, Tetra Pak launched a breakthrough innovation: the world’s first aseptic carton--a package which enables milk and other perishable liquid foods to remain on the shelf for more than six months without refrigeration or preservatives. By integrating high barrier aluminium and polyethylene with carton board and using a special technique to sterilise the package’s contents, aseptic technology ensures that both the food and the packaging are free of harmful bacteria. The International Institute of Food Technologists recognised aseptic processing technology as “the most important food science development of the 20th century.”
Over the last 50 years Tetra Pak has developed aseptic packages of different sizes, shapes and methods of opening and closing. Tetra Pak packages and processing equipment are used throughout
6.2.2 Making Food Safe and Available, Everywhere
Many people think of Tetra Pak as a packaging company, but that’s just one part of his business. They work closely with customers and suppliers to produce complete processing, packaging and distribution systems for the food and beverage industry. Tetra Pak not only supplies packaging machines but also processing systems, distribution equipment, software and support services. It is a one-stop shop that can meet all our customers’ food processing and packaging needs. Tetra Pak meet the everyday needs of hundreds of millions of people around the world with products that are safe, innovative and environmentally sound.
6.2.3 Responsible, Sustainable Industry Leadership
Founder Dr. Ruben Rausing once said “a package should save more than it costs.” This philosophy has become an integral part of their business—as the company set out to achieve profitable growth in a socially responsible and sustainable way. For more than 40 years Tetra Pak has been involved in school milk and other feeding programmes. As a result of our cooperation with local governments, customers and Non-Governmental Organizations (NGOs), 45 million children around the world receive milk or other nutritious drinks in Tetra Pak packages in school. The environmental commitment is embedded in every aspect of their operations and product life cycle—from increasing the percentage of renewable resources in our packaging material to sourcing raw materials from well managed, sustainable forests to facilitating and promoting consumer recycling. The group is also committed to reducing our carbon foot print. In fact, they have set an ambitious target to reduce our CO2 emissions by 10% in absolute terms by 2010—a goal well on target to meet.
6.2.4 Porfolio – A full systems supplier
Figure 4– Tetra Pak´s packaging portfolio
Tetra Pak supply complete integrated processing, packaging and distribution lines, and stand-alone equipment, carefully tested to make sure they give you optimal performance. This means you have a short start-up time and enjoy problem-free production right from the start. They automate entire processing and packaging lines, train staff to operate them and assist in getting your operations up and running. Once you start producing, their team will service your line and plan maintenance. They can also help you with distribution planning, marketing support and packaging designs.
Figure 5 – Full systems supplier – from food processing to packaging and distribution systems
6.2.5 2008 in brief
From Tetra Pak press release published in April 2008: “Tetra Pak today announced net sales of €8.8 billion in 2008 - up 5 percent from 2007 in comparable terms. Packaging Solutions reached €7.8 billion in sales in 2008 - an increase of 4.5 percent over 2007 and sales of Processing Solutions reached €949 million in 2008, up 9.3 percent over the previous year.
Continuing growth in Central and South America, the Middle East, China, South and Southeast Asia and also in North America and Southern Europe drove the rise in Packaging Solutions’ sales, while Processing Solutions benefited from new sales generated by the acquisition of two specialist food processing firms as well as sales growth in virtually all regions. Overall, sales growth declined during the last quarter of 2008 due to a slow down in capital equipment investment and lower demand caused by stalling economies and the global credit crunch.
“During these economically difficult times it is more important than ever to provide our customers with value-driven solutions. With our current strategy, investments to meet market needs and drive to continuously improve quality and operational efficiency we are well positioned to support our customers to remain competitive,“ said Tetra Pak President and CEO Dennis Jönsson.
In 2008, Tetra Pak continued its planned investment in new plant and equipment around the world, announcing plans to invest to build a state-of-the-art packaging material manufacturing plant in Pakistan and in new equipment in order to increase production in Brazil and Italy.
Tetra Pak launched two breakthrough product solutions in 2008 as part of the company’s drive toward cost-effective innovation:
• Tetra Pak iLine™ solutions, a new generation of high-performance aseptic carton packaging solutions takes line integration and automation technology to a new level thanks to a novel process control and information management system. Depending on the configuration, the more robust and operationally efficient Tetra Pak iLine™ solutions customers to increase capacity and reduce operational costs by up to 40%, depending on the configuration. This product portfolio includes the Tetra Pak® A3/CompactFlex iLine, the Tetra Pak® A3/Flex iLine and the Tetra
• Tetra Lactenso™ Aseptic, a new generation of customized aseptic production solutions that enable dairy producers to achieve superior and consistent product quality while reducing operating costs by up to 20 percent and minimizing their environmental impact. The company developed a new approach in which Tetra Pak custom-designs an end-to-end production solution for each customer based on their particular performance requirements. Tetra Lactenso Aseptic solutions contain new technologies, such as Energy Hibernation and IntelliCIP and upgraded existing equipment such as the Tetra Therm Aseptic Flex for indirect UHT treatment, and Tetra Alsafe aseptic buffer tank.
In addition, Tetra Pak launched the Tetra Top® packaging solution for high acid ambient distribution (HAAD) of still drinks and global availability of Tetra Gemina™ Aseptic, the world's first roll-fed gable top shaped package with full aseptic performance for the packaging of both juice and milk-based products.
In 2008 Tetra Pak supplied a record 141 billion individual packages used by leading food and beverage companies around the world to deliver over 70.6 billion litres of milk, juice, fruits and other products to consumers. That represents a 3% rise over the number of beverages consumed in Tetra Pak cartons in 2007.
“Despite today’s tough economic situation we are confident in the future of the food sectors in which we operate,” said Jönsson, noting that consumption of basic nutritional food products such as milk and juice continues to grow.
The company also supplied an additional 503 packaging machines, 1,838 processing units and 1,372 pieces of distribution equipment in 2008. Tetra Pak operates 16 technical training centres, 41 technical service centres and 12 research and development facilities around the world to ensure continued product innovation and excellence in customer service.
6.3 Marketing planning, execution and control at Tetra Pak
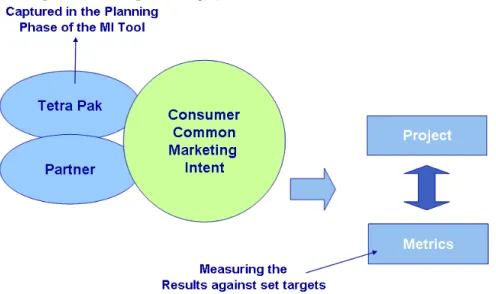
The majority of invested amounts in marketing by Tetra Pak is done with the final consumer in mind but the marketing initiatives have to be implemented in a joint approach with their customers (food industry) reflecting the alignment with both partners business plans and strategies. Tetra Pak has established product and category objectives and associated positioning and promotional strategies within the consumer domain. Tetra Pak has identified that collaboration with partners in joint marketing projects is an efficient and effective way of implementing its positioning and promotional strategies towards consumers.
Marketing investment is based on clear marketing intent, derived from Tetra Pak’s strategy and directly linked to initiatives defined in regional Business Plan (BP). If the common marketing objective between Tetra Pak and a partner coincide, a joint marketing intent is established which is the basis for a marketing support project. Therefore Tetra Pak has established set rules to ensure an objective process behind the allocation of resources for these projects. Tetra Pak marketing investment projects are built upon the clear and strong foundation that they are driven by pure marketing objectives.
Marketing investment is one of Tetra Paks’s most important investments. It enables to drive the business toward sustainable and profitable growth, based on Category and Portfolio objectives, and focusing on company’s strategic imperatives.
6.3.1 Marketing plan
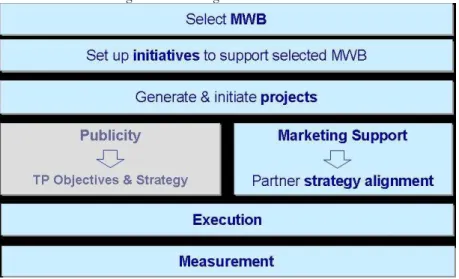
The positioning and promotional strategies are rooted in Tetra Pak’s corporate strategy, the Must Win Battles (MWB)1 and Business Plan Initiatives, defining the long term objectives. Tetra Pak uses two types of promotional investments to achieve its objectives: Publicity and Marketing Investment. The scope of our case analysis is the Marketing Investments type.
Figure 7- Marketing Plan – The framework
6.3.1.1 Marketing Investment
Marketing Investment is defined as projects, based on a common marketing intent between Tetra Pak and a partner, towards consumers, conducted in cooperation and co-funded by Tetra Pak and the partner. It is rooted in the BP as a key element of Tetra Pak strategy to influence consumers’ attitudes and behaviour and reach defined marketing objectives.
Marketing Support flow
1- Select MWB - Tetra Pak strategy is expressed in the MWBs. Regions focus on main
opportunities, where balance of Market Share & Product Profitability can significantly contribute to overall objective.
2- Set up initiatives to support selected MWB - To address the selected MWB and the 17 key
strategic Initiatives at corporate level, regional strategies are defined in the BP through regional initiatives covering categories, product groups/systems, partners,
3- Generate & Initiate projects - The initiatives with marketing intent, i.e. aiming at influencing
consumer attitudes and behaviours as well as develop products or categories, will require marketing investments through marketing support projects. In this phase, the most important is to define the marketing intents (i.e. “reason why”) behind the projects.
4- Partner strategy alignment based mutual marketing benefit - Once Tetra Pak’s marketing
intent is defined, potential partners will be assessed in non-discriminatory way to identify which of them has a marketing intent and marketing means that coincide and allow establishing a common marketing intent. The partnership makes sense in the context of the category if a common marketing intent can be identified. Then, Tetra Pak and the partner will define activities to achieve a common project objective. Metrics will be set to measure the efficiency of the project and budget as well as financial contribution by both parties will be agreed.
6.3.1.2 Marketing Activities
If the starting point of the project is driven by regional initiative, category and/or system objectives and the common marketing intent is consumer focused, it is likely that individual marketing activities supporting the project will be acceptable. It is the responsibility of Tetra Pak’s marketer in charge of the project to ensure that activities are selected and executed according to good marketing practices and principles. The list below gives some examples:
Above the Line (AtL) advertising activities
Media activities where consumers or other agreed target groups are reached via specific advertising space and time purchases to primarily affect awareness and attitudes, e.g. TV, newspaper, magazine, internet, billboard / outdoor, etc. Associated agency fees and production costs are also allowed. It is recommended that reputable media agencies are used when planning and executing media activities.