Repositório ISCTE-IUL
Deposited in Repositório ISCTE-IUL:
2019-11-21Deposited version:
Post-printPeer-review status of attached file:
Peer-reviewedCitation for published item:
Pereira, L. & Santos, J. (2018). Pereira problem solving. In M. Araújo (Ed.), ICOPEV International Conference on Project Economic Evaluation. (pp. 130-134). Guimarães: Universidade do Minho.
Further information on publisher's website:
https://coutin68.wixsite.com/icopev2018
Publisher's copyright statement:
This is the peer reviewed version of the following article: Pereira, L. & Santos, J. (2018). Pereira problem solving. In M. Araújo (Ed.), ICOPEV International Conference on Project Economic
Evaluation. (pp. 130-134). Guimarães: Universidade do Minho.. This article may be used for non-commercial purposes in accordance with the Publisher's Terms and Conditions for self-archiving.
Use policy
Creative Commons CC BY 4.0
The full-text may be used and/or reproduced, and given to third parties in any format or medium, without prior permission or charge, for personal research or study, educational, or not-for-profit purposes provided that:
• a full bibliographic reference is made to the original source • a link is made to the metadata record in the Repository • the full-text is not changed in any way
The full-text must not be sold in any format or medium without the formal permission of the copyright holders.
Serviços de Informação e Documentação, Instituto Universitário de Lisboa (ISCTE-IUL) Av. das Forças Armadas, Edifício II, 1649-026 Lisboa Portugal
Phone: +(351) 217 903 024 | e-mail: [email protected] https://repositorio.iscte-iul.pt
Pereira Problem Solving
Leandro Pereira
1and José Santos
2*1 Business Research Unit – BRU-IUL, ISCTE, Portugal 2 Winning LAB, Winning Scientific Management, Portugal
* Corresponding author: [email protected], Winning Scientific Management, Alameda das linhas de Torres nº152 escritório 14, 1750-149, Portugal
KEYWORDS
Problem Solving, Key Performance Indicators, Management
ABSTRACT
One of the current challenges in organizations is related to decision-making in adverse, uncertain and complex environments. Problem-solving approach is a process of analysis that has been supporting managers’ decision-making. There are several problem-solving tools like the Fishbone diagram, Root Cause Analysis and 5 Why’s that allow an investigation of the problem and its causes. However, due to its limitations, the solutions presented do not always lead to the best results for the organization. The proposed model "Pereira Problem Solving" ensures a better understanding of the problems and an identification of the best solutions. Through the control group technique (10 companies), the research aimed to compare results between the ad hoc process used by managers to seek problem solutions and the "Pereira Problem Solving" process. After implementing the solutions which resulted from each type of approach (ad hoc vs Pereira Problem Solving), the identified key performance indicator was measured to analyze the level of effectiveness of the proposed model.
INTRODUCTION
Nowadays the constant technological changes, the intensification of competition, the markets globalization and the search for the efficiency of internal processes are some of the key challenges organizations are facing (Basadur et al., 2013). This new economic and social reality has led organizations to turn problems into opportunities for improvement, creating value and developing sustainable competitive advantages. Given the market uncertainty, complex situations arise in the decision-making process (Tiwana and Keil, 2009). Sometimes, the complexity of the processes and the constant change make it difficult to identify the solutions that effectively solve organizational problems.
Therefore, it’s crucial to understand the contribution of a problem-solving approach for organizations. The management
is confronted with the increase of intensive complexity and unexpected problems and those uncertainties might lead to failure or destruction of organizations added value (Ellert et al., 2015). The problem-solving is a simple process aimed to identify a problem, define corrective actions by measuring their impact and interpret the solution result (Ross and Orr, 2009). Currently there are many problem-solving tools and are becoming increasingly important in organizations as support for decision making.
There are several areas in which problem solving tools can be implemented. For instance, according to Martz (Martz et al. 2016), the risk management is one of the concerns on business and information systems programs for project managers and security analysts. The problem solving skills enable to identify which adverse events would affect those areas and develop solutions/corrective measures for controlling objectives. In general, managers must be able to identify and understand the problems that arise along the value chain, by collecting the root cause of the problems, validate alternatives and finally decide which solution(s) to implement and monitor the obtained results (Nickerson and Zenger, 2004).
LITERATURE REVIEW
Fishbone Diagram
The Fishbone Diagram (also known as Ishikawa Diagram or Cause-Effect Diagram) comes from the quality control and improvement. Introduced by Kaoru Ishikawa, this method of analysis was developed to improve team performance by identifying the potential causes of manufacturing quality problems (Watson, 2004; Juran and Godfrey, 1999). This is considered as one of the basic tools of quality control (Ishikawa, 1990).
The purpose of this technique is to analyze all potential or real causes (inputs) that result from a single effect (output) providing a better intelligence of these factor and showing all relationships between them (Vekemans, 1991). According the author Ishikawa (Ishikawa, 1990), the causes must be sorted by their degree of importance or level of details by a graphic representation of relationships and hierarchies of events.
Therefore, the Fishbone Diagram is considered a fundamental problem-solving tool (Shan-Shan and Ling-Chu, 2011; Wong, 2011). It can also be used to determine the risk associated with the causes and sub-causes of the effect (Ciocoiu, 2008) and allows identification and minimization of weaknesses (Wakchaure et al., 2015).
The application of technique calls for the use of collective intelligence about the process through collaboration, brainstorming or investigation (Wong, 2011; Ciocoiu, 2008; Wakchaure et al., 2015). Furthermore, it allows the identification of areas where data should be collected for study. However, the simplicity of the Fishbone Diagram may compromise the analysis in situations of high complexity given the numerous relationships between the causes, sub-causes and effects as well as the difficulty of graphical representation of all of them (Gupta et al., 2014).
Root Cause Analysis
Root cause analysis is considered a problem-solving tool that essentially acts on the causes that lead to a given problem (Connelly, 2012). According to Bhattacharya (2014) as cited in Corby (2013), the root cause means a relevant break or a process failure that, when solved, prevents the occurrence of the problem.
In solving problems one must recognize and understand the variables that are causing the problem (Bhattacharya et al., 2014). If real causes are not identified, the symptoms will only be treated and the problem will continue to exist (Connelly, 2012). Therefore, it is fundamental to correctly identify and eliminate the causes that lead to the occurrence of the problem (Mahto and Anjani, 2008).
This methodology was developed to analyze military and industrial accidents (Dew, 1991), and is currently practiced at the level of management, information technology or medicine. In this approach, the definition of the event that triggered a given problem, based on the collection of information, allows identifying and mapping the causal relationships inherent in that action. Later, the analysis of the causes guarantees the generation of effective solutions in the suppression of the problem and finally its implementation and control.
Five Why’s
The 5-Whys Analysis appears in lean manufacturing by Taiichi Ohno, the father of Toyota Production System and is considered one of tools of problem-solving (Boyd, 2015; Ohno, 1988). Towards a certain problem, asking the question “Why” allows to distinguish the symptoms from the causes.
At least repeating this exercise five times will ensure the identification of root cause without non-conformances. However, the isolated use of this technique may limit the definition of root cause or process’ defects (George, 2007). The 5-Whys technique does not always allow root cause identification when the cause is unknown for whom is doing the problem solving. On the other hand, the five questions may be insufficient to find the root of the problem or the answer to one
of the questions may condition the outcome of the whole analysis. Finally, the method is not repeatable, that is two different people applying the 5 Whys to the same problem will come to different conclusions.
PEREIRA PROBLEM-SOLVING MODEL
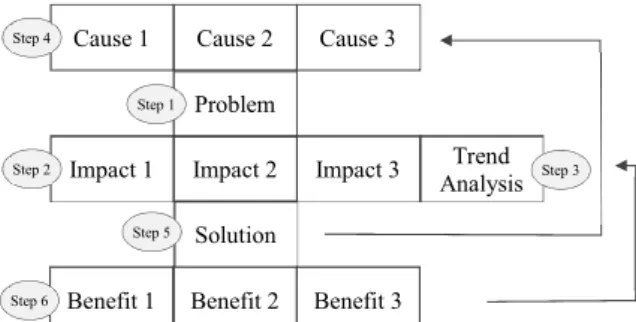
The proposed model consists on a qualitative analysis of a given problem, where it is firstly described followed by the identification of its main business/process impacts (e.g. in costs, efficiency, revenue, legal compliance) and their trend analysis over a certain period of time.
According to the Pareto principle (Browne and Keeley, 2004), 20% of the problem negative impacts identified (ideally up to 3 impacts) should account for 80% of the effects on the business activity or organizational structure.
The trend analysis is a very important aspect to be considered since it gives insights about the urgency or priority of that problem, need or opportunity. Having the current situation described, the model recommends an additional approach about the future situation, where the initiative/proposed solution is described as well as its benefits.
Figure 1: Pereira Problem-Solving
The next step consists on the cause’s collection which originated the problem. To make a root-cause analysis, it is important to be knowledgeable about the different set of techniques available in order to collect the real problem causes and which generate the most negative impacts in the business activity (both internally and externally).
After analyzing the current situation (AS IS), the conditions for developing the most appropriate solution are met. The proposed solution must therefore address the causes of the problem identified, in order that the solution impacts (benefits) will result in a reduction or even the full elimination of the problem negative impacts.
Similarly to the problem impacts, the benefits should also respect the Pareto principle (Craft and Leake, 2002). The estimated return on investment should consider 20% of the main benefits generated (ideally up to 3 benefits), since they represent 80% of the value generated. The remaining identified benefits should be classified as intangible for its residual contribution on solving the problem initially identified.
Problem
Impact 1 Impact 2 Impact 3 Cause 1 Cause 2 Cause 3
Solution
Benefit 1 Benefit 2 Benefit 3
Trend Analysis Step 1 Step 2 Step 4 Step 3 Step 5 Step 6
The initiative identified should be able to respond to the organization's need. The entire analytical component of this problem solving tool comes to ensure that the proposed solution will maximize the value generated for the organization.
RESEARCH METHODOLOGY
In order to validate Pereira Problem Solving effectiveness, several companies across different sectors were invited for this research. To accomplish this validation and to propose a solution it has been selected KPI (Key Performance Indicator) as measure for a better and improved performance level.
One team was divided in two parts. The first one should apply their usual ad hoc process to approach a problem definition and propose a solution which should impact an intended KPI. The second one was trained about the Pereira Problem Solving Model and was invited to apply it to the same given problem. Afterwards, each group applied the identified solution which resulted from the according model, in their offices, stores or teams facing the same problem. After a three months’ time, the identified KPI was analyzed and compared to evaluate the effectiveness level between the two approaches (ad-hoc compared to the proposed model Pereira Problem Solving). This exercise was applied to ten different companies from different departments.
In all cases, it was applied in the same team of a given store or office or in two identical stores of the same company which are under the same variable influence and with identical sales performance (control group technique).
DATA RESULTS
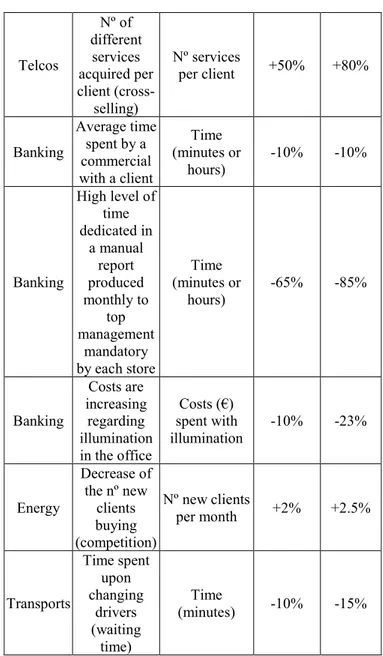
The following table presents the several organizations which have joined this research study, the according problems and the impacted KPIs observed considering each solution applied that resulted from each approach (ad hoc versus Pereira Problem Solving).
Table 1: KPI Results
Sector Problem KPI
KPI delta – Ad-hoc approach KPI delta – Pereira Problem Solving Retail Complaints increase in the store Nº of complaints per month -1% -5% Retail Lead time in replacing stocks in the shelves Time (minutes or hours) -20% -50% Retail Decrease of the nº new clients buying Nº new clients per month +3% +5% Telcos Decrease of the Retention rate of costumers Average period of time within the company +3% +3% Telcos Nº of different services acquired per client (cross-selling) Nº services per client +50% +80% Banking Average time spent by a commercial with a client Time (minutes or hours) -10% -10% Banking High level of time dedicated in a manual report produced monthly to top management mandatory by each store Time (minutes or hours) -65% -85% Banking Costs are increasing regarding illumination in the office Costs (€) spent with illumination -10% -23% Energy Decrease of the nº new clients buying (competition) Nº new clients per month +2% +2.5% Transports Time spent upon changing drivers (waiting time) Time (minutes) -10% -15%
It is possible to conclude that only 2 out of 10 situations the KPI behaved very similarly (same impact) representing 20% of the cases under research. On the remaining cases the PPS have showed higher values corresponding to better solutions. Although the sample is limited to 10 analysis, the sector retail and banking represent 60% of the test cases. In both sectors the KPI delta average was 12% and 11% respectively higher on PPS meaning a better approach by using this problem solving method.
DISCUSSION
Having the KPI collection done, it is possible to compare results and evaluate how effective is the proposed model (Pereira Problem Solving) and how it may leverage better results by clearly understanding the causes and impacts of a given problem and consequently propose the most effective solution(s). Regarding the first case, the Pereira Problem Solving (PPS) allowed to better understand the main causes of complains and the impacts in business, and allowed to identify a more effective
solution then the one suggested by the ad-hoc process (which reflected a +4% delta the ad-hoc approach).
The second one consisted on improving the lead times when replacing stocks, by collecting the current steps and times and the impacts internally. The solution proposed following the PPS approach allowed a better result (in 30%) then the usual approach.
The third and ninth situation aimed to work on a solution which would work on avoiding the decrease on the number of clients joining the company. So, PPS recommended understanding the causes (i.e through a questionnaire to clients) and understanding this impacts in business and therefore, helped on identifying a solution (+2% and 2,5% delta then the ad-hoc approach accordingly to each case).
Similarly, the fourth one, also aimed to decrease the clients dropout rate, however in this case, the delta generated by the proposed solution, generated the same impact (3%) than the ad-hoc approach.
The fifth case, aimed to improve the number of different services or products acquired by current clients (meaning cross-selling). So, PPS recommends analyzing why there are difficulties to reach that (i.e through questionnaires, interviews to current costumers) so that a more effective solution fitting the causes are mitigated (+20% then ad-hoc solution).
Regarding the sixth case, PPS model suggests understanding the current process and time spent by the sales team per client in order to propose a solution. In this case, the delta generated by the proposed solution produced the same impact.
The seventh one consisted on improving the time spend in a manual report and PPS assisted on getting the causes and impacts in teams productivity and consequently on identifying a solution that better suits the problem origin (+20% effective then ad hoc).
The eight one consisted on collecting the costs with the lighting in the office and find the best solutions to reduce costs, where results from PPS were better in 13% then the ad-hoc process. The last situation is similar to the sixth one, where PPS suggested collecting the time spent by the drivers upon switching shifts and understand the main current causes of delays. PPS could help proposing a solution 5% more effective.
CONCLUSIONS AND FURTHER RESEARCH
This research allowed to conclude that the proposed model “Pereira Problem Solving” may assist several organizations about better understanding the problems or challenges they face daily (from revenue decreases to lack of efficiency) to be better prepared to identify the most effective solutions and consequently create value.
This was a preliminary research which allowed to verify the contribution of the proposed model by using a convenience sample, however in future research the authors recommend increasing the sample of analysis and filter results (KPIs delta) by comparing different business sectors (energy, telecommunications, banking, retail and others).
REFERENCES
Basadur, M.; G. Gelade; and T. Basadur. 2013. Creative
problem-solving process styles, cognitive work demands, and
organizational adaptability. The Journal of Applied Behavioral
Sciente, vol. 50, 80-115.
Tiwana A. and M. Keil. 2009. “Control in Internal and Out- sourced Software Projects,” Journal of Management Information Systems (26:3), 9-44.
Ellert, G.; G. Schafmeister; D. Wawrzinek; and H. Gassner. 2015.
Expect the unexpected. International Journal of Event and Festival
Management, 6(1), 54-72.
Ross, C. and Orr, R. 2009. “Teaching structured troubleshooting: integrating a standard methodology into an information technology program”. Education Technical Research Development, 57(1); 251-265.
Martz, B.; J. Hughes; and F. Braun. 2016. Creativity and
problem-solving: Closing the skills gap. The Journal of Computer
Information Systems, 57(1), 39-48.
Nickerson, A. and T. Zenger 2004. "A knowledge-based theory of the firm—The problem-solving perspective." Organization science: 617-632.
Watson G. 2004. “The Legacy Of Ishikawa”. Quality Progress 37(4), 54-47.
Juran J. and A. Godfrey. 1999. "Quality handbook". Republished McGraw-Hill.
Ishikawa K. 1990. “Introduction to quality control”. Tokyo, Japan: 3A Corporation
Vekemans J. 1991. "A Quality Approach for the Management of the Pipeline". The International Journal of Logistics Management, Vol. 2, 42 – 47.
Shan-Shan L. and L. Ling-Chu. 2011. “Using fishbone analysis to improve the quality of proposals for science and technology programs”. Res Eval; 20 (4): 275-282.
Wong C. 2011. “Using an Ishikawa diagram as a tool to assist memory and retrieval of relevant medical cases from the medical literature”. Journal of Medical Case Reports, 5, 120.
Ciocoiu N. 2008. “Managementul riscului. Teorii, practice”. metodologii. Bucharest: ASE.
Wakchaure, V.; S. Pandhare; H. Kachave; and R. Chaudhari. 2015. A
review on: Fishsbone diagram. World Journal of Pharmaceutical
Research, Vol 4, Issue 4, 2015.
Gupta K. C. Sleezer; and D. Russ-Eft. 2014. John Wiley & Sons. San Francisco, C.A
Connelly M. 2012. “Root cause analysis”. Med. Surg. Nurs. 21 (5), 316, 313.
Corby D. 2013. “Improving services through co-operative learning”. Learn. Disabil. Pract.
Bhattacharya, J.; M. Pharm; M. Phil. 2014. Root Cause Analysis – A
Practice to Understanding and Control the Failure Management in Manufacturing Industry. International Journal of Business and
Management Invention. Volume 3 Issue 10, 12-20.
Mahto, D. and K. Anjani. 2008. “Application of root cause analysis in improvement of product quality and productivity”. Journal of Industrial Engineering and Management, v. 1, n. 2, 16-53 Dew J. 1991. “In search of the root cause”. Quality Progress, 24 (3):
97-107.
Boyd M. 2015. “A method for prioritizing interventions following root cause analysis (RCA): lessons from philosophy”. J Eval Clin Pract. 21: 461-469.
Ohno T. 1988. “Toyota Production System: Beyond Large-Scale Production”. Productivity Press, Cambridge, MA.
George A. 2007. “Lean kaizen in the 21st Century”, Quality Progress, Vol. 40 No. 8, 69-70.
Browne N. and Keeley, M. 2004. “Asking the Right Questions”. Prentice-Hall, Englewood Cliffs, NJ.
Craft C. and C. Leake. 2002. “The Pareto principle in organizational decision making”. Management Decision Vol.40, Issue: 7/8, 729-733.