Universidade de Lisboa
Faculdade de Ciências
Departamento de Biologia Vegetal
Deciphering the role of inflammation in the
organotypic hippocampal slice model of
epileptogenesis
Daniela Cristina Melo Magalhães
Dissertação
Mestrado Biologia Molecular e Genética
Universidade de Lisboa
Faculdade de Ciências
Departamento de Biologia Vegetal
Deciphering the role of inflammation in the
organotypic hippocampal slice model of
epileptogenesis
Daniela Cristina Melo Magalhães
Dissertação
Mestrado Biologia Molecular e Genética
Orientadores
Prof. Doutor Rui Gomes, Faculdade de Ciências da Universidade de Lisboa
Doutora Cláudia Valente de Castro, Instituto de Medicina Molecular, Lisboa
Acknowledgements
Gostaria de agradecer à Doutora Cláudia Valente pelo seu enorme apoio e acessibilidade ao longo de todo o trabalho e por todos os ensinamentos transmitidos, que me foram muito valiosos para sua concretização. Por fim gostaria também de agradecer a sua amizade e paciência durante este último ano e meio.
Ao professor Alexandre Ribeiro e à professora Ana Sebastião por terem concedido a oportunidade de realizar o meu estágio de mestrado na área das Neurociências e por todos os conselhos dados.
Ao Professor Rui Gomes pela disponibilidade cedida sempre no esclarecimento de todos os assuntos legislativos e pela ajuda no laboratório.
Gostaria também de agradecer à Noémia Pereira que sempre me ajudou desde o primeiro dia de estágio e à Rita Aroeira pela disponibilidade constante e pelos seus preciosos conselhos. A elas agradeço todo o seu apoio.
À Cláudia Cavacas pela sua ajuda nos últimos meses e por cuidar das minhas culturas sempre que era preciso e claro, pela sua amizade, apoio e muita paciência tanto nos melhores momentos como nos menos bons.
A todos os restantes colegas de laboratório que me ajudaram e motivaram durante a realização da tese.
Ao Carlos Posse e à Vera Salgado pela motivação e pela disponibilidade de ouvirem os meus desabafos.
Por fim, deixo um agradecimento especial aos meus pais por me proporcionarem a oportunidade de realizar o estágio e por todos os conselhos e apoio incondicional.
Resumo
A epilepsia é uma das mais prevalentes desordens neurológicas em todo o mundo, afetando 0.4-1% da população mundial. De acordo com dados da Organização Mundial de Saúde a epilepsia é responsável por 1% dos encargos com doenças. O termo epilepsia inclui várias desordens neurológicas genéticas e adquiridas que têm em comum a ocorrência periódica e imprevisível de convulsões, isto é, de episódios de atividade neuronal excessiva. Embora estejam disponíveis vários fármacos antiepilépticos, estes não são eficazes em 30% dos pacientes que continuam a sofrer progressão da doença. Torna-se então imperativo encontrar novas terapias que previnam o início e/ou progressão desta desordem.
Tradicionalmente a epilepsia tem sido considerada unicamente como uma doença neuronal. No entanto, na última década, vários estudos realizados em modelos animais de epilepsia e em tecido cerebral humano de pacientes com esta desordem demonstraram a influência e a contribuição de processos inflamatórios nos mecanismos de geração e recorrência dos ataques epiléticos. A neuroinflamação pode ser vista como uma resposta imune que têm como objetivo enfrentar uma ameaça que esteja a ocorrer no cérebro. No entanto, a inflamação pode ser tanto prejudicial como benéfica na resolução da lesão. Vários estudos demonstraram que um processo inflamatório ocorre em todos os tipos de epilepsia, mesmo nos tipos sem características da fisiopatologia inflamatória, tal como epilepsia do lobo temporal (TLE). TLE é um dos principais e mais perigosos tipos de epilepsia que afeta a zona do hipocampo. Estudos recentes mostraram que o estado de inflamação crónica nesta doença está de facto associado à morte neuronal, à ativação de células da glia e à expressão de fatores inflamatórios. As células da glia, nomeadamente astrócitos e microglia, têm um papel relevante na inflamação através da sobrexpressão e libertação de mediadores inflamatórios, tais como as citocinas. Estas proteínas possuem efeitos tanto na disfunção sináptica como na excitoxicidade e na morte neuronal que podem contribuir para a alteração da excitabilidade neuronal, levando à epileptogénese. As principais citocinas pro-inflamatórias envolvidas na geração e propagação das convulsões são o factor de necrose tumoral (TNF-α), a interleucina-1β (IL-1β) e a interleucina-6 (IL-6).
Este estudo pretende avaliar a evolução dos eventos inflamatórios num modelo in vitro de epileptogénese. O estudo foca-se na morte celular, no estado de activação e morfologia dos astrócitos e da microglia, assim como na expressão das principais citocinas pro-inflamatórias envolvidas na epilepsia.
Para realizar estes objetivos foram usadas culturas organotípicas de hipocampo, uma vez que, recentemente foi descrita a ocorrência de atividade epilética espontânea nestas culturas. Estas culturas são extremamente atrativas uma vez que as células se desenvolvem de forma semelhante às células in vivo, e podem ser mantidas por longos períodos de tempo permitindo uma manipulação e avaliação a longo prazo. O processo de corte do hipocampo para obtenção das fatias organotípicas representa um trauma bastante severo com o consequente desenvolvimento de conectividade anormal, que também se encontra descrito em tecido humano de pacientes com epilepsia. Por estes motivos, as culturas organotípicas de hipocampo são consideradas um modelo simples e útil no estudo da epileptogénese. As culturas foram preparadas a partir de ratos Sprague-Dawley com 6-7 dias de vida (P6-7). Todos os ensaios foram realizados em amostras obtidas a 7, 14 e 21 dias in vitro (DIV), de modo a estudar a morte celular e os marcadores de inflamação ao longo do tempo.
A morte celular foi avaliada através da captação de iodeto de propídio (PI) e dos produtos de clivagem da α-II Espectrina (SBDP). O PI é um marcador fluorescente com a capacidade de se ligar aos ácidos nucléicos. Deste modo, ao entrar nas células cujas membranas estão danificadas (ou seja, em processo de morte celular) permite observá-las num microscópio de fluorescência. Os SBDP dão indicação sobre o tipo de morte celular que está a ocorrer nas células, uma vez que α-II Espectrina pode ser clivada por protéases envolvidas na morte celular, nomeadamente a calpaína (ativada tanto na necrose como na apoptose) e a caspase-3 (principal caspase ativada na apoptose), dando origem a produtos distintos. A ativação dos astrócitos e da microglia foi analisada por western blot através da expressão de marcadores específicos. Para os astrócitos utilizou-se como marcador a proteína acídica fibrilar glial (GFAP) e para a microglia a molécula de ligação ao cálcio ionizado 1 (Iba1). O ensaio de imunofluorescência, realizado com os marcadores referidos, foi efetuado para avaliar as alterações morfológicas destas células da glia, uma vez que a sua forma é indicadora do seu estado de ativação. Adicionalmente, a expressão de mRNA das citocinas, assim como dos seus receptores, foi quantificada por PCR quantitativo.
O ensaio de morte celular por PI mostrou que a região CA1 do hipocampo é a zona mais sensível, o que está de acordo com a literatura. A zona CA1 sofre uma reorganização de conexões neuronais e apresenta uma maior concentração de recetores de glutamato, cuja activação pode conduzir à morte das células. Relativamente à progressão da morte celular, tanto os resultados do PI como os SBDP demonstraram um pico de morte celular a 14 DIV. Este resultado coincide com o início de atividade epiléptica espontânea observada neste modelo e
considera-se ser uma consequência destes eventos. Neste trabalho apenas o SBDP resultante da clivagem da α-II Espectrina pela calpaína foi obtido. Não se obtive o SBDP resultante da clivagem da α-II Espectrina pela caspase-3, nem a forma ativa desta mesma caspase. Concluiu-se assim que a morte celular neste modelo ocorre por necroConcluiu-se ou pela via de apoptoConcluiu-se não dependente das caspases, uma vez que a calpaína atua em ambos os tipos de morte celular.
A expressão do GFAP teve um ligeiro aumento ao longo do tempo, mas sem significado estatístico. No entanto, nas imagens de imunofluorescência pode observar-se a formação progressiva de uma cicatriz glial. Esta cicatriz é caracterizada pela presença de astrócitos com processos longos e entrelaçados a cobrir os neurónios, e tem como função restringir espacialmente a inflamação e o tecido danificado. De facto, a ocorrência de cicatriz glial generalizada, isto é, observável em todas as zonas do hipocampo, coincidiu com o pico de morte celular reportado neste estudo. O western blot indicou uma redução de cerca de 40% na expressão do marcador da microglia (Iba-1), tanto a 14 DIV como a 21 DIV, comparativamente a 7 DIV. O ensaio de imunofluorescência mostrou a ocorrência da morfologia “amoeboid”, característica de microglia activada e com maior expressão de Iba1 apenas a 7 DIV, tendo posteriormente ocorrido uma reversão para a morfologia ramificada, típica de microglia não ativa.
A avaliação da expressão dos transcritos das citocinas indicou um aumento progressivo ao longo do tempo, relativamente à IL-1β e TNF-α. A IL-6 aumentou significativamente apenas a 21 DIV. A expressão da maioria dos respectivos recetores das citocinas estudadas também mostrou um aumento significativo a 21 DIV. Apenas o recetor TNFR2 do TNF-α teve um aumento estatístico significativo, o que poderá indicar um aumento de sinalização anti-apóptotica a 21 DIV, explicando a diminuição de morte celular obtida nesse tempo.
Neste modelo de epileptogénese, obteve-se uma progressão de eventos inflamatórios com aumento de gliose e de citocinas inflamatórias, coincidente com o desenvolvimento da atividade epilética espontânea. Observou-se a ocorrência de astrogliose progressiva, enquanto a microglia reverteu para um estado inativado ao longo do tempo. Neste trabalho, a ativação da microglia parece estar relacionada com a lesão infligida pelo método de preparação das fatias de hipocampo, uma vez que a microglia atua muito rapidamente em situações de lesão (e também de infeção e/ou inflamação), sendo um dos seus principais papéis eliminar os restos celulares resultantes da morte das células. A ativação da microglia é também responsável por promover a ativação dos astrócitos, que representam neste modelo a fonte principal de produção dos
mediadores inflamatórios, sendo assim responsáveis por perpetuar o estado de inflamação na epileptogénese.
Este trabalho mostrou que o modelo de epileptogénese usado é bastante útil para explorar as funções das células da glia e da inflamação na epileptogénese e na progressão da epilepsia.
Palavras-chave:
Abstract
Epilepsy is one of the most common neurological disorders. The influence of inflammatory processes on epilepsy has increased in the last decade and recent studies show the contribution of astrocytes and microglia for the mechanisms of seizure onset and recurrence, through the overproduction and release of pro-inflammatory cytokines.
The aim of this study was to explore the progression of inflammatory markers within the organotypic hippocampal slice model of epileptogenesis.
An evaluation of cell death was performed through Propidium Iodide uptake assay and alphaII-Spectrin cleavage. Astrogliosis and microglia activation were also assessed by western blot and by immunofluorescence assays, which used specific markers for astrocytes and microglia, glial fibrillary acidic protein (GFAP) and ionized calcium-binding molecule 1 (Iba1), respectively. Additionally, the transcript expression of the principal pro-inflammatory cytokines, involved in seizure generation and propagation (IL-1β, TNF-α and IL-6) and their receptors, was achieved through qPCR. All assays were carried out in slices with 7, 14 and 21 days in vitro (DIV).
The majority of cell death was obtained in 14 DIV slices, which coincided with the onset of seizure-like activity in this model. Concerning glia activation, an upregulation of GFAP, with glial scar formation, was observed throughout culture time, while microglia changed from an activated amoeboid form to a resting ramified state. Transcript analysis of all pro-inflammatory cytokines revealed an increased expression over time in culture. However, statistical significance was solely achieved in 21 DIV slices. IL-1R1, TNFR2, and IL-6R expression were also upregulated in 21 DIV slices, while TNFR1 levels remained unchanged through time in culture.
The results indicate an activity dependent inflammatory process, since at 21 DIV, when slices depict mixed interictal and ictal-like events, an upregulation of inflammatory mediators was observed in the organotypic model of epileptogenesis. More specifically, gliosis and increased expression of inflammatory mediators was achieved.
Key words
:
List of abbreviations
Aβ Amyloid beta
Ab Antibody
AEDs Anti-epileptic drugs
AIF Apoptosis inducing factor
AMPA α-amino-3-hydroxy-5-methyl-4-isoxazolepropionic acid
BBB Blood-brain-barrier
BSA Bovine serum albumin
CA Cornus ammonis
cDNA Complementary DNA
CNS Central nervous system
CP Crossing point
Ct Cycle threshold
DD Death Domain
DG Dentate gyrus
DIV Days in vitro
DNA Deoxyribonucleic acid
dNTPs Deoxyribonucleotides thrisphosphate
dsDNA Double-stranded DNA
DTT Dithiothreitol
EDTA Ethykenediamine tetraacetic
FADD Fas-associated death domain protein
GABA γ-Aminobutyric acid
GAPDH Glyceraldehyde 3-phosphate dehydrogenase
GBSS Gey’s balanced salt solution
GFAP Glial fibrillary acidic protein
gp130 Glycoprotein 130
HRP Horseradish Peroxidase
Iba1 Ionized calcium-binding molecule 1
ICE IL-1β converting enzyme
IF Immunofluorescense
IL-1β Interleukin-1β
IL-1RI IL-1 receptor type I
IL-1RII IL-1 receptor type II
IL-1RAcP IL-1 receptor-accessory protein
IL-6 Interleukin-6
IL-6R IL-6 receptor
JNK Jun N-terminal kinases
mAbs Monoclonal antibodies
MAPKs Mitogen-activated protein kinases
MgCl2 Magnesium chloride
mTNF Membrane TNF
MyD88 Myeloid differentiation factor 88
NF-κB Nuclear factor-κB
NMDA N-methyl-D-aspartate
NP40 Nonyl phenoxlpoylethano 40
OHSC Organotypic hippocampal slice culture
PBS Phosphate-buffer solution
PCR Polymerase chain reaction
PFA Paraformaldehyde
PI Propidium iodide
PMSF Phenylmethysulfonyl fluoride
PNS Peripheral nervous system
PVDF Polyvinylidene difluoride
qPCR Quantitative real-time polymerase chain reaction RIPA Ristocetin induced platelet agglutination
RNA Ribonucleic acid
SBDP Spectrin break down products
SDS Sodium dodecyl sulfate
PAGE Polyacrylamide gel electrophoresis
SEM Standard error of the mean
sTNF Soluble TNF
TACE TNF-α converting enzyme
TAE Tris-acetate-Ethykenediamine tetraacetic
TBS-T Tris base solution with Tween
TLE Temporal Lobe Epilepsy
TIM TRAF interacting motifs
TNF-α Tumor necrosis factor-alpha
TNFR1 TNF receptor type 1
TNFR2 TNF receptor type 2
TRADD TNF receptor associated death domain
Index
1 Background ... 1
1.1 Nervous System ... 1
1.2 Epilepsy ... 1
1.3 Temporal Lobe Epilepsy ... 2
1.4 Neuroinflammation ... 3 1.5 Glial cells ... 4 1.6 Cytokines ... 5 1.7 IL-1β ... 6 1.8 TNF-α ... 7 1.9 IL-6 ... 8 1.10 Cell death ... 8
1.11 Experimental Models of epilepsy... 9
1.12 OHSC as a model of epileptogenesis ... 10
2 Aims ... 11
3 Materials and Methods ... 12
3.1 Animals ... 12
3.2 Organotypic Hippocampal Slice Culture ... 12
3.3 Propidium iodide (PI) uptake assay ... 13
3.4 Western blot ... 13
3.4.1 Tissue lysates ... 13
3.4.2 Western blot assay ... 14
3.5 qPCR ... 14
3.5.1 RNA isolation and quantification ... 14
3.5.2 Reverse Transcription reaction ... 15
3.5.3 Relative quantification ... 15 3.6 Gel electrophoresis ... 16 3.7 Immunohistochemistry (IHC) ... 16 3.7.1 Immunohistochemistry ... 16 4 Results... 17 4.1 Cell death ... 17 4.1.1 PI uptake ... 17 4.1.2 αII-Spectrin cleavage ... 17
4.2 Astrogliosis and microglia activation ... 20
4.2.1 Analysis by western blot ... 20
4.3 Analysis by immunofluorescence ... 21
4.3.1 Astrocyte activation... 21
4.3.2 Microglia activation ... 22
4.4 Inflammatory mediators ... 24
8 Appendix ... i
8.1 Preparation of OHSC ... i
8.2 OHSC maintenance ... i
8.3 Primary antibodies ... ii
8.4 Primers ... ii
8.5 Immunofluorescence Assays ... iii
8.6 Theoretical description of the experimental techniques ... iv
8.6.1 Western Blot ... iv
8.6.2 qPCR ... vi
8.6.3 Gel electrophoresis ... viii
8.6.4 Immunohistochemistry ... viii
8.6.4.1 Immunofluorescence microscopy ... xv
8.7 Theoretical description of the experimental techniques ... xx
8.7.1 Standard and melting curve analysis ... xx
8.8 Agarose gels analysis ... xv
Escrever título do capítulo (nível 1) ... 4
ESCREVER TÍTULO DO CAPÍTULO (NÍVEL 2) ... 5
Escrever título do capítulo (nível 3) ... 6
4.4.1.1 IL-1β ... 24
4.4.1.2 TNF ... 25
4.4.1.3 IL-6 ... 26
5 Discussion ... 26
5.1 OHSC as a Model of Epileptogenesis ... 26
5.2 Cell death ... 27
5.3 Astrogliosis and microglia activation ... 28
5.4 Inflammatory mediators ... 29
6 Conclusion and Future perspectives ... 31
1
1 B
ACKGROUND1.1 Nervous System
The nervous system consists of two main parts: the central nervous system (CNS) that contains the brain and spinal cord and the peripheral nervous system (PNS) that includes the somatic and autonomic system 1. The cellular unit of the nervous system is the neuron. However, the brain tissue is also composed by other very important cells, the glia. The neuron is an electrically excitable cell that processes and transmits information by electrical and chemical signals. Neurons are able to communicate with each other through the generation and propagation of nervous impulses and through the release of signalling molecules (the neurotransmitters), which are used to amplify and modulate signals between two neurons and also between neurons and other cells 2.
1.2 Epilepsy
Epilepsy is the third most common chronic brain disorder affecting 0,4-1% of the world’s population 3,4. The International League Against Epilepsy defines epilepsy as an enduring propensity of recurrent epileptic seizures 5. These are characterized as symptomatic, hypersynchronous and paroxysmal depolarisations and high-frequency firing of populations of neurons in the CNS 6. Epileptogenesis are the mechanisms by which a normal brain becomes epileptic. These mechanisms lead to an imbalance between excitation and inhibition, which results in hyperexcitable neuronal population 6. However, the underlying mechanisms of epileptogenesis are not fully understood. Epileptogenesis includes several hallmarks, such as neuronal death, gliosis, inflammation and re-wiring, among others 7.
Although there are an increasing number of treatment options, there is still no cure for epilepsy. Anti-epileptic drugs (AEDs) are the principal treatment and its basic mechanism is to restore the balance between inhibitory and excitatory transmission, leading to the suppression of seizure generation 8. Thus, it is relevant to highlight that most of the actual treatments are directed to neurons. However, the current antiepileptic drugs have two major drawbacks. First, recent studies have shown that only 70% of the patients can be successfully treated. Therefore, 30% of the cases have refractory epilepsy 9. Secondly, the AEDs have risks of cognitive complications 10. Furthermore, the current available AEDs are mainly symptomatic, since they
2 only block seizures. AEDs do not affect the underlying pathology or progression of this disorder and it is therefore imperious to discover new therapies in order to prevent its onset and/or progression 11.
Traditionally, epilepsy has been considered only a neuronal disease. However, a new direction was taken to fully understand the mechanisms of this neurological disorder 12. In the last decade, researchers have been dedicated to the excitatory and inflammatory effects of glia cells in this pathology. The direct neuromodulatory actions of inflammatory mediators, such as cytokines have been particularly explored 13.
1.3 Temporal Lobe Epilepsy
The hippocampus, compared to other structures, is an exquisitely seizure-prone structure 14, since the principal cells, within this structure, display propensities for epileptiform activity and seizures. However, it is not yet clear, whether the epilepsy is caused by hippocampal abnormalities or whether the damaged in hippocampus is due to cumulative effects of seizures 15. In terms of anatomy, the hippocampus belongs to the limbic system and is located under the temporal lobes of the cerebral cortex.
Temporal Lobe Epilepsy (TLE) is one of the most dangerous and frequent types of intractable epilepsy 16,17 and it has the most common structural abnormality in human epilepsy, defined as hippocampal sclerosis (HS) 17,18. HS consists of hippocampal atrophy involving an extensive and selective neuronal loss and gliosis, mostly in cornus ammonis (CA) 1 and dentate gyrus (DG) regions 19. Reactive gliosis is characterized by hypertrophy of glial cells 10. Another alteration in HS includes an aberrant mossy fiber sprouting, in which the mossy fiber axons of DG cells form synapses with themselves and with other granule cells (synaptic reorganization) 20–22, thus creating a monosynaptic excitatory feedback 16,23,24. Actually, this feature has been noted in both animal models of epilepsy 25 and in human brain tissue from TLE patients 26.
Although TLE is an epileptic disorder that does not feature a typical inflammatory pathophysiology, there are several evidences supporting the occurrence of an inflammatory state sustained by microglia, astrocytes and neurons and also by the presence of pro-inflammatory mediators 27.
3
1.4 Neuroinflammation
Inflammation is defined as a homeostatic phenomenon, consisting in the quick production of pro-inflammatory or anti-inflammatory mediators by both innate and adaptive immunity cell types 28.
The CNS has historically been considered an immune-privileged site 29, since immune responses were thought to be constrained by the blood-brain-barrier (BBB) 27,30. This anatomical structure assures the separation between the nervous tissue and the peripheral environment 31, protecting the brain and maintaining its homeostasis 32. Nowadays, the existence of immune and inflammatory reactions in the CNS and their role in the development and progression of multiple neurodegenerative disorders has become clear 33. Moreover, the CNS is constituted by its own innate immune cells, the microglia cells, which constitute a major player of innate immune mechanisms 34,35.
In most cases, neuroinflammation constitutes a beneficial process, being defined as a defense mechanism aimed to protect the CNS against insults such as infection, injury or trauma 36. This process is a result of resident parenchymal cells activation, such as microglia, astrocytes, and neurons, as well as via infiltration of immune cells from the periphery 37. The beneficial effects include the clearance of cellular debris and secretion of neurotrophic factors and cytokines 37. Whenever inflammatory process and immunosuppressive (e.g, tissue regeneration) pathways gets out of balance, a chronic neuroinflammation may arise. In this situation, inflammation becomes detrimental for brain tissue and results in cell dysfunction or death, contributing to the pathogenesis of several neurological conditions36,38,39.
Over the last decade, as a result of supportive evidence in experimental models and in the clinical studies, the role of inflammation in the pathophysiology of seizures and epilepsy has received an increasing attention40. One major hallmark of neuroinflammation is the activation of glial cells, named reactive gliosis 41, which is also a characteristic frequently encountered in TLE patients and in epilepsy animal models 13,42,43. Both clinical and experimental evidences suggest a direct and reciprocal relationship between glia-mediated inflammatory processes and neuronal excitability and epileptogenesis 27,44-45. Thus, inflammation can be the consequence of recurrent seizures, as well as the cause of the underlying pathology 39. Experimental studies demonstrated that several insults can induce a cascade of chronic inflammatory processes in the CNS, which contribute to the development of epilepsy 46,47. This event is often associated with
4 neuronal cell death. In turn, the recurrence of spontaneous seizures can maintain the inflammation 48. Inflammation can be induced by seizures and can persist for days, even after the termination of seizures 49-51. However, the mechanisms that lead to seizure-evoked inflammation are still unknown 52. Although cell loss does not induce inflammation in this context, dying cells may contribute to the perpetuation of the inflammatory process47,53. Noteworthy, most of neurodegenerative diseases are also characterized by the production of inflammatory mediators, such as cytokines 54-56.
1.5 Glial cells
Glia cells are involved in diverse neuronal functions, being the main role the support to the neurons during brain development and function 57. In CNS, glial cells can be divided into four major categories: microglia, astrocytes, radial glial cells, and oligodendrocytes 58. This study will focus in microglia and astrocytes, since these are the glial cells activated in pathological conditions.
Nowadays, astrocytes have been considered to be functionally associated with the pre- and postsynaptic nerve terminals, as the third element of a structure known as “tripartite synapse” 59,60. In the healthy brain, astroglia play a pivotal role in synapse regulation through metabolic processes, established in cooperation with neurons, such as energy supply and also synthesis and removal of neurotransmitters61-65. The production of inflammatory mediators (e.g., cytokines) by astrocytes is also involved in the regulation of synaptic activity 64. Several other functions have been attributed to astrocytes, such as ion homeostasis and tissue repair 66,67.
Microglia are the innate immune cell of the CNS, located within the brain parenchyma, in structures like hippocampus 64,68. These glial cells provide a defense in CNS against several pathological insults and have multiple morphological and functional profiles influenced by their surrounding environment 69-71. Normally, microglia cells are in a surveying (resting) state, monitoring their environment with a ramified morphology, resembling the dendritic cells from the innate immune system 72. In this state, microglia are able to sense neuronal and astrocytic activity and other physiological changes such as pH shifts, ion currents and neurotransmitter release37-73. Whenever activated, in response to injuries or to immunological stimuli, microglia change rapidly to a prime state (characterized by shortened processes and a rounder cell body) and subsequently to an amoeboid activated state 74. This morphology enables microglia to migrate, through the parenchyma toward the lesion sites, and to release inflammatory
5 mediators, such as cytokines 75. Only in the active state, microglia display endocytic and phagocytic activity and serve as antigen-presenting cells 30,37. Phagocytic activity plays a beneficial effect, as the regulation of homeostasis, through the clearance of cellular debris and/or toxic substances 76. Moreover, due to their proliferation ability, microglial cells can also increase in number in response to a stimuli 77. These immune cells have a dual activity, since they can either promote neuronal survival and regeneration or contribute to neurodegeneration.
Astrocytes, together with microglia, are responsible for the inflammatory and immune responses in the brain. Being astrocytes the major glial cell type of the CNS, researchers point to a great role played by these cells in neuroinflammatory processes 29. It has been demonstrated that astrocytic cells initiate and amplify inflammatory-mediated mechanisms involved in several human CNS diseases, including epilepsy 78,79. Studies, both in vitro and in vivo, argument that astrocytes are a major source and target of epileptogenic inflammatory signaling 80. Likewise, in response to an insult or stress, astrocytes become reactive (activated), leading to the release of inflammatory mediators and growth factors that help regulate and resolve the inflammatory tissue response 63,75. However, in these situations, astrocytes do not respond as fast as microglia 81. Astrocytes proliferate and extend their processes around the injury site, which ultimately results in a scar formation 67,82,83.
Since glia cells are implicated in the modulation of synaptic transmission, it is plausible to point that alterations in these cells may have a functional role in the hyperexcitability 84. In fact, alterations in the neurotransmitters cycle and induction of inflammatory molecules in epilepsy have been associated with glial cells’ activation (cytokines’ effects in epilepsy in section 1.6) 27,85,86 . Consistent with this, manipulations of glial inflammatory processes are being considered as potential therapeutic targets for epilepsy.
1.6 Cytokines
Cytokines are considered as one of the primary classes of inflammatory regulators of innate and adaptive immune responses throughout the body, including the CNS 87. Being signaling molecules, cytokines act through specific receptors and signal transduction pathways to exert a particular biological response in the target cell 69. Although all cell types in the brain are capable to express cytokines and their respective receptors, its basal level of expression is quite low 27. However, followed CNS insults, cytokines are quickly overexpressed 27. Cytokines’ actions can be neuroprotective or neurotoxic in neurological diseases. For example, the transcriptional
6 pathway induced by cytokines can modulate cell death and survival and also synaptic reorganization and plasticity 88.
In epilepsy, the overproduction of cytokines appears to be implicated in synaptic dysfunction, as well as in excitotoxicity and apoptotic neuronal death47,89,90. Excitotoxicity is a process of neuronal death triggered by excessive or prolonged activation of excitatory neurotransmitter receptors 91. This suggests that the release of cytokines by glia cells during seizures may contribute to seizure-mediated neuronal damage52. Regarding synaptic dysfunction, these inflammatory mediators have effects in the seizure threshold and in epileptic activity, which are important evidences that neuroinflammation has a vital role in the development of epilepsy52. The cytokine effects’ on neuronal survival and excitability seems to be mediated by interactions between these proteins and neurotransmitters 52.
Several studies point to interleukin-1β (IL-1β), tumor necrosis factor-alpha (TNF-α) and interleukin-6 (IL-6) as the principal pro-inflammatory cytokines involved in seizure generation and propagation 49,92-94. Concerning other cytokines, there is still limited information about their role in seizure phenomena 34,95.
1.7 IL-1β
The pro-inflammatory cytokine IL-1 is a pivotal regulator of immune responses to pathogens and to injury and, not surprisingly, it has similar effects within the CNS 96. All the IL-1 family members are present within the brain 97, being IL-1β the most studied IL-1 in neuroinflammation and epilepsy 98,99.
IL-1β is synthesized as a 31 kDa inactive precursor (pro-IL-1β) 100. Therefore, to become the bioactive 17 kDa form, the pro-IL-1β requires an enzymatic cleavage, by caspase-1, also known as IL-1β converting enzyme (ICE). The biological function of both IL-1β is mediated through the binding to interleukin-1 receptor type I (IL-1RI), which induces an association with the receptor-accessory protein (IL-1RAcP). This complex is able to initiate an intracellular signal through an adaptor protein, myeloid differentiation factor 88 (MyD88) 100,101. This is followed by an activation of several transcription factors, such as nuclear factor-κB (NF-κB), mitogen-activated protein kinases (MAPKs), among others 101. IL-1β is considered a pivotal mediator, not only because of its ability to upregulate other inflammatory cytokines, such as IL-6 and TNF-α, but also because it is the first cytokine released in pathologic conditions 100,102.
7 A strong activation of IL-1β/IL-1R1 complex was already described in both glial and neuronal cells in the analysis of human brain specimens of TLE patients with hippocampal sclerosis 103,104. Furthermore, and regarding IL-1β effects in synaptic transmission, an enhancement of neuronal excitability and also a decrease in seizure threshold were described in hippocampus and other seizure sensitive regions 105,106. Therefore, IL-1β is classified as pro-convulsive molecule, while inhibitors of its pathway may be powerful anticonvulsants 107.
1.8 TNF-α
TNF-α is a pleiotropic cytokine, playing pivotal roles in immunity, cell proliferation, differentiation and cell death through the activation of several downstream signaling cascades 108.
TNF is synthesized as a 26 kDa transmembrane protein precursor (mTNF) and cleaved into a 17-kD mature soluble form (sTNF) by the metalloprotease TNF-α converting enzyme (TACE) 109. The biological effects of TNF-α are mediated through the interaction with transmembrane receptors, namely TNF receptor type 1 (TNFR1 or p55) and type II (TNFR2 or p75) 108. Whereas TNFR1 is expressed in the majority of CNS cell types and activated by both mTNF and sTNF, TNFR2 is mainly expressed in microglia cells and only activated by mTNF 110.
There are two main groups within the TNFR superfamily of receptors. The first group induces cell death signaling and is only carried out through TNFR1 (p55), since TNFR2 (p75) lacks a functional death domain (DD). Thereby, TNFR2 only signals for anti-apoptotic reactions, leading to the production of neurotrophic, neuroprotective and anticonvulsant factors 34. The TNF-α/TNFR1 complex is able to recruit several members of the caspase family of cell death proteases, such as the initiator caspase-8 and -10, which cleave effector caspases, particularly caspase-3 111,112. The second group can be constituted by both receptor types whenever they present the TRAF interacting motifs (TIM) domain, which binds to TNFR-associated factors (TRAFF) 113. The signal is carried out through this complex by the activation of transcription factors, such as NF-κB, Jun N-terminal kinases (JNK), and MAPKs 108. Recent studies have shown that, like IL-1β, TNF-α possesses neuromodulatory properties and is, thereby, able to increase neuronal excitability through several effects in neurotransmission mediated by TNFR1 114,115. The consequence of TNF-α on seizures and on the determination of inflammatory processes towards neurodegeneration or neuroprotection, seems to depend on its level in the
8 brain and which receptor type is predominantly activated 69. In fact, TNFR1 is described as a pro-ictogenic factor, while TNFR2 plays an anti-ictogenic role 114.
1.9 IL-6
IL-6 is also recognized as a pleiotropic cytokine that was originally classified as a pro-inflammatory cytokine. However several discoveries indicated that this interleukin has also anti-inflammatory properties 116. IL-6 has emerged as a key player in the nervous system, which is evident from its involvement not only in neuroinflammation, but also in several nervous system pathologies 116.
This cytokine exerts its biological functions by binding to the non-signaling IL-6 receptor (IL-6R). Therefore, the recruitment of additional receptor proteins is necessary to induce the signaling pathways 117. The IL-6/IL-6R complex specifically triggers the homodimerization of glycoprotein 130 (gp130) with the alpha subunit of IL-6R. This, in turn, activates IL-6 signal transduction through intracellular tyrosine-kinases such as Janus kinases (JAK-1 and JAK-2) 110,117,118.
Similarly to IL-1β and TNF-α, IL-6 is rapidly produced by glial cells during seizure activity 48. However, astrocytes are considered the major producers of this cytokine 116. Various studies have emphasized the role of this cytokine in the initiation of inflammation, through the production of chemokines, cytokines (e.g., IL-1β, TNF-α and IL-6 itself) 119. In relation to excitotoxicity and seizure generation, IL-6 has a dual effect that appears to depend on its levels in the brain and on the type of cells producing the cytokine, emphasizing the importance of the tissue microenvironment 34,116,117. However, the mechanisms underlying the protective or destructive effects of this interleukin in neuronal excitotoxicity are not yet completely understood 116. Noteworthy, the majority of studies describe IL-6 as a neurotrophic factor, with an important role against excitotoxicity-induced neuronal damage 116.
1.10 Cell death
The knowledge of molecular pathways underlying neuronal death are considered very important in epilepsy 111. Numerous studies performed in both experimental models and in TLE patients showed that repeated or prolonged seizures (status epilepticus) can cause neuronal death within vulnerable brain regions, such as the hippocampus 111,120. Moreover, evidence
9 proved that cell death is also able to induce seizures 111. The main mechanism of epileptic cell damage has been attributed to excitotoxicity, which mainly results from an over-activation of ionotropic glutamate receptors, since glutamate is the principal neurotransmitter in the brain 121. Excitotoxicity is able to provoke cell death by necrosis and apoptosis 122-124. Necrosis and apoptosis are two different forms of cell death 125. Necrosis usually occurs when cells are injured to the point where they are beyond repair and provokes damage to the surrounded tissue 126. On the other hand, apoptosis is a physiological process of programmed cell death, meaning that, it is cell-autonomous and controlled 124,127, with formation of membrane-enclosed vesicles, known as apoptotic bodies 128. In contrast to necrosis, apoptosis does not inflict damage to the surrounding tissue and neither induces inflammation 126.
Caspases, a family of cysteine proteases, are the central regulators of apoptosis. Two major caspase-dependent pathways have been described. The intrinsic pathway, considered as the most relevant to seizure-induced neuronal death, is activated by several intracellular stressors, and ultimately leads to initiator caspases (e.g., caspase-9) activation, which processes the downstream effector caspases (e.g., caspase-3, -6, and -7) 120,129-131. The extrinsic caspase pathway is activated by cell surface-expression of death receptors of TNF superfamily 132. Upon binding to its receptors, TNF recruits intracellular adaptor proteins such as Fas-associated death domain protein (FADD) or TNFR associated death domain (TRADD) 133. Then these complexes recruit caspase-8 and -10 followed by the cleaving of effector caspases, particularly caspase-3 112. Furthermore, there is also a caspase-independent apoptotic pathway 120. In this apoptotic-pathway, apoptosis inducing factor (AIF) and calpains seem to be the critical mediators. Calpain is a protease that coordinates the calcium-dependent signaling pathways underlying neuronal death 134.
1.11 Experimental Models of epilepsy
The development and characterization of experimental models has offered an enormous contribution to the knowledge of basic cellular, molecular and electrophysiological mechanisms of epileptogenesis 135,136. Nevertheless, validated experimental models of epilepsy are essential to gain insights into the neural mechanisms of epilepsy, but also to test the efficacy of new AEDs and novel therapeutic approaches 137. Given the disadvantages of the in vivo models, such as the need for large number of animals, the high mortality, and the relative slow data collection, there is an increasing interest in simpler models of epilepsy 138,139. In vitro models
10 allow the application of a more detailed and well-controlled variety of methods that would, otherwise, be difficult to employ under in vivo conditions 140, while preserving the critical network phenotypic features which generate recurrent seizures 141. However, these seizure models lack the behavioural and motor components of clinical seizures 140. Acute brain slices are the most popular in vitro preparations. 140. However, it also has several disadvantages. One of them is the very short viability of acute slices, which only last for a few hours and unable to study chronic epileptogenesis. In contrast, cultures of brain tissue (e.g., organotypic hippocampal slice culture) are considered a long-term preparation, maintaining, over time, many aspects of the in vivo context, such as the brain architecture and the functional local synaptic circuitry 142.
1.12 OHSC as a model of epileptogenesis
Over time, the organotypic hippocampal slice cultures (OHSC) have been progressively useful and advantageous for the study of several neurobiological disorders, including epilepsy and neuroinflammation 143,144. These cultures reproduce and preserve the intrinsic properties and the complex in vivo organization of the cellular network 145. Moreover, they can be maintained for several weeks in an artificial growth medium allowing to follow long time effects 140.
There are two studied methods used to prepare slices cultures: the roller tube, pioneered by Gähwiler 146 and the membrane interface technique, established by Stoppini and co-workers 147. Usually, the cultures of organotypic slices of hippocampus and cortex regions, are prepared from 6- to 7-day-old pups (P6-7) 148, since at this age the hippocampal cytoarchiture is already established and can then be studied from 7 to 30 days in culture 135. OHSC are prepared from postnatal rats and do not represent adult tissue 135. Only after three weeks in vitro (21 days in vitro) 149, the maturation of the different cell types, synaptic contacts and receptor expression resembles what is observed in the adult tissue 142,150–152
The trauma of culturing has a profound effect on the survivability of neurons. A robust degeneration of neurons start as early as four hours after culturing and continues up to at least 6 DIV followed by a low-level of neuronal death that persists up to at least 28 DIV 153. Furthermore, the deafferentation that occurs during tissue slicing, leads also to some reorganizational processes, which are also observed in chronic epileptic rats 154 and epilepsy humans patients 155. These reorganizational processes include: mossy fiber sprouting and formation of recurrent excitatory connectivity (also a feature of TLE) and reorganization in
11 CA1 region 156-160. As a consequence of these alterations, excitatory activity progressively increases during culture time and epileptogenesis may be initiated 159,161,162. Therefore, OHSCs may provide a model of chronically epileptic tissue, since the development of abnormal connectivity in the organotypic slices mimics the aberrant connectivity found in the epileptic brain 135. Despite these morphological features, spontaneous epileptiform activity without pharmacological induction has rarely been reported in OHSC 163. However, recently, some groups described in detail the functional characterization of spontaneous development and evolution of epileptiform activity within OHSC, which were maintained in an artificial growth medium without serum (Neurobasal A supplemented with B-27) 164,165. A high incidence of spontaneous epileptiform activity was recorded in OHSCs from 7 to 30 DIV. Other features related to TLE, such as the latent period and anticonvulsant resistance, were also reported 141,164.
Taken together, the electrophysiological and morphological abnormalities described so far make the OHSC a simple and powerful system that can allow the study of cellular and molecular mechanisms involved in the mechanisms of epileptogenesis. Hopefully, it will bring us one step closer toward the development of novel therapeutic approaches.
2 A
IMSResearch directed toward the therapeutic benefits of anti-inflammatory agents is now considered crucial on the ongoing search for novel antiepileptic drugs 167. Targeting inflammatory pathways, is regarded as a novel option for the development of biomarkers 168 and therapies for epilepsy 12. Thus, a full knowledge about the crosstalk between neuroinflammation and epileptogenesis is imperative.
In this work the organotypic hippocampal slice model of epileptogenesis 164 was used in order to disclosure the impact of spontaneous epileptiform activity upon inflammation. In order to accomplish this, a molecular characterization of inflammatory mediators was carried out. Several topics were evaluated throughout culture time, namely:
Cell death;
Astrocytes and microglia activation;
Transcript expression of inflammatory cytokines, specifically IL-1β, TNF-α and IL-6.
12
3 M
ATERIALS ANDM
ETHODS3.1 Animals
Sprague-Dawley rats were obtained from Charles River (Barcelona, Spain). All the procedures were performed according to the European Union guidelines (2010/63/EY) and Portuguese law concerning the protection of animals for scientific purposes. All efforts were made to minimize animal suffering and to use the minimum number of animals.
3.2 Organotypic Hippocampal Slice Culture
In this work, organotypic hippocampal slice cultures were prepared from 6- to 7- days-old Sprague-Dawley rats, according to the interface culture method 147. Rats were decapitated, brains were removed and placed, under sterile conditions, in cold Gey’s balanced salt solution (GBSS) with 25 mM glucose.
Combined Entorhinal cortex-hippocampi slices were dissected out and sliced transversely at a thickness of 350µm using a McIIwain tissue chopper. Five slices were placed onto porous (0.4 µm) insert membranes (PICM 0305 Millipore, Bedford, MA) and transferred to six-wells culture plates (Corning Costar, Corning, NY) (Figure 9 in Appendix, section 9.1). Each well was filled with 1mL of medium, containing 50% Opti-MEM, 25% Hank’s balanced salt solution, 25% heat inactivated horse serum, 25 mM glucose, 100 units/mL of penicillin and 100 µg/mL of streptomycin. The culture plates were maintained in an incubator at 37°C in 5.0% CO2 and 95% atmospheric air.
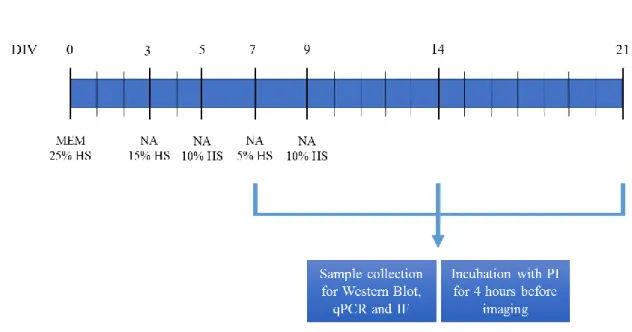
After 3 days in vitro the culture medium was replaced with 1mL of a chemically defined serum-free medium, Neurobasal A, supplemented with 1mM L-glutamine, 100 units/mL of penicillin and 100 µg/mL of streptomycin, 2% B-27 (contains several hormones, fatty acids and free radical scavengers 169,170 and decreasing horse-serum concentrations until a serum-free condition was reached at 9 DIV (Figure 10 in Appendix section 9.2). Since several amino acids are rapidly consumed within 2 days 171 and glutamine spontaneously degrades, generating a toxic product (ammonia) 172, Neurobasal A-based medium was changed every second day, for three weeks (21 DIV). All experimental assays were carried out at 7, 14 and 21 DIV.
13
3.3 Propidium iodide (PI) uptake assay
Cell death in OHSCs was evaluated by the cellular uptake of the fluorescent dye propidium iodide (PI). Staining in OHSC is simpler because the dye can be added to the culture medium 140. PI only enters cells with damaged membranes, and when bound to nucleic acids it allows to see the damaged cells brightly fluorescent (absorbance at 530nm and emission at 620nm) 173. PI is not toxic to cells and has been widely used as an indicator of neuronal membrane integrity and cell damage 145. The slices at 7, 14 and 21 DIV were incubated with 2µM sterile propidium iodide solution (Sigma, St. Louis, MO, USA) for 4 hours before imaging. Cellular uptake of PI was recorded in a widefield fluorescence microscope (Axiovert 200, Zeiss, Germany) using an EC Plan-NeoFluar 5x objective, a rhodamine filter and a digital camera. 50 ms exposure time was used in all assays. For quantitative assessment of neuronal damage, the regions of interest (CA1, CA2/CA3 and DG) were delineated using the software application ImageJ (NIH). The intensity value of each analyzed region was obtained by correction with a fluorescence background image. This assay does not discriminate between necrosis and apoptosis.
3.4 Western blot
3.4.1 Tissue lysatesIn this study, Western blot analysis was performed in order to address expression changes of proteins related to cell death and also in glial cell markers.
Hippocampi were dissected from 4-5 slices and cell lysis were performed in 150 µL of RIPA (Ristocetin Induced Platelet Agglutination) buffer containing 50mM Tris pH 8.0, 1mM EDTA (Ethykenediamine Tetraacetic Acid), 150mM NaCl, 1% NP40 substitute (Nonyl phenoxlpoylethanol, from Fluka Biochemika, Switzerland),1% SDS (Sodium Dodecyl Sulfate) and 10% glycerol. During extraction, protein degradation is prone to occur due to endogenous proteases released upon cell disruption. Thereby, RIPA buffer was supplemented with protease inhibitors (Complete Mini-EDTA free, Roche, Germany) and 1mM PMSF (phenylmethysulfonyl fluoride). Cell suspension was left shaking during 15 min at 4ºC and the insolubilized fraction was removed by centrifugation, 11000g for 10 min at 4ºC. Finally, the supernatant was collected and stored at -20ºC for further use.
14 Total protein was quantified with the BioRad DC Protein assay Kit, using BSA (Bovine Serum Albumin) as standard. Before samples were loaded onto the gel, they were submitted to a temperature of 95ºC for 10 min in order to denature the higher order structures, while retaining sulfide bridges.
3.4.2 Western blot assay
Samples (40μg of protein per lane) and protein size markers (Precision Plus Protein Standars, Bio-Rad) were run on a standard 12% SDS-PAGE and electrotransferred onto a PVDF membrane (Millipore) at a constant voltage of 150 V for 1h30.
Membranes were blocked for 1h with 3% BSA in TBS-T (20mM Tris base, 137mM NaCL and 0.1% Tween-20) at room temperature. Subsequently, membranes were probed with the primary antibodies (Table 1 in Appendix section 9.3), diluted in TBS-T with 3% BSA, overnight at 4°C. Finally, membranes were incubated for 1h at room temperature, with goat anti-rabbit, donkey anti-goat or donkey anti-mouse secondary antibody (1:10000, Santa Cruz Biotechnology) linked to HRP (Horseradish Peroxidase). Development of signal intensity was carried out using ECL Plus Western Blotting Detection System (Amersham-ECL Western Blotting Detection Reagents from GE Healthcare, Buckingamshire, UK) and detected using X-Ray film (Fujifilm). The relative expression of the protein bands was accomplished with Image J software and standardized for GAPDH (Glyceraldehyde 3-phosphate dehydrogenase) levels. Protein levels at 14 and 21 DIV were normalized to 7 DIV levels.
3.5 qPCR
3.5.1 RNA isolation and quantification
RNA was extracted from OHSCs according to QIAGEN RNeasy Mini Kit (Qiagen). Slices, were defrosted in 1ml of QIAzol Lysis reagent with a TissueRuptor homogenizer, previously DEPC-treated. Quantification of total RNA was accurately determined using Nanodrop 1000 (ND-1000 Spectrophotometer, Thermo Scientific).
15
3.5.2 Reverse Transcription reaction
Two reaction mixes were prepared to perform the in vitro reverse transcription (RT) reaction: 1) RNA mix containing 2 µg of total RNA, 1 µL of random primers and 1 µL dNTPs, in a total volume of 10 µl; 2) SuperScript mix containing 25 mM MgCl2, 0.1M DTT (Dithiothreitol) and SuperScript II reverse transcriptase buffer in a total volume of 10 µl. RT-PCR was carried out in a thermoclycler (MyCycler – Bio-Rad, Hercules, CA 94547).
First RNA was heated for 5 min at 65 ºC and chilled for 2 min at 4ºC, followed by the addition of the SuperScript mix. When temperature reached 25 ºC, 50 units of SuperScript II Reverse transcriptase (EC 2.7.7.49, Invitrogen, Carlsband, CA, USA) was added followed by 60 min at 42 ºC (optimal SuperScript II temperature). Reaction was terminated by inactivating the enzyme for 20 min at 72 ºC.
For each RNA sample a reverse transcription reaction was carried out in the absence of reverse transcriptase in order to ensure that product amplification did not arise from genomic DNA.
3.5.3 Relative quantification
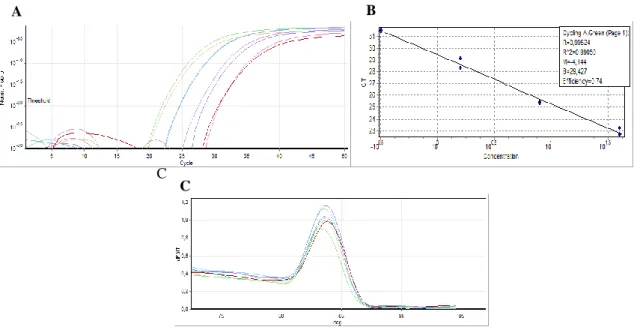
cDNA amplification was performed in a Rotor-Gene 6000 real-time rotary analyzer thermocycler (Corbett Life Science, Hilden, Germany) in the presence of SYBR Green Master Mix (Applied Biosystems, Foster City, CA, USA) and 0.2 µM of each specific gene primer (Table 3 in Appendix section 9.4). The amplification of cDNA was carried out by the following program: an initial denaturation for 2 min at 95ºC, 50 cycles with 30s at 94ºC, 90s at 60ºC and 60s at 72ºC, followed by a melting curve to assess the specificity of the reactions. The Ct (Cycle Threshold) and the melting curves (panels C of Figures 14-21) were acquired with Rotor-gene 6000 Software 1.7 (Corbett life Science). In order to determinate the PCR efficiency (E) for each gene, which is needed for relative quantification by comparative Pfaffl method, a qPCR with cDNA samples from 5-fold sequential dilutions of cDNA was performed for each set of primers. In all experiments GAPDH was used as a reference internal gene. For each gene, replica reactions were performed and the mean of two reactions was used to calculate the corresponding expression level. Two types of negative controls were run with samples, 1) no reverse transcription control, which used cDNA obtained in the absence of SuperScript II and 2) no template control, which did not contain cDNA.
16
3.6 Gel electrophoresis
The electrophoresis was performed in a 2% agarose gel in TAE buffer (Tris-acetate-EDTA: 20mM glacial acetic acid, 40 mM Tris base and 1 mM EDTA) with 0.05 µL of GelRed (Invitrogen, Biotechnology) per 1 mL of TAE. After amplification in Rotor-gene 6000, 15µL of each PCR product plus 3µL of loading buffer (6x NZYDNA loading dye, Nzytech) were loaded on the agarose gel. Molecular weights of cDNA were assessed by running, alongside, a marker for DNA size (5 µl) (NZYDNA Ladder V, Nzytech).
3.7 Immunohistochemistry (IHC)
3.7.1 ImmunohistochemistrySlices were fixed for 1h with 4% paraformaldehyde (PFA) diluted in phosphate-buffer solution (PBS) at room temperature, followed by an incubation in increasing concentrations of a sucrose solution (10% and 20% in PBS) at room temperature and lastly slices were kept in 30% sucrose solution at 4ºC until further use.
Slices were cut out of the insert and put in slides (2 slices per slide). Each slice was surrounded with DAKO pen (Dako, Denmark) to protect staining areas from drying out and from mixing with each other. Followed PBS washes, slices were incubated for 3h at room temperature in blocking solution containing 10% BSA 10% Horse Serum and 1% Triton X-100 in PBS, which ensure simultaneous blocking and permeabilization of the tissue. Subsequently, slices were incubated with the primary antibodies (Table 2 in Appendix section 9.3) diluted in blocking solution for 48h at 4ºC. Slices were rinsed with PBST (PBS containing 0.1% Tween-20) and the secondary antibodies, coupled to fluorophores (donkey anti-rabbit Alexa Fluor 488, donkey anti-goat Alexa Fluor 488 or donkey anti-mouse Alexa Fluor 568, 1:400, Invitrogen), were applied to the slices for 24h at room temperature. The nuclei were stained with Hoechst 33342 (1:100 dilution in PBS from a 2mg/mL stock; Invitrogen) for 40 min at room temperature and then washed. The coverslips were mounted in Mowiol (40 µL per slice), which is a non-absorbing compound without autofluorescence and light scattering, and is, therefore, considered adequate for fluorescence microscopy. Finally, slices were imaged with a confocal laser scanning microscope (LSM 710, Zeiss, Germany), using an EC plan-NeoFluar 5x to obtain images of the whole hippocampus and a Plan-Apochromat 20x objective (Zeiss, Germany) to achieve specifically images from DG, CA3 and CA1 regions.
17
4 R
ESULTS4.1 Cell death
As already mentioned, cell death and neuroinflammation are closely associated 27,124. In order to characterize cell death in the OHSC model of epileptogenesis an evaluation by PI uptake and αII-Spectrin cleavage was carried out. Assays were performed at 7, 14 and 21 DIV.
4.1.1 PI uptake
PI uptake in DG, CA3 and CA1 regions of organotypic slices was measured. The three analyzed time points show PI-positive cells in all regions of the hippocampus (Figure 1A), which corroborates the occurrence of cell death. The lower PI uptake was observed at 7 DIV slices, while the maximum cell death occurred at 14 DIV slices (Figure 1B). When comparing 7 and 14 DIV slices, all regions show a significantly higher level of PI uptake in 14 DIV slices (DG: 33.39 ± 4.13 vs 107.1 ± 9.86; CA3: 22.59 ± 2.89 vs 133.1 ± 9.79; CA1: 59.16 ± 4.07 vs 160.2 ± 11.90, ***p<0.001) (Figure 1B). Regarding 14 and 21 DIV slices, CA3 (133.1 ± 9.79 vs 54.24 ± 10.04, **p<0.01) and CA1 regions (160.2 ± 11.90 vs 98.69 ± 9.63, *p<0.05), show a significant decrease of PI uptake in 21 DIV slices (Figure 1B). In DG, a significant increase in PI uptake was observed from 7 to 14 DIV slices, as pointed out above, while no differences were obtained between 14 and 21 DIV slices (107.1 ± 9.86 vs 101.0 ± 14.96, p>0.05) (Figure
1B). Overall, the CA1 was the region that suffered the highest cellular damage at all three
evaluated time points (Figure 1B).
4.1.2 αII-Spectrin cleavage
Characterization of cell death was also assessed through the evaluation of αII-Spectrin cleavage and Pro-caspase-3 activation by a western blot assay, carried out with protein extracts obtained from the hippocampal region of the slices.
αII-Spectrin is a structural protein of the cell membrane cytoskeleton, being important for membrane stability and cell shape regulation 174. This cytoskeleton protein is abundant in neurons of the CNS and plays vital roles in neuronal support and synaptic plasticity 175. In its simplest form, spectrin has a molecular weight of a 250 kDa and it is a major substrate of calcium-dependent proteases, such as calpain and caspase-3. Calpain is involved in necrotic
18 and apoptotic cell death, while caspase is only activated in apoptosis 176. Thereby, events as neuronal death and stress or injury, which enhance proteolysis, lead to an increase of spectrin break down products (SBDP) 175. There is a unique calpain mediated fragment with a molecular weight of 145 kDa (SBDP 145). Caspase-3 mediated alpha II-Spectrin cleavage leads to the formation of SBDP 150, which has 150 kDa. In addition, this product can be further degraded by caspase-3, producing the apoptotic-specific 120 kDa fragment 176. For this reason, recent works use the SBDP as a potential biochemical marker of cell death in neurodegenerative disorders 177,178. Since αII-spectrin presence in glial cells is minimal, the SBDP are highly specific for neuronal damaged 174. The three referenced spectrin breakdown products can be detected by antibodies against αII-spectrin 175, allowing to discriminate which type of cell death process is occurring in OHSC, throughout time in culture.
Figure 1| Propidium iodide (PI) uptake in OHSC. A) Representative photomicrograph depicting PI staining show differences
in cell death between DG, CA3 and CA1 regions of hippocampus throughout time in culture. B) Quantification of PI uptake in each hippocampal region expressed in arbitrary units of fluorescence intensity. All values are mean ± SEM. 9 < slices <30; *p<0.05, **p<0.01, p***<0.001, one way ANOVA followed by Bonferroni’s Comparison Test.
14 DIV
7 DIV 21 DIV
A
Propidium iodide (PI) uptake B DG CA3 CA1 50 100 150 7 DIV 14 DIV 21 DIV *** * *** ** * *** P I F lu o r es c en c e (i n ar b it rar y u n it s)
19
Figure 2| Western blot analysis of alpha-II Spectrin and Caspase-3. A) Representative immunoblots of αII Spectrin and
Caspase-3 at 7, 14 and 21 DIV. Lane Aβ, which contains a sample of primary neuronal cultures incubated with Aβ, was used as a positive control of αII Spectrin cleavage and of caspase-3 activated form. GAPDH was used as the loading control. Densitometry analysis of αII-Spectrin (B), SBDP 145/150 (C) and pro-caspase 3 (D) performed with ImageJ software. All values are mean ± SEM. N=4-8; *p<0.05, one way ANOVA followed by Bonferroni’s Comparison Test.
In the three time points studied, full-length αII-spectrin (250 kDa) was detected by western blot analysis (Figure 2A). In relation to 7 DIV, a tendency for decreased expression was observed, but with no statistical significance (7 DIV: 1.083 ± 0.0866; 14 DIV: 0.9717 ± 0.08923 and 21 DIV: 0.7771 ± 0.05018; p>0.05) (Figure 2B). The expression of SBDP 150 and SBDP 145 was not possible to visualize separately (Figure 2A), and since the 120 kDa SBDP, which resulted from the caspase-3 cleavage of αII-spectrin, was absent from all times points, the band visualized at approximately 150 kDa corresponds solely to the calpain-mediated fragment of spectrin (SBDP 145). The expression of SBDP 145 increased significantly from 7 to 14 DIV slices (7 DIV: 1.000 ± 0.1648 vs 14 DIV: 1.685 ± 0.1304, *p<0.05), but no further differences in cell death were obtained from 14 DIV on (14 DIV: 1.685 ± 0.1304 vs 21 DIV: 1.303 ± 0.1841, p>0.05) (Figure 2C).
Regarding the caspase-3 immunoblot, a tendency for decreased pro-caspase-3 expression (32 kDa) was detected at 14 DIV (0.7425 ± 0.1209) and at 21 DIV slices (0.6700 ± 0.0723), when
A
B
II-Spectrin
7 DIV 14 DIV 21 DIV
0.0 0.5 1.0 1.5 2.0 * F o ld c h a n g e SBDP 145/150
7 DIV 14 DIV 21 DIV
0.0 0.5 1.0 1.5 2.0 * F o ld c h a n g e Pro-caspase 3
7 DIV 14 DIV 21 DIV
0.0 0.5 1.0 1.5 2.0 F o ld c h a n g e C D
20 compared to 7 DIV slices (0.9983 ± 0.1298, n=6) (Figures 2A and 2D). However, the band corresponding to the active caspase-3 form (17 kDa) was absent in all time points. In order to prove the proper antibody staining, a positive control (lane Aβ), which contain a lysate from a primary neuronal culture treated with Aβ 179, was loaded into the gel. As depicted in Figure
2A, this sample shows the presence of SBDP 120 and of the 17 kDa band of active caspase-3.
Altogether, these results indicate that the pro-caspase-3 was progressively cleaved but not by an initiator caspase and thus, does not originates the active caspase-3. These results also corroborate the detection of αII-spectrin break down products originated by calpain cleavage only and not by caspase-3 cleavage, and point to the occurrence of cell death by necrosis or through the caspase-independent apoptotic pathway.
4.2 Astrogliosis and microglia activation
Reactive gliosis is considered as a major hallmark encountered both in neuroinflammation and in temporal lobe epilepsy 13,41–43. Therefore, the astrocytic and microglial activation was evaluated in the OHSC model of epileptogenesis. Glial fribrillary acidic protein (GFAP) is an intermediate filament protein (with cyto-architectural function), expressed specifically in astrocytes. For this reason, GFAP expression has become an astrocytic marker 82. Moreover, an increased expression of this protein represents the activation of astrocytes 180. Ionized calcium-binding molecule 1 (Iba-1) is a protein with a localization restricted to microglia 181,182, thus being used as a microglia-specific marker. Calcium-binding protein expression level increases upon microglia activation 182 and it has proven to be helpful in visualizing microglia morphology 183. Astrocytes and microglia were evaluated through GFAP and Iba-1 expression, respectively, by western blot analysis and by immunohistochemistry assays. The western blot assay was used to evaluate the expression level, while immunofluorescence assay allowed to assess astrocytes and microglia morphology within time in culture.
4.2.1 Analysis by western blot
Although a tendency for increased GFAP protein expression from 7 to 21 DIV was observed (Figures 3A and 3B), no significant differences (p>0.05) were achieved between 7 (1.076 ± 0.1135), 14 (1.157 ± 0.0785) and 21 DIV slices (1.263 ± 0.07632). Regarding Iba-1 protein expression (Figure 3A), a significant decrease was found in both 14 DIV (0.6240 ± 0.0565, *p<0.05) and 21 DIV slices (0.6075 ± 0.0584, *p<0.05) when comparing with 7 DIV slices (1.000 ± 0.1388) (Figure 3C).
21
Figure 3| Western blot analysis of GFAP and Iba-1. A) Representative immunoblots of GFAP and Iba-1. GAPDH was used
as the loading control. Densitometry analysis of GFAP (B) and Iba-1 (C) performed with ImageJ software. All values are mean ± SEM. N=6-10, *p<0.05, one way ANOVA followed by Bonferroni’s Comparison Test. Statistical tests were performed in comparison with 7 days DIV slices.
4.3 Analysis by immunofluorescence
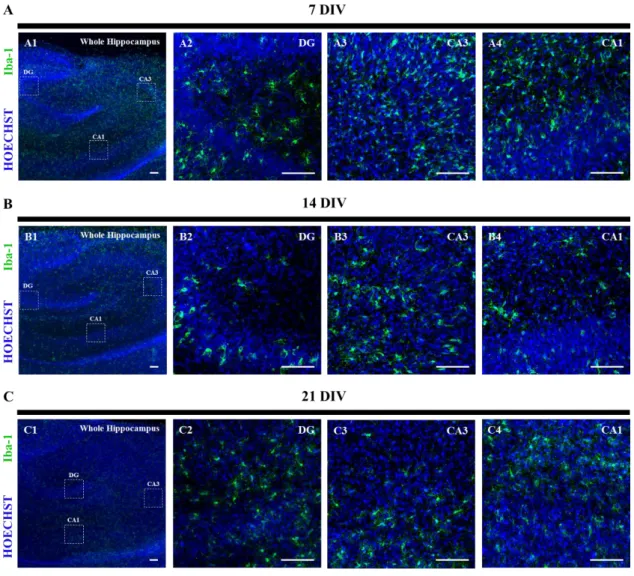
The following panels depict the immunofluorescence images obtained by the double detection of Hoechst, together with GFAP (Figure 4) and Iba-1 (Figure 5). An evaluation of glia morphology changes throughout time was performed in DG, CA3 and CA1 regions of the hippocampus. The specific areas where the images were taken are delineated by the dotted line drawn in the image of the whole hippocampus.
4.3.1 Astrocyte activation
GFAP staining at 7 DIV showed a vast number of astrocytes with long and overlapping processes covering the DG and CA3 regions (Figures 4A2 and 4A3), resembling a reactive astrocytic scar, as already described 67,82,184. In CA1 region (Figure A4), the morphology characteristic of moderate reactive astrocytes, the hypertrophic cell body with numerous
A
B
GFAP
7 DIV 14 DIV 21 DIV
0.0 0.5 1.0 1.5 2.0 F o ld c h a n g e Iba-1
7 DIV 14 DIV 21 DIV
0.0 0.5 1.0 1.5 2.0 * * F o ld c h a n g e C
22 interdigitated processes, only within individual domain of each astrocyte, can be observed. The astrocytic scar is not yet defined in this region. As the culture time extended, astrocytic processes became longer and ticker in this region. From 14 DIV on, all regions of the hippocampus are covered with astrocytic overlapping processes, which form a dense glial scar (Figures 4B2-4 and 4C2-4).
Figure 4| Astrocytes activation in organotypic slices at 7, 14 and 21 days in vitro (DIV). Detection of Hoechst stained
nucleus (blue), together with GFAP stained astrocytes (green). Confocal images were obtained with a 5x objective (A1, B1 and
C1) and a 20x objective (A2-4, B2-4 and C2-4). The dotted lines delineate the magnified regions. Scale bar, 200µm.
4.3.2 Microglia activation
Regarding microglia, western blot results point to a significant decrease of Iba-1 immunoreactivity throughout time. This decrease is corroborated by the immunofluorescence assay in the images of the whole hippocampus (Figures 5A1, 5B1 and 5C1) and it can be associated with differences in the activation state of microglia cells. At 7 DIV, microglia cells