MASTER
OF
SCIENCE
IN
FINANCE
MASTER´S
FINAL
WORK
P
ROJECT
EQUITY RESEARCH
–
T
HE
N
AVIGATOR COMPANY
,
S
.
A
.
VERÓNICA ISABEL PEREIRA MARCELINO
MASTER
OF
SCIENCE
IN
FINANCE
MASTER
´
S FINAL WORK
PROJECT
EQUITY RESEARCH
–
T
HE
N
AVIGATOR COMPANY
,
S
.
A
.
VERÓNICA ISABEL PEREIRA MARCELINO
SUPERVISOR:
P
ROF.
DOUTORA CLARA PATRÍCIA COSTA RAPOSOAbstract
The present master´s project proposes to perform a valuation, in order to estimate the equity value of one of the most well-known Portuguese companies, currently trading at Euronext – Sociedade Gestora de Mercados Regulamentados, S.A. (“Euronext”), The Navigator Company, S.A., while adopting the research report format recommended by the CFA institute.
Navigator operates in the much stagnated industry of paper and pulp and, even though it started its history in the 50´s, it is still fully committed to innovate and enter new areas of business.
This valuation will be developed through one Absolute and, one Relative model, being this choice diversity due to the vast variety of model outputs.
This report was written in accordance with the information available on August 3rd, 2019, and
any event subsequent to this date shall not be considered on this valuation.
The target price on August 3rd, 2019 was €3.09, representing a 6.8% upside potential
accordingly with the Discounted Cash Flow method.
It is then issued a BUY recommendation for Navigator´s stock, also considering the medium risk presented, mainly due to the volatility of BHKP prices, paper loss of global power and, instability on the Asian market.
JEL Classification: G10, G32, G34, G39.
Resumo
O presente projeto propõe-se a realizar uma avaliação de uma das mais conhecidas empresas portuguesas, atualmente em bolsa na Euronext – Sociedade Gestora de Mercados Regulamentados, S.A. (“Euronext”), The Navigator Company S.A., adotando para isso o formato recomendado pelo CFA Institute.
Embora a Navigator opere na já muito estagnada indústria do papel e da pasta e, tenha iniciado a sua história ainda nos anos 50, continua inteiramente dedicada a inovar e a entrar em novas áreas de negócio.
Esta avaliação será desenvolvida atráves de um Método Absoluto e, um Relativo, sendo esta escolha diversificada justificada pela elevada variedade de outputs.
Este relatório foi escrito em concordância com a informação disponível a 3 de Agosto de 2019, não devendo qualquer evento subsequente a este ser considerado nesta avaliação.
O preço alvo a 3 de Agosto de 2019 era de €3.09, representando um potencial de 6.8%, de acordo com o modelo de Fluxos de Caixa Descontados.
É então emitida uma recomendação de COMPRA para as ações da Navigator, considerando o nível médio de risco apresentado, maioritariamente devido à volatilidade dos preços de BHKP, à perda global de poder do papel e, à instabilidade no mercado asiático.
Acknowledgements
The present work is the result of a long journey, as a Masters´ student, in the university I called home for five years. It was a long-standing dream, only possible to achieve due to the ones closer to me. This is for all of you.
To Professor Clara Raposo, for giving me the opportunity of learning with one of the best. To the person who made me fall in love with Finance, I will always be deeply grateful for all the guidance. A pure heart should always be recognized.
To my parents, for showing me the strongest form of love and, for giving me wings to fly. I will always comeback.
To my grandparents, for teaching me that hard work should never be a reason to be ashamed of. To my boyfriend, Miguel, for all the infinite patience and support, never letting me give up on my dreams.
Index
Abstract iii
Resumo iv
Acknowledgments v
List of Figures vii
List of Tables viii
Research Snapshot 1
Business Description 2
Management and Corporate Governance 6
Industry Overview and Competitive Positioning 7
Investment Summary 14
Valuation 15
Financial Analysis 18
Investment risks 19
Appendixes 21
Appendix 1: Statement of Financial Position 21
Appendix 2: Income Statement 21
Appendix 3: Cash Flow Statement 22
Appendix 4: Key Financial Ratios 22
Appendix 5: Common-Size Statement of Financial Position 23
Appendix 6: Common-Size Income Statement 23
Appendix 7: Sales Breakdown Analysis 24
Appendix 8: Forecasting Assumptions 24
Appendix 9: Comparable Companies 25
Appendix 10: Multiples Valuation 26
Appendix 11: Discounted Cash Flow Valuation 27
Appendix 12: Sensitivity Analysis 28
Appendix 13: Risk Matrix 29
Appendix 14: Porter´s Five Forces 29
Appendix 15: Abbreviations 30
List of Figures
Figure 1. Risk Assessment 1
Figure 2. Navigator share price evolution 1
Figure 3. Company Logo 2
Figure 4. National Distribution 2
Figure 5. Sales and Services Rendered by Region 2
Figure 6. Revenue by Product 3
Figure 7. European UWF Main Players 3
Figure 8. Revenues by Geography 3
Figure 9. Tissue Revenue by Geography 4
Figure 10. Company´s CAPEX and Depreciations Evolution 4
Figure 11. Shareholder Structure 5
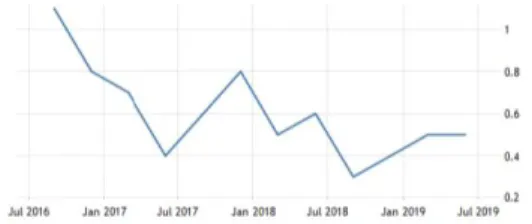
Figure 12. Dividend Payments 6
Figure 13. Industry Dividend Yields 6
Figure 14. Shareholders Geographical Distribution 7
Figure 15. Portuguese GDP Evolution 7
Figure 16. Paper per Geography 8
Figure 17. Navigator Market Share in Western Europe 8
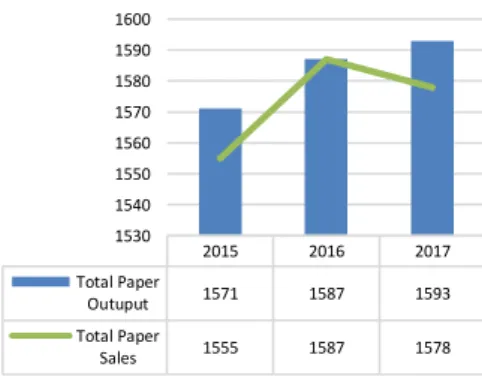
Figure 18. Paper Operational Indicators 8
Figure 19. FOEX Europe – A4 B-Copy 9
Figure 20. World Pulp Production by Region in 2017 10
Figure 21. PIX Europe, in USD/ton BHKP and EUR/ton BHKP 10
Figure 22. Pulp Production, Imports and Exports in 2017 10
Figure 23. Hardwood-Pulp Production Capacity (in million metric tons) 11
Figure 24. World Tissue Consumption Per Region 11
Figure 25. Regional Growth of Tissue Market 11
Figure 26. Production Capacity of the Major Global Tissue Companies 12 Figure 27. Energy Consumption per Product, per industrial unit 12
Figure 28. Wood Imports 12
Figure 29. Porter´s Five Forces 13
Figure 30. E-commerce Global Sales 15
Figure 31. Capital Structure 16
Figure 32. EBITDA Margin 18
Figure 33. Company´s CAPEX Evolution 18
List of Tables
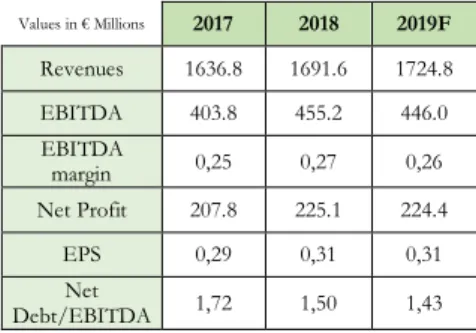
Table 1. Navigator´s Key Values 1
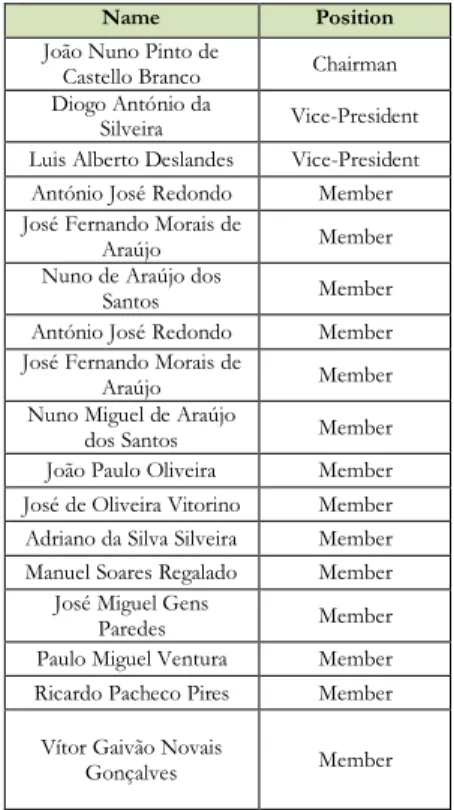
Table 2. Navigator Board of Directors in 2018 6
Table 3. Paper Imports and Exports 9
Table 4. Tissue consumption per person in 2017 (kg/year) 14
Table 5. WACC Assumptions 16
Table 6. Peer´s Selection 17
Table 7. Navigator and Peers Comparison 17
Table 8. Navigator Relative Valuation (2019F) 17
The Navigator Company SA: A Paper
Leader
BUY is our recommendation for The Navigator Company (“Navigator”), with a price target, at the end of 2019, of €3.09, with 6.8% upside potential from the closing price of €2.90 at August 3rd, 2019, carefully analyzed through the
Discounted Free Cash Flow to the Firm method. The statement that Navigator is currently undervalued, is also supported by the method of Relative Valuation.
A successful new (tissue) path
In a time when paper it is losing its king status, Navigator quickly turned to the Iberian tissue sector, where it already has the possibility of becoming the second largest tissue producer. Besides the acquisition of AMS BR Star Paper S.A., in 2015, with 60 thousand tons of tissue production capacity, the latest investment in Cacia, which totaled € 121 million, Navigator now has a total of 130 thousand tons of production capacity, between the two industrial units.
With tissue market growing at 3%-4% annually, this might be the safest growth platform for Navigator to rely on.
Mozambican flop?
In 2009, Navigator created the company “Portucel Mozambique” that would be entirely dedicated to a new project in Mozambique. Responsible for 12% of the area given in by the Mozambican government to companies in the agriculture business, Navigator was quick to announce the creation of 7.000 workplaces and the developing of an area lacking opportunities. However, with few developments, in 2019, investment partners declared that they would be taking legal actions against Navigator, for delayed payments, non-compliance with established contracts and the creation of almost any workplaces. With an impairment already established, besides the € 10 millions of expected yearly investment, this project might carry negative returns with it.
With one of the highest production capacities, engaging dividend yields and strong financial values, Navigator is set to be a more than fair investment.
1.
Research Snapshot
LOW MEDIUM HIGH
Values in € Millions 2017 2018 2019F Revenues 1636.8 1691.6 1724.8 EBITDA 403.8 455.2 446.0 EBITDA margin 0,25 0,27 0,26 Net Profit 207.8 225.1 224.4 EPS 0,29 0,31 0,31 Net Debt/EBITDA 1,72 1,50 1,43
The Navigator
Company, SA
BUY
Medium risk August 3rd, 2019Portugal
Figure 1. Risk Assessment
Source: Company data and author estimates 0 1 2 3 4 5 6 7
Figure 2. Navigator´s Share Price
Evolution
Source: Euronext Lisbon Source: Author Estimates
The Navigator Company S.A., former Portucel Soporcel S.A., is a Portuguese Company, from the Paper and Pulp Industry, considered a global leader in the segment of premium office paper, listed in the Euronext Lisbon Stock Exchange. With headquarters in Setúbal, the company has as ending products, paper, pulp, tissue and energy.
Navigator´s history goes back to 1953, when production of raw pine pulp started, in Cacia, led by the grandfather of the former Chairman of Directors, Pedro Queiroz Pereira.
Since its beginning, several companies were integrated, as Portucel, due to the nationalization of the cellulose industry, in 1976. In 1993, its privatization would begin, with Semapa acquiring the majority of the company by 2004. Since its total privatization, Navigator has registered an outstanding development, with the building of new paper and biomass thermoelectric facilities. Lastly, the period between 2014 and 2015 is a historical one for Navigator, with the construction of a pellet plant in the United States, the inauguration of a nursery of clonal plants, in Mozambique and, the acquisition of a tissue manufacturer, AMS-BR Star Paper, S.A., in order to better reach the European market. Navigator now holds four national industrial units in Cacia, Figueira da Foz, Vila Velha de Rodão and Setúbal, in which are integrated energy generating units. Additionally, Navigator is also responsible for nurseries in Ferreiras, Espirra and Caniceira, as represented in Figure 4. Additionally, the company also counts with several subsidiaries in four continents, including America, Asia, Africa and Europe and, an extra nursery in Mozambique.
The company exports its products to, approximately, 130 countries, with a higher emphasis on Europe and the United States of America (“USA”), ensuring more than 3.000 direct employees, representing 2.4% of Portuguese Exports. When accounting for all the sales and services of Navigator, at 2018YE, 65% were rendered to Europe (when considering the National market), 8% to North America and 23% to Other markets (Figure 5).
2.
Business Description
Figure 3. Company Logo
Source: Company website
Figure 4. National Distribution
Source: Company 2018 Report
Figure 5. Sales and Services Rendered by Region (€ million)
Source: Company Data
342 322 285 316 316 844 888 833 853 851 188 164 143 108 133 168 254 317 360 390 2 0 1 4 2 0 1 5 2 0 1 6 2 0 1 7 2 0 1 8
Operational Segments
Research and Development: With a sustainable business model, strongly
focused on renewable and biodegradable raw materials, the significance of its Research and Development segments is highly understandable. R&D is assured by the recent private non-profit Forest and Paper Research Institute, RAIZ, that increases the competitive advantages of the company, while promoting a sustainable development. Recently, in 2017, this project was strengthened with a €15.3 million investment in Inpactus Program, involving 180 researchers, to better evolve the processes and products involved in the company´s production.
Forest: Seen by the company as one of its most precious assets, at 2017YE,
Navigator was responsible for the management of 112,000 hectares of certified Forest in Portugal and Azores, being these mostly occupied by eucalyptus, protected by high investments in forest fire protection, since 2017. This segment includes the production and sale of ornamental and forestry plants, through its own nurseries Viveiros Aliança, S.A., with a total annual production capacity of 12 million plants and, through breeding grounds in Espirra, Caniceira and Ferreira.
Paper: Considered the largest manufacturer of Uncoated Woodfree (UWF)
paper, in Europe, Navigator sees in its premium office paper brand “Navigator” a 50% market share. However, and as a sales strategy, it is offered by the company a wide range of own brands, representing different price levels and so, different customer segments, in order to better reach out to the market as a whole. Between Office and Offset paper, Navigator presents brands like Explorer, Discovery and Pioneer, with an annual production capacity of 1.6 million tons of paper.
Pulp: Produced from eucalyptus wood, in Setúbal and Figueira da Foz,
Navigator´s paper pulp fits the BEKP (Bleached Eucalyptus Kraft Pulp) type, with only 20% being sold out to the market. With a then production capacity of 1.5 million tons of pulp, where 80% is integrated into paper production, following a vertical strategy, and, as a result of a significant growth in the pulp market, the Figueira da Foz complex was expanded, in 2017, in order to increase its annual production capacity in 70 thousand tons. With this, Navigator is able to sustain its place in the market, while the facility in Aveiro already integrates part of its pulp production into the tissue one.
Energy: With an annual production capacity of 2.5 Twh of energy, Navigator is
the lead producer, in Portugal, of energy from biomass, being responsible for more than 50% of all the power generated from Biomass, in Portugal. This now allows Navigator to be self-sufficient, with the remaining being sold in the market. The production of electrical power and heat through biomass is more accurately called as Co-generation, being most of the needed biomass derived from wastes from forestry operations or, black liquor resulting from the cooking of wood. If there is any necessity to complement the remaining needs of all of its industrial units, the company will purchase biomass from the market.
Also, in this segment was, in 2016YE, included the pellets production, based in Greenwood, USA, as a solid burnable made out of wood residuals. However, in early 2018 it was announced the business disposal to the American company Enviva, for €107.7 million.
74% 10%
5% 10% 1%
Paper Pulp stand alone Tissue Energy Other
Figure 7. European UWF Main Players
Source: Company Data Figure 6. Revenue by Product
Source: Company Data
0% 10% 20% 30% 40% 50% 60%
Figure 8. Revenues by Geography
Tissue: As a company constantly looking for growth and development
opportunities, in 2015, The Navigator Company officialized the acquisition of the Portuguese family company AMS-BR Star Paper S.A., in Vila Velha de Rodão, in order to enter a new business segment. With an annual production of 70 thousand tons of reels and 65 thousand tons of finished product, Navigator began the production of several tissue items, such as napkins or toilet paper, dividing its production into “at home” and “away from home”.
More recently, in 2018, an investment of € 83.4 million on a new tissue mill in Cacia was conducted, leading Navigator to the 3rd place of the largest tissue
producers in the Iberian Peninsula, just behind the well-known Renova. This new mill has a production capacity of 130.000 tons of reels and, 120.000 tons of converting, according to the company´s latest released information.
Other Segments: In 2009, Portucel Mozambique was founded, by The
Navigator Company, as the main project for the production of paper pulp and energy in that region. Until this day, the company has already obtained licenses for 173 thousand hectares in Zambezia and 183 thousand in Manica, with only, approximately, 70% of this area being planted, in order to avoid the displacement of the local population and maintenance of environmental values. On July 2018, Navigator signed a memorandum in which the entire investment is reformulate, totaling an investment of 140 million dollars.
Capital Expenditures as a key driver of profitability
CAPEX appears as a responsible for Navigator´s profitability, as one of the main reasons for variations in produced quantities which will, comprehensively, directly affect revenue.
With a historical concern for development, the company registered, in 2018, a total CAPEX of €216.5 million, mainly driven by the new tissue mill in Cacia and, the expansion of pulp capacity in the Figueira da Foz´s industrial unit. Still, higher depreciations have been registered during the last few years, as depicted in Figure 10, overcoming the registered values of capital expenditures. This leads us to conclude about a low rate of operating assets substitution, together with low reinvestment rates, which will oblige Navigator to take some action, as this situation will not be viable in the long term.
Company Strategies
• Product differentiation: Navigator´s sale strategy is highly based on its own brand products, and how its different values can reach different consumers, increasing its range of business. Made from completely renewable resources, including the industry´s well-known Eucalyptus globulus, the company segments its paper into two categories: Office and Printing Industry, allowing the consumer to, also, choose between ranges of paper, varying between 70 and 80 g/m2. In 2018YE, premium
products registered an increase of 47 thousand tons, the same quantity as the mill ones.
• Integrated Production: Currently integrating almost 80% of its own BEKP pulp into production, Navigator sees here another competitive advantage mainly against European players, reducing its production costs for specific products like paper and tissue. This strategy is led in the industrial units of Figueira da Foz, Setúbal (where the 550 thousand
0 50 100 150 200 250 2014 2015 2016 2017 2018 CAPEX Depreciations
Figure 10. Company´s CAPEX and
Depreciations Evolution
Source: Company Data
52% 35%
13%
Portugal Spain France & Others
Figure 9. Tissue Revenue by Geography
tons of pulp produced per year is 100% integrated in the paper production of this unit) and, Vila Velha de Ródão (unit entirely dedicated to tissue production, where pulp is integrated through pipelines connected to its producer).
• Tissue business: Among the several types of paper, Tissue is the one presenting the most attractive growth expectations, in the long-term, registering an annual growth of 2% to 3%. In order to keep up with the market, Navigator quickly entered into a new business, through the acquisition of AMS, in 2015, which already had an installed capacity of 60 thousand tons, acquiring all of its needed pulp to Altri. Now as a part of The Navigator Company, tissue is produced through the strategy of integration, bringing a competitive advantage to the company, as few European competitors are able to have the same strategy of production. Besides not having new acquisitions planned for the foreseen future, the company´s CEO stated that an eye is always kept opened when it comes to new business opportunities, revealing the company´s efforts to keep its place in the industry.
• Substituting plastic: There is a prominent search, both environmental and social, for new substitutes for plastic items. In order to meet its clients´ expectations, Navigator has already started studying several possibilities to be implemented during the year of 2019, such as: disposable paper cups, straws and cotton buds, as presented at its latest report.
• Focus on Research: Navigator´s concern with Research and Development is another of its known strategies to maintain, and even increase, its market power. All the developments are ensured by Raiz, together with several national and international universities. In recent years, the mechanical strength of the pulp production was already sharpened, the fiber content of the tissue improved and, paper´s features and coating suffered significant advances.
Shareholder Structure
According to Navigator´s Corporate Governance Report and Euronext, from its 717 500 000 total of shares, approximately 69% belongs to Semapa (33.67% from Seinpar Investments), 22.04% are flee float and, Banco Comercial Português (4.24%), Norges Bank (2.16%) and Zoom Lux (2.14%) register the remaining significant positions, as presented in Figure 11. The management team also holds shares, with António José Redondo holding 6.000 shares and, Adriano da Silva Silveira 2.000 shares. Navigator shares are mostly held by Portuguese investors, with a total of 30%, followed by USA and Spain, with 18% and 14%respectively.
The connection between Navigator and Semapa may not be as simple as it seems. As one of the largest Portuguese industrial groups, founded in 1991, Semapa is engaged in three business areas: Pulp and paper, through its holding of 69.40% in The Navigator Company, Cement and other materials, through Secil (99.99%) and, lastly, the Environmental area, through ETSA (99.99%). Semapa is, 72.01% owned by Sodim, directed by the Queiroz Pereira family which, consequently, owns the majority of Navigator´s share capital.
By 2017YE, Navigator accounted for almost 76% of Semapa´s total revenue, with a contribution of €1.637 million, which makes Navigator a key element for
Figure 11. Shareholder Structure
Source: Euronext – Navigator Company Shareholder Structure
Semapa 35.68% Seinpar 33.67% Free-float 22.04% ASF - BCP 4.24% Norges Bank 2.16% Zoom Lux 2.14% Group Owned Stock 0.07%
this company, at the same time as the cement area is registering losses and the environmental one only accounts for 1.34% of total revenue.
Dividend Payout Policy
Known for paying one of the highest dividends in the industry, Navigator commonly presents payout ratios close to 100%, with an outstanding 224% registered in 2015, due to an early distribution.
In 2018, the Navigator distributed a total of € 200 million in dividends, carefully divided in two parts: € 23.71 cents as regular dividends, with an additional € 4.184 cents as free reserves, according to information disclosed in the company´s latest report.
With a distribution value accounting for a 96% payout ratio, 2018´s dividends are still € 50 million below the ones registered in the previous year, which then accounted for a 115% payout ratio.
As an additional note, it is important to mention that 10.2% of Net Income was also distributed to employees, as a common policy of the company.
Navigator dividend yield in 2018 was 9.80%, more than double of the one verified by the average of the industry. It is safe to say that Navigator pays one of the highest dividends in the paper industry.
With € 500.000.000 in fully paid share capital, Navigator sees this capital being represented by a total of 717.500.000 ordinary shares, listed on Euronext, without any nominal value. As of today, Semapa owns 69.4% of Navigator´s share capital, with the remaining 21.4% belonging to institutional investors, mainly from Europe (Figure 14).
As a family owned-business, by the Queiroz Pereira family, Navigator faces some inherent risks. The existing family bonds might restrain the needed separation between personal and business issues. This combination may reveal itself as one of the most severe ones for a company´s health. Any possible breakdown, will make the finding of new common-goals hard, or nearly impossible, leading to an hostile work environment, an increasing employee turnover and, ultimately, to a company out of track.
According to the company´s Articles of Association (Article 8), approved and published in 22nd September 2017, Navigator´s Corporate Bodies, with a term
of office every 4 years, with possibility of renewal, comprise the following: - General Meeting (“GM”) – Obliged to be held, at least, once a year, GM
is responsible for evaluating every Board of Director´s report, Audit Board´s opinions, approving the required financial statements, deciding about the application of every fiscal year profits and, determining all the remunerations of every member in each corporate body, having the power to elaborate a Remuneration Committee.
3.
Management and Corporate Governance
Name Position
João Nuno Pinto de
Castello Branco Chairman
Diogo António da
Silveira Vice-President
Luis Alberto Deslandes Vice-President
António José Redondo Member
José Fernando Morais de
Araújo Member
Nuno de Araújo dos
Santos Member
António José Redondo Member
José Fernando Morais de
Araújo Member
Nuno Miguel de Araújo
dos Santos Member
João Paulo Oliveira Member
José de Oliveira Vitorino Member Adriano da Silva Silveira Member
Manuel Soares Regalado Member
José Miguel Gens
Paredes Member
Paulo Miguel Ventura Member
Ricardo Pacheco Pires Member
Vítor Gaivão Novais
Gonçalves Member
Source: Company Data
Table 2. Navigator Board of Directors in
2018
Figure 12. Dividend Payments (in million €)
2014 2015 2016 2017 2018 Net Income 181.5 196.8 216.8 207.8 225.0 Dividend Payment 200.8 440.5 170.0 250.0 200.0 0.0 50.0 100.0 150.0 200.0 250.0 300.0 350.0 400.0 450.0 500.0 M ill io n €
Source: Company Data
3% 5 .1 3 % 5 .1 9 % 6 .0 0 % 4 .7 0 % 9 .7 6 % 2 .3 8 % 6 .9 7 % 9.8 0 %
Figure 13. Industry dividend yields (2018)
- Board of Directors (“BOD”) – With a composition varying between a total of 3 to 17 members, elected by the General Meeting, the BOD is legally able to insure the correct management of the company, in all the matters not specifically atributed to any other of the corporate bodies. The BOD is currently composed by 17 members, as depicted in Table 2, including a Chairman and 2 Vice-Presidents. With the death of Pedro Queiroz Pereira, former Chairman, in August 2018, Navigator organization suffered a significant change, with João Castello Branco now assuming the Chairman position.
- Audit Board – Responsible for the supervision of the company, analysing and validating proposals submitted by the external auditor, is comprised by 3 full members plus, 2 alternate members. José de Oliveira Vitorino, one of the full members is also the Chairman.
- Staturory Auditor – Besides having PricewaterhouseCoopers & Associates – SROC, Lda, being responsible for the company´s auditory for several years, in 2018 this changed to KPMG & Associates – SROC, S.A., also responsible for several other consultancy services.
Besides the stated corporate bodies, Navigator also has a total of 10 committees responsible for reporting to the BOD. Among these, the most relevant are now presented:
- Executive Committee – Fully composed by 5 executive members of the Board of Directors, the Executive Committee appears as one of the key elements for a well-functioning company, having Diogo da Silveira as Chairman. It is responsible for the presensation of several proposals to the BOD, regarding matters as company policies, strategies, budgets, investments, among several other, while managing holdings in other companies.
- Environmental Board – Now formed by 4 members, with high skills in environment protection, this committee was created in 2008, by the BOD, in order to assist the company in its increasingly concern with environmental issues.
Navigator´s governance structure adopts the Corporate Governance Code published by CMVM (Portuguese Securities Exchange Comission), adopting 28 of its recommendations, with another one only partially adopted, 8 not applicable and, 3 not adopted at all.
Portuguese Economic Outlook
Registering a growth of 2.1%, and according to the Portuguese Statistics Institute (“INE”), Portuguese GDP is still 0.7 percentage points (“p.p”) below the observed in the previous year. This decrease is, according to the Portuguese National Bank previsions, expected to be even more severe in the following years, with GDP stabilizing in a 1.7% growth, for the years of 2019 and 2020, and 1.6% for 2021.
4.
Industry Overview and Competitive Position
33% 20% 15% 12% 8% 6% 5% 1%
Portugal USA + Canada Spain Rest of Europe United Kingdom Norway Germany Rest of the World
Figure 14. Shareholders Geographical
Distribution
Source: Company Data
Figure 15. Portuguese GDP Evolution
Figure 18. Paper Operational Indicators
(thousand tons)
Source: Company Data
2015 2016 2017 Total Paper Outuput 1571 1587 1593 Total Paper Sales 1555 1587 1578 1530 1540 1550 1560 1570 1580 1590 1600
The Portuguese economy is then expected to grow at a lower rhythm, with exports growing at a yearly average of 3.4% until the year of 2021, when these will amount up to 47% of the national GDP.
Paper and Pulp Industry Outlook
In an industry where paper represents the biggest share of revenue but, where its demand has been decaying since 2015, nothing seems to stop companies like Navigator from growing. With the packaging and paper tissue segment growing, alongside with pulp, with a still small new application in textile production, the Pulp and Paper industry was responsible in 2017, for providing 177 thousand direct jobs in Europe, with a turnover of €82 billion, adding €19 billion to the European Union GDP, according to the latest information available.
All the following analysis will be mostly conducted through information provided by CEPI (Confederation of European Paper Industries), which is a non-profit making organization, responsible for the representation of the European pulp and paper industry, more specifically, of a total of 18 European countries.
Paper
Leading the run of European paper manufacturers, and being sixth in the worldwide rank, with a production capacity of 1.6 million tons, Navigator now owns, in Europe, 19% market share in UWF paper and, 58% in the premium segment. Registering a revenue of €1.248 million, accounting for 74% of total revenue, according to the information available at this date, revenues were 0.9% lower than the ones from 2016.
With several types of paper, comes different supply and demand dynamics. However, the main focus of this work will be the UWF paper, produced from bleached hardwood pulp.
Own brands portfolio
With paper production set in two different mills, one in Setúbal, with production capacity of 775 thousand tons and, another in Figueira da Foz, with an annual production capacity of 790 thousand tons, recording sales of 1.578 thousand tons in 2017, as depicted in Figure 18, Navigator´s own brand portfolio, which is divided into brands for the printing industry and, for office paper, increased in 45 thousand tons. Among these brands, are included Explorer, Multioffice, Discovery, Inacopia, Target, Pioneer and Soporset.
Demand Vs Supply
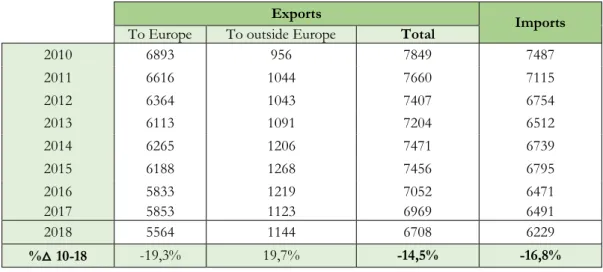
According to the most recent statistics, published by the European Association of Graphic Producers, presented in Table 3, the exports to other European countries, have been showing a significant decrease, in accordance with the limited European growth, registering a 15% decrease in the last seven years. This poses a risk for Navigator, as the majority of its paper exports (64%), is directed to other European countries. With this decrease, the exports for other market outside of the European are gaining strength, with an increase of almost 17%, in only seven years.
Europe 64% US 10% Other Markets 26%
Figure 16. Paper per geography (FY17)
Source: Company Data
50% 22% 20% 11% 18% Premium Cut-Size Folio Reels Total
Figure 17. Navigator Market Share in W.
Europe (H1 2018)
However, and according to the company´s latest report, 2017 consumption in the Asian market, particularly in China, increased by more than 2%, while the American market fell about 6.2%. In Europe, the UWF consumption was kept stable (+0.1%), with a particular increase in the Cutsize and Folio segments, at the same time of a decrease in reels,
Even though the FOEX A4 B-Copy index performed well during 2017, the average price of €815/ton was still below the one verified in 2016, of €823/ton. This situation led the company to take four price increases during the entire year, which were contra balanced by the depreciation of the dollar and the pound, relatively to the euro, leaving the level price almost equal. Then, it was registered a YoY 2018 average price increase of 7.1% on the European reference index, to €873/ton, as portrayed in Figure 19, overcome by Navigator´s price increase of 8.4%.
Although with a much lower volatility, paper prices tend to follow the pulp ones. Several other international markets, as the American, also implemented several increases. Even though the paper price index registered an increase, the pulp price has surpassed paper´s. By this analysis, one can conclude that paper sales are generating a much lower margin, which will affect several industry players.
A troubled 2018?
In 3Q18, paper sales were already 2% lower, when compared to the same period of the previous year, finishing the year with a total decrease of 4%, with only 1.513 thousand units sold, mainly due to all the unplanned stoppages. However, this decrease was contra-balanced by the 8.4% price increase, with sales growing 4% in value, to a total of €1.248 million.
Exports Imports
To Europe To outside Europe Total
2010 6893 956 7849 7487 2011 6616 1044 7660 7115 2012 6364 1043 7407 6754 2013 6113 1091 7204 6512 2014 6265 1206 7471 6739 2015 6188 1268 7456 6795 2016 5833 1219 7052 6471 2017 5853 1123 6969 6491 2018 5564 1144 6708 6229 %△ 10-18 -19,3% 19,7% -14,5% -16,8%
Figure 19. FOEX Europe – A4 B-Copy
Source: Navigator Q4/FY2018 Results Presentation
Table 3. Paper Imports and Exports
Pulp Outlook
As an European lead producer and seller of paper pulp, which is integrated in 80% on its own paper production, Navigator sees this segment only accounting for 10% of its revenues, due to the low percentage of which is sold out to other paper producers.
For its production, the company accounts with one mill in Setúbal, with a production capacity of 580 thousand tons per year, other in Figueira da Foz, with 550 thousand tons and, lastly, one in Cacia, Aveiro, with a total production capacity of 340 thousand tons.
Production
With the European Pulp Production reaching the value of 37.8 million tons in the 2016, being these the last currently available statistics, representing a decrease when compared with the same value, ten years prior, of 43.9 million tons. Nevertheless, these production values have always been connected to a range of 80% to 90% operation rates.
According to data from 2017, in the entire world, the South American and Asian market are the ones with the highest pulp production, with 34.9% and 22%, respectively. However, when considering only the CEPI market, Sweden (32.2%) and Finland (28.5%) appear as the biggest producers of pulp, in the entire Europe, followed by Portugal (7.3%).
Supply & Demand
Pulp prices registered its initial rising in 2016YE and, since then, have been increasing almost monthly. In the end of 2017, the benchmark index – PIX BHKP – registered a YoY average increase of 16%, in Euros, as seen in Figure 21, registering a final price of €825. In 2018YE, this index had increased 21%, to €880/ton.
Navigator conveyed a reduction in supply, in 2018, due to several maintenance procedures, unexpected stoppages, as planned and unplanned shutdowns, reducing the pulp volume on the market by 18.5%, when compared to 2017YE, to 253 thousand tons, with sales still increasing by 1%, due the compensation via price increases. Furthermore, there is no expected increase in capacity for the years of 2019 and 2020, according to the company´s 2018 results presentation. Globally, supply is registering a gaining strength in the South Hemisphere, where there is low-cost hardwood fiber.
As to the demand, it was considered to be vigorous, leading to price increases in China and Europe, being globally pulled up by increasing living standards and paper production in emerging regions. The company´s pulp price raised 12% over the year of 2017, with sales increasing by €164 million, corresponding to 19% in value.
As to international trade, the Northern and South America come as the lead exporters, with, approximately, 16.658 thousand tons and 20.703 thousand tons, respectively, as conveyed in Figure 22. As to 2018, there was a slowdown in this demand increase, driven by a significant slowdown in China, registering lower prices. However, these are expected to stabilize, due to recent action taken by pulp production leaders worldwide.
South Hemisphere – a growing leader
With eucalyptus representing 72% of planted area and, pulp and paper industrial GDP growing above the country´s, Brazil is establishing a changing role in the
Figure 20. World Pulp Production by
Region in 2017
Source: CEPI – Key Statistics Report 2018
(Accessed in 30th January 2019)
Figure 22. Pulp Production, Imports and
Exports in 2017 (thousand tons)
Source: FAO United Nations (Accessed in 5th February 2019) 5714 15763 16658 20703 3238 18851 5808 836 42801 46 6465 28797 A S I A E U R O P E N O R T H E R N A M E R I C A S O U T H A M E R I C A Exports Imports Production
Figure 21. PIX Europe, in USD/ton
BHKP and EUR/ton BHKP
Source: Navigator Q4/FY2017 Results Presentation
Pulp market, increasing its output at an annual rate of 5.5%, in the decade ending in 2016, with companies like Fibria and Suzano registering the highest production capacities (Figure 23). When compared to the other players in the industry, Brazil registers lower production costs, higher investment in Research and Development and, very favorable climate conditions, being all these factors common to most of the countries in Latin America. As a relevant detail, it´s important to state that, 40% of all Brazilian pulp exports, are designated to China, with the Asian price already reaching $750 per ton, in mid 2018, registering a $140 increase from 2017YE. These export and price values are all expected to register a continuous increase, due to the sharp development that China is facing.
The Navigator Company already considers this to be a situation of high competition, specially from countries like Brazil, Chile, Uruguay and Indonesia, which already present lower production costs, deteriorating the competitive position of European pulp producers, as stated on its 2017 Report.
Tissue
With graphic paper losing its place in the market, tissue it is building its way to a new era in the pulp and paper industry. In 2017, Navigator registered a recovery in demand, with the sales volume up by 9% y-o-y, mainly due to growth in the tourism sector. Managing an improvement in the mix of sold products and higher prices, due to the pulp price increases, the company registered an increase in the sales value to €74.4 million. With the publication of 2018 final results, it´s observed the expected positive evolution of prices, with a 7.5% increase, not enough to stop the 30% increase in production costs, related to the evolution of hardwood pulp prices, which mainly affected the industrial unit of Vila Velha de Ródão.
Starting its operation in the last quarter of 2018 and, described as “one of the main challenges for 2018”, the new Cacia production mill highly contributed to the 23% increase in tissue sales which, nonetheless, was not sufficient to control the 30% increase in production costs.
Growing demand
The continuous growth of tissue paper market strongly derives from the increase of middle class in emerging markets, which accounts for an increasing concern regarding hygiene matters. With emerging markets accounting for 80% of global growth, China is the first economy to stand out. Accounting for almost half of the tissue market growth in the last ten years, China´s consumption has been growing at an average 8.3% per year, 4% higher than South America, which follows in second place, consuming 6 kg of tissue per capita. In this South region, Brazil and Mexico account for more than 50% of the referred demand.
New global suppliers
Already developing alternatives to pulp, as bamboo, China is already responsible for more than 40% of the tissue market growth, over the last ten years. The CEPI and South American countries only account for a total of, approximately, 29%, as depicted in Figure 25. However, these percentages may already be experiencing a potential decrease or slowing, with the significant trend of pulp integration, already experienced by Navigator.
36% 14% 6% 12% 12% 20% China CEPI Northern America South America Middle East Other Asian Countries Source: CEPI (Accessed in 5th February 2019)
Figure 25. Regional Growth of Tissue
market (2016) China 21% N. America 25% W. Europe 18% L. America 11% Far East Asia 6% Japan 6% E. Europe 6% N&M East 4% Africa 2% Oceania 1%
Figure 24. World Tissue Consumption
Per Region (2016) Source: CEPI (Accessed in 5th February 2019) 6.4 3.6 3.1 2.9 2.2 2 1 0.6 0.5 0.4 0.4 0.3 0.3 Fibria Suzano CMPC APRIL Arauco APP Altri Mitsubishi Marubeni International Paper Navigator Int´l Grand Invest. Corp Koch industries
Figure 23. Hardwood-Pulp Production
Capacity (in million metric tons)
Source: Bloomberg
Global Capacity
Navigator faces powerful Global competitors, as shown in Figure 26. With a total annual production capacity of 135 thousand (70 thousand reels and, 65 thousands of finished product), the company appears as a player with small significance, compared with major players like the Finnish Metsã Tissue (with a capacity of 602 thousand tons) or, the Swedish ESSITY, which has almost 34 times more production capacity than Navigator.
When considering only the Portuguese market, Navigator still falls behind Renova, with a total annual production capacity of 187 thousand. However, with the new tissue expansion in Cacia, it´s expected that the company overcomes Renova, becoming the second largest player in the Iberian market.
Energy
Navigator now has the volume of energy production that allows it to be self-sufficient in its production activities, through units in Setúbal, Figueira da Foz and Cacia, with 69% of renewable energy used in the production of paper and pulp. The surplus is sold out to the national electricity grid, with the energy segment already representing 10% of its volume of sales, corresponding to €127 million. During the year of 2017, these grew by 13% in value, after being adversely affected in 2016 by breakdowns in several of its turbogenerators. More recently, the company already registered a volume of sales of €173 million, with a development in Espirra, of more than 300 photovoltaic solar panels for its own consumption. However, and since 2011, this revenue is exposed to changes regarding regulations and subsidies to renewable energies. Also, the decrease in subsidized prices for plants with a certain time of production, has already affected the plants located in Figueira da Foz and Cacia and, is expected to affect Setúbal´s, in 2020.
Raw material (Wood)
As the main raw material for the production of pulp, wood is one of the main worries for Navigator, who already manages over 110,000 hectares of Eucalyptus in Portuguese territory, 55% under ownership and the remaining under leasing contracts.
However, the forest managed by the company, currently represents less than 20% of Navigator´s needs of eucalyptus wood for BEKP production, which obliges the company to import wood from both the Portuguese and the Spanish market, with more than 50% coming from national territory. Lastly, Navigator also relies on the Latin American market, as seen in Figure 28.
In this struggle to meet its needs, Navigator has to place a higher reliance on imports, dealing with several risks and constraints, as the volatility to which the wood transportation is subject, that will vary depending both on oil prices and sea freight costs. Also, the increasing competitors´ production capacity is leading to higher demand, which is making the raw materials´ prices to go up. Currently, wood is being increasingly affected by the housing sector, the so common natural disasters, as fires and, by all the new regulations regarding forest protection. In 2017, the Portuguese RJAAR suffered a change in its legal rules, leading to a decrease in the permitted eucalyptus area in Portugal which will, as a consequence, lead to a higher need of reliance in wood imports, aggravating the costs needed to maintain Navigator product´s quality.
4550 3817 2770 2737 1370 1150 1020 720 700 650 602 ESSITY K-C APP G-P P&G Hengan Solfidel CMPC Tissue WEPA Kruger Tissue Metsã Tissue
Figure 26. Production capacity of the
major global tissue companies in 2016 (thousand tons)
Source: European Tissue (Accessed in 11th February 2019) 0 200 400 600 800 1000
Cacia Figueira da Foz Setúbal Vilha Velha de Rodão Pulp Paper Tissue
Figure 27. Energy consumption, per
product, per industrial unit (GWh)
Source: Company Data
Iberian Market
Outside the iberian market
Figure 28. Wood Imports
Source: Company Data
14%
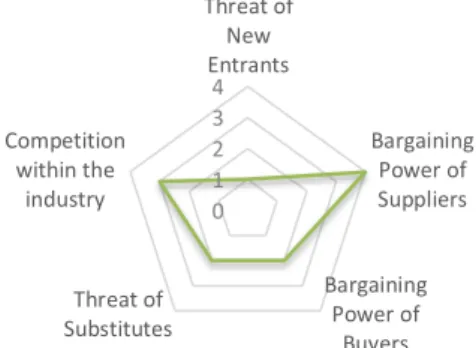
0 1 2 3 4 Threat of New Entrants Bargaining Power of Suppliers Bargaining Power of Buyers Threat of Substitutes Competition within the industry
Figure 29. Porter´s Five Forces
Source: Author Estimates
Competitive Positioning
In order to evaluate Navigator´s competitive positioning, it´s now performed a Porter´s Five Forces Analysis, together with a SWOT analysis.
Porter´s Five Forces Analysis
Threat of new entrants| LOW
In the paper and pulp industry, the level of capital expenditures highly influences how difficult it truly is to penetrate into the industry.
Besides the high initial investment required, one should be aware of the constant need of development, through both maintenance and acquisition of highly expensive machinery, such as pulp mills. In addition to this, it is essential to have the ability to produce, at least the majority of its needed inputs, in order to avoid its natural fluctuation in prices. The entrance of new competitors is considered to be a LOW risk.
Bargaining power of suppliers | HIGH
Any effect from suppliers´ bargaining power will be derived from the possible dependence from Navigator´s main raw material: wood.
Even though the company owns several hectares of its own eucalyptus plantations, combined with other several of rented ones, it is still dependent of the natural needed period for the “rebirth” of new wood, obliging the company to still depend on several suppliers.
As an acquirer of Certified Wood, the supplier range is significantly reduced, leading us to assess the bargaining power of suppliers as HIGH.
Bargaining power of buyers |MEDIUM
Although in an industry with low switching costs, where any customer can find an easy substitute, Navigator is known for its premium quality products, which has allowed it to establish a situation of brand loyalty over the years. We believe that, in a case with few price discrepancies between competitors, any customer will always be tempted to choose Navigator´s products. The bargaining power of buyers is considered to be MEDIUM.
Threat of substitutes | MEDIUM
In a society where the emergence of new technology is constant, with newspapers and books settling on the internet, paper now faces one of its biggest challenges. However, competing with e-mails, e-books and smartphones is not as relevant to the paper industry when it comes to one of its biggest consumers: education. According to a 2018 study from the Academic Reading Format International Study, regarding students´ attitude towards the importance of paper over technology, 69% of all the students from 21 countries (with Portugal included), still prefer paper as their main source for education.
That said, the threat of substitutes is still considered to be MEDIUM, with a clear tendency to rise.
Competition within the industry |MEDIUM/HIGH
Belonging to an industry where prices are often settled through market indexes, Navigator faces intensive and constant competition from its peers. Although, Navigator is able to stand out through its Premium products, already owning 50% market share on its main market of Premium products. This is still well above the approximate 15% of industry´s average, making competition oscillate between MEDIUM and HIGH.
SWOT Analysis
Strengths Weaknesses
-Highly diversified geographic distribution, to 130 countries;
-Pulp integration in production, through a vertical model, leading to advantages and protection over the volatility of market pulp prices;
- Own Research and Development institute; - Strong tissue player.
-Owned forest representing less than 20% of the company´s raw material needs, leading to a higher reliance on imports, with higher costs and volatility; -High exposure to the fall in the demand of UWF paper in the European market, which accounts for more than 60% of its paper revenues.
Opportunities Threats
-Increasing number of emergent markets, with whom hygiene concerns increase, leading to a growing demand for tissue paper;
-New legislation regarding the abusive use of plastic will probably turn consumers´ attention to paper, as paper bags, as an alternative;
-Increasing popularity of renewable energy; -Mozambican economy growth.
-Increasing concern about environmental issues; -New technologies development, leading to a decrease in the use, and consequent demand, for paper;
-Change in trading, forest and energy regulations.
With a € 3.09 target price, representing a 6.8% upside potential to the stock´s market value of € 2.90 at August 3rd, 2019, our recommendation for Navigator
stands at BUY.
As an integrated producer, Navigator is responsible for four different business segments: UWF paper, BEKP pulp, tissue paper, forestry and, energy. The paper segment accounts for 74% of total revenue, which is highly leveraged by the ownership of both the largest certified nursery in Europe and, the largest paper mills, divided trough four different industrial units: Setúbal, Figueira da Foz, Cacia and Vila Velha de Ródão.
5.
Investment Summary
Eastern Europe 7.4 Western Europe 16.6 Latin America 7.3 North America 24.7 Asia 0.9 Middle East 4.3 Africa 0.6Tabke 4. Tissue consumption per person
in 2017 (kg/year)
With almost 70% of its sales rendered to Europe, in 2018YE, including the National market, Navigator is Portugal´s largest exporter, representing a total of 2.40% of all the goods exported and, accounting for 1% of Portugal´s GDP. As main future prospects, the following are considered:
i. Increasing demand of tissue in emerging countries: The decline in demand for traditional graphic paper, is expected to be more than offset by a highly significant growth of tissue paper in markets now emerging (Table 4).
ii. E-commerce as a new reality: With all the mainstream brands and stores moving to e-commerce, creating a dependence on online purchases, a new demand for cardboard packages starts to emerge. The now $ 2.84 billion worth e-commerce (Figure 30), according to Statista latest information available, can be seen as one of the main growth-drivers for the paper industry.
A highly dependent pulp industry
With a total of 38.3 million tons of pulp produced in Europe, 7.2% of which in Portugal, and prices highly impacted by Chinese demand, it is mandatory to understand the present and future of this market. Asia is currently leading the global pulp consumption, totaling 69% of European exports, making it the most significant and fast-growing consumer, establishing a high dependence of Europe from this region.
Valuation methods
In order to compute Navigator´s target price, the discounted cash flow model, complemented with a relative valuation, was used. Through Free Cash Flow to the Firm, a price of € 3.09 was reached, which represents an upside potential of 6.8%.
Risks to price target
It is important to be aware of the several risks to which Navigator is exposed, without the ability to be controlled by the company´s management like market, operational and regulatory risks. In order to build a more trustworthy analysis, a sensitivity analysis was performed, in order to access the impact of changes in the WACC rate and in the Terminal Growth Rate. Target price will then only suffer a possible increase in the case of a combination between lower WACC with a higher terminal growth rate.
DCF Approach: Free Cash Flow to the Firm
Navigator is first valued through the Discounted Cash Flow Approach (“DCF”) (Appendix 11), allowing the determination of the total value of the firm to all investors. Enterprise value was then determined and adjusted for Net debt, leading us to a final equity value.
Through our analysis, we arrived to a price target of € 3.09, thus representing an upside potential of 6.8%, when compared to the market price of 2.90 € on August 3rd, 2019. 6.
Valuation
1.000 2.000 3.000 4.000 5.000Figure 30. E-commerce global sales
($ Billions)
This method is then influenced by several critical factors:
1. CAPEX and D&A
As a company known for consecutive expansions in the last few years, Navigator now intends to only spend a maximum of € 200 million in capital expenditures, until the year 2022. For a matter of simplicity, an equal yearly value of € 50 million was considered, assuming that a total of € 10 million will always be related to the Mozambique project (according to Navigator´s available information).
As to depreciation and amortization, are settled as a stable percentage of operating expenses, due to steady past values. A percentage of 9.8% is then considered.
2. WACC assumptions
With FCFF being discounted at the weighted cost of capital (“WACC”), several assumptions must be settled, as carefully detailed on Appendix 11.
- Cost of Equity (rE)
Computed trough the Capital Asset Pricing Model (CAPM), a final 10.4% cost of equity was considered. Regarding the Risk-free rate (“RFR”), a 0.086% rate was considered, as the 10Y german government bund in 18th March of 2019, the
date of this analysis. As for the Market Risk Premium (“MRP”), Damodaran´s calculations were considerable suitable, being a rate of 9.02% settled for this parameter. Based on this, a Country Risk Premium (“CRP”) of 3.06%, centered on Damodaran´s calculations for Portuguese Default Swaps, which take into account the risk of bankruptcy, totaling an Equity Risk Premium (“ERP”) of 12.08%.
Lastly, to obtain Beta (𝛽), representative of the company´s systematic risk, a linear regression was performed, using Microsoft Excel, between Eurostoxx 600 and Navigator´s daily stock prices, arriving to a value of 1.14.
- Cost of Debt (rd)
As another key element of the WACC rate, an after-tax cost of debt of 1.8% was settled, based on several other assumptions (Table 5). Cost of debt was based on an average of past years´ relation between interest paid on borrowings and, interest bearing liabilities, leading us to a 2.49% rate. A Marginal Tax Rate was computed, through the sum of the Portuguese General Tax Rate with an additional Municipal Surcharge for Setúbal´s district was considered, as the location of Navigator´s headquarters. Finally, an Effective Tax Rate of 28.87% was extracted for Damodaran´s January 2019 calculations, for the paper and forest industry products.
3. Terminal Value
Operating under full capacity, Navigator is considered to follow the Portuguese Inflation rate, with a terminal growth rate (“g”) of 1,30% being assumed. Terminal value was then computed, arriving to a final value close to €2 billion after discount.
Cost of Equity
Risk-free rate (“RFR”) 0.086% Country risk premium (“CRP”) 3.06% Market risk premium (“MRP”) 9.02% Beta 1.14 Cost of Equity (rE) 10.4%
Cost of Debt
Cost of debt (rD) 2.49%
Effective tax rate 28.87% Marginal tax rate 21.5% After tax cost of debt 1.8%
Capital Structure
Debt to value 36.26% Equity to value 63.74%
Terminal Value
Terminal growth rate (g) 1.30%
Table 5. WACC Assumptions
65.3% 62.5% 63.5% 59.2% 60.8% 63.7% 34.7% 37.5% 36.5% 40.8% 39.2% 36.3% 2014 2015 2016 2017 2018 Forecast Equity Debt
Figure 31. Capital Structure
Source: Company Data and Author´s Estimates
Relative Valuation Approach (Multiple Valuation)
In order to better understand Navigator´s performance within the industry, and how it can be compared with competitors, a comparable analysis was performed. For the selection of Navigator´s peer companies, a 3-stage process was conducted in which, for one company to be considered a suitable peer, it must fulfill three requirements. (Appendix 10)
1. Be a paper producer – With paper being the most significant segment for Navigator, a suitable peer, must not have its production activity highly limited to pulp or any other product.
2. Pulp share < 25% – To mainly consider integrated pulp producers, that only sell a small remaining quantity of pulp to the market.
3. Paper market > 30% – With paper representing over 70% of Navigator´s business, a suitable peer must have a significant share of its own business dedicated to paper.
When analyzing 10 paper industry company´s, and considering the referred requirements, 4 peers were selected: Stora Enso (Finland), Mondi (Austria), Svenska Cellulosa (Sweden) and Metsa Board Oyj (Finland). From the selected peers, it is important to mention the higher multiple valuation that tissue producers are subject to, mainly due to a fast market expansion, as in the case of Svenska and Metsa (Appendix 10).
On a general note, Navigator´s multiples are relatively close the ones from its peers, which lead us to conclude that Navigator is similarly valued relatively to its peers.
To complement the DCF analysis, several ratios were then considered: EV/Sales, EV/EBITDA, Net debt/EBITDA and P/E.
It is, although, important to consider the diminished accuracy provided by EV/EBITDA, due to its interval amplitude.
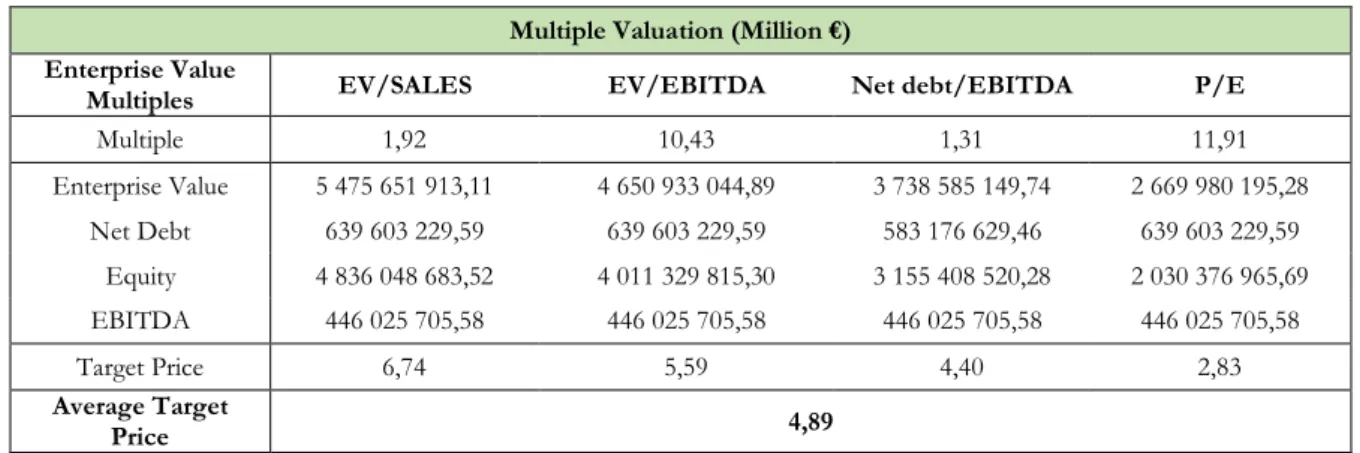
Multiple Valuation (Million €) Enterprise Value
Multiples EV/SALES EV/EBITDA Net debt/EBITDA P/E
Multiple 1,92 10,43 1,31 11,91 Enterprise Value 5 475 651 913,11 4 650 933 044,89 3 738 585 149,74 2 669 980 195,28 Net Debt 639 603 229,59 639 603 229,59 583 176 629,46 639 603 229,59 Equity 4 836 048 683,52 4 011 329 815,30 3 155 408 520,28 2 030 376 965,69 EBITDA 446 025 705,58 446 025 705,58 446 025 705,58 446 025 705,58 Target Price 6,74 5,59 4,40 2,83 Average Target Price 4,89 Paper producer? Pulp share < 25% Paper Share > 30% International Paper Stora Enso UPM CMPC Mondi Altri Ence Fibria Svenska Cellulosa Metsa Board Oyj
EV/SALES EV/EBITDA Net debt/EBITDA P/E
Peers Mean 1,92 10,43 1,31 11,91
Navigator 1,66 6,41 1,43 10,69
Table 6. Peers´ Selection
Source: Author Estimates
Table 7. Navigator and Peers comparison
Source: Author Estimates
The average target price, derived from the four ratios average, stands at a value of €4.89, above the € 3.09 from our previous estimation and, above the market value of € 2.90, registered on August 3rd, 2019. This then reinforces our
conclusion that Navigator is undervalued.
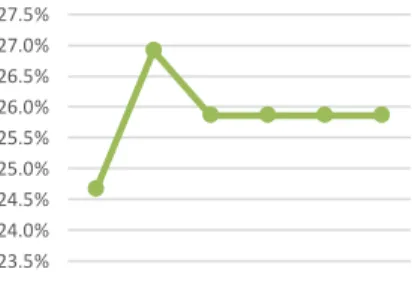
In the end of 2018, Navigator announced a never before registered EBITDA of € 455.2 million, that comprised a 12.8% increase relatively to the previous year. Although, if non-recurrent impacts were to be excluded, EBITDA would have stand at a value of € 461 million. This includes, all in 2018, the sale of the pellets business, in the USA and, the settling of new anti-dumping taxes for paper sales in America, comprised in the period between Augusto 2015 and February 2017 (initially settled at 37.74% and, then reduced to 1.75%).
An EBITDA Margin of 26.9% was then reached (Figure 32), mainly due to the recently established cost reduction program (M2), which positively contributed to EBITDA, in the amount of € 21 million.
As to the company´s variable costs, a negative evolution of the price of chemical products highly affected the production costs of pulp and, consequently, paper and tissue. In addition to this, an increase in the costs of fiber was also registered, adding a total of € 14 million to this segment.
In recent years, when looking to the fixed costs, an increase of €9.2 million in payroll costs can be immediately identified. This is mainly related to the increased number of needed employees for the new tissue facilities and the hiring of youthful employees, according to new goals established.
Responsible for generating a free cash flow of € 211.1 million in 2018YE, mainly supported by the company´s good operational performance, Navigator still saw its cash flows limited by the high level of CAPEX (€ 216.5 million) registered, connected with the construction of the new tissue factory in Cacia and, the expansion of the Figueira da Foz industrial complex.
With Net Debt registering a € 381 million increase from 2014 to 2015, the first two years of our analysis, this immediately becomes a relevant parameter for a deeper scrutiny. First, it is important to assign this massive increase to the issuance of new commercial paper, in order to finance both investments and dividend payments. As in 2018YE, Net Debt to Equity stood at 58%, relatively centered when comparing to industry´s average of 190% (Figure 34). Even belonging to a highly capital-intensive industry, the decreasing investment needs, are now expected to, according to author estimates, decrease to 48% in 2019 and, 45% in 2020. 7.
Financial Analysis
190.00% 137.00% 24.00% 3.00% 56.00% 40.00% 18.00% 24.60% 58.00% Industry Average International Paper Stora Enso UPM Mondi Ence Svenska Cellulosa Metsa board NavigatorFigure 34. Industry´s Net Debt to Equity
(2018)
Source: Companies data
23.5% 24.0% 24.5% 25.0% 25.5% 26.0% 26.5% 27.0% 27.5% 2017 2018 2019 2020 2021 2022
Figure 32. EBITDA Margin
Source: Company data and Author estimates 50,000,000.00 100,000,000.00 150,000,000.00 200,000,000.00 250,000,000.00
Figure 33. Company’s CAPEX Evolution
Source: Company data and Author estimates
Exchange Rate Risk (ER)
Even though Europe represents more than half of Navigator´s source of revenues, most of its prices, in Euros (“EUR”), are settled through international indexes, in United States Dollars (“USD”). Exchange rate volatility between USD and EUR will then affect the company.
In addition to this, any foreign investor is under the risk of an increase in the respective exchange rate, leading to decrease in the value of his owned shares.
BHKP Pulp price (BP)
Navigator depends highly on national forests, as a way to obtain its main input, wood. Any possible natural disaster or, man-made fire will most likely influence the level of revenues and costs of the company. This lower availability of wood could oblige Navigator to depend mostly on raw material imports, with new possible risks of transportation costs and exchanges rates.
Wood price (WP)
Besides having its own Eucalyptus plantations (both owned and leased), these still represent less than 20% of Navigator´s needs when it comes to wood for the production of paper pulp. Any unexpected change on wood´s transaction price will immediately affect Navigator´s production costs.
Wood demand (WD)
As pointed out by the Company on its 2018 Report, the global expansion of several competitor’s capacity, with a consequent increase in demand, will trigger an increase in wood prices.
This price increase will lead companies like Navigator, who highly depend on raw material imports, to an increase in production costs that can highly affect its revenues.
Paper substitution (PS)
In a world where new technology seems to emerge every day, traditional forms of communication tend to be left behind. E-mail and e-books are just two of the main substitutes for Navigator´s main product: paper. Accounting for 74% of revenue, any substitution for technologies will account as a reduction in the company´s sales.
Forest destruction (FD)
With more than half of the raw materials required coming from national forests, any damage resulting from either natural or man-made causes, might elevate the incurred costs, with a consequent decrease in revenues.
Specifically, Navigator faced in 2018, the devastating effects of Hurricane Leslie on its Figueira da Foz complex, which led to long stoppages in production, with fewer quantities being produced, directly affecting that year´s revenues.
Energy Sector Regulation (ESR)
In an economy increasingly controlled by regulations, the unpredictability of new regulation might reveal itself as a reasonable explanation for a decrease in energy sector´s competitive terms. This may create a loss in one of the company´s sectors of revenue.
Mozambique country risk (MZ)
Due to the company´s involvement in an extensive forest investment in Mozambique, through Portucel Moçambique, Navigator is highly dependent on possible changes in regulations and taxes in the country. In a slow recovery from 2016 debt crisis, Mozambique´s GDP is expected to grow 4% in 2019, with debt levels remaining significantly high.
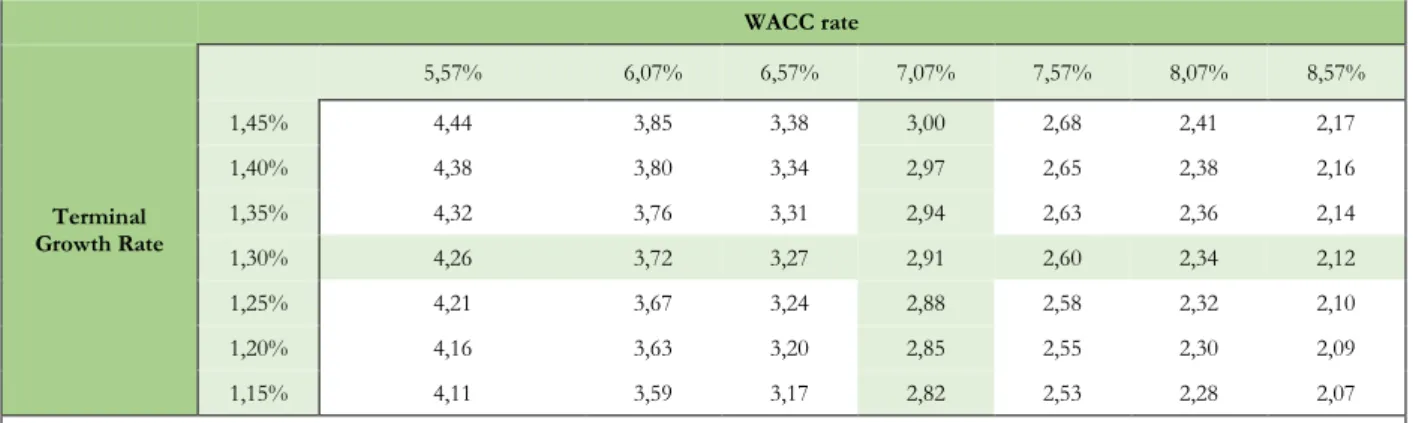
Sensitivity Analysis
In order to better assess additional risks to which Navigator is subject to, a sensitivity analysis was performed.
First, and due to the heavy weight of Terminal Value in Enterprise Value (81.63%), it was considered to be highly relevant an analysis of possible impacts that changes in the WACC rate, together with changes in the terminal growth rate, might bring to share price. Additionally, the WACC rate is dependent on several variables, such as cost of equity, that can be really volatile over time.
WACC rate Terminal Growth Rate 3,09 5,57% 6,07% 6,57% 7,07% 7,57% 8,07% 8,57% 1,45% 4,44 3,85 3,38 3,00 2,68 2,41 2,17 1,40% 4,38 3,80 3,34 2,97 2,65 2,38 2,16 1,35% 4,32 3,76 3,31 2,94 2,63 2,36 2,14 1,30% 4,26 3,72 3,27 2,91 2,60 2,34 2,12 1,25% 4,21 3,67 3,24 2,88 2,58 2,32 2,10 1,20% 4,16 3,63 3,20 2,85 2,55 2,30 2,09 1,15% 4,11 3,59 3,17 2,82 2,53 2,28 2,07
Source: Author Estimates
From the analysis conducted, we can conclude that, a variation of 0.05% in the WACC rate will have an impact of 9.7% on Navigator´s target price. Only the combination of a lower WACC with a higher terminal growth rate, will lead to a share price increase.
Table 9. WACC and Terminal Growth Rate Analysis
Appendix
Appendix 1: Statement of Financial Position
Appendix 3: Cash Flow Statement
Appendix 5: Common-Size Statement of Financial Position
Appendix 7: Sales breakdown analysis
Appendix 8: Forecasting Assumptions
Statement of Financial Position Assumptions
Appendix 9: Comparable companies Possible peer’s data
Peer selection:
Selection criteria:
1. Be a paper producer – With paper being the most significant segment for Navigator, a suitable peer, must not have its production activity highly limited to pulp.
2. Pulp share < 25% – To mainly consider integrated pulp producers, that only sell a small remaining quantity of pulp to the market.
3. Paper market > 30% – With paper representing over 70% of Navigator´s business, a suitable peer must have a significant share of its own business connected to paper.
Appendix 10: Multiples Valuation Navigator and Peers Multiples (2018YE)
Paper producer? Pulp share < 25% Paper Share > 30% International Paper Stora Enso UPM CMPC Mondi Altri Ence Fibria Svenska Cellulosa