SOCIOECONOMIC INTEGRATION, AND AMALGAMATION How far have they advanced?
Dulce Maria Scott
Introduction
Utilizing data from Censuses 1980, 1990, and 2000, the 2005 and 2006 American Community Surveys, and the 2006 Yearbook of Immigration Statistics, this paper analyzes the acculturation, socioeconomic integration, and amalgamation trends of Portuguese immigrants and their descendents in the United States. In order to draw more informed conclusions about the Portuguese experience along these three dimensions of assimilation, I compare it to those of other immigrant groups in the United States, including the Irish, the Italian, the Greek, and the Brazilians. I selected these groups based on the time when they first began to arrive in the Uni-ted States — the Irish first, followed by the Italians, the Portuguese and the Greeks, and later the Brazilians.
The United States gained its independence in 1776, but it was not until the 1820s that immigration from Europe began to occur in large numbers. Until about the middle of the 19th century, immigrants originated primarily in Germany and Ireland. In the second half of the 19th century the source of immigration changed from northern Europe to Southern and Eastern Europe. The largest immigrant group arriving at this time was from Italy. This pattern of immigration from Europe continued until the 1920s, when immigration restrictions were put in place with the National Origins Act. Under this law, immigration to the United States was gre-atly reduced until the Immigration Act of 1965, which opened immigration to all countries in the world and established a system of preferences based on family reu-nification and the labor needs of the United States, among other factors. Today, the largest ancestry group in the United States is still German (although it declined from 23% to 15.2% of the total population from 1990 to 2000), followed by Irish, African-American, and then English (see figure 1). The Portuguese, at 0.5% of the total U.S. population in 1990, were listed as the 29th largest ancestry group in the United States.
Figures 2 and 3 show the immigration patterns of the Irish, Italians, Greeks, Portuguese, and Brazilians. Immigration from Ireland and Italy (figure 2) occurred in much larger numbers (in millions) than from the other three countries in figure 3 (in thousands). Immigration from Ireland and Italy continued after the 1920s, but in much smaller numbers. Immigration from both Greece and Portugal has followed si-milar patterns. Each has experienced two waves of immigration, the first wave at the turn of the 20th century and the second wave starting in the 1950s. Although a subs-tantially larger number of Greek immigrants arrived in the late 19th and early 20th centuries than did Portuguese, the immigration levels of the two groups are nearly
identical in the second wave of immigration. In the 19th century, Brazilian immigra-tion to the United States was negligible, and records of immigraimmigra-tion from this country do not appear in the United Sates Census until the 1910s.
Table 1 shows changes from 1990 to 2000 in the number and percent of people who claimed ancestry in the countries considered in this paper. There is a sizeable decline in the population of Irish ancestry, and while the other three European an-cestries are still growing, each has experienced a small decline in their share of the total United States population. The number of people claiming Brazilian ancestry has been growing rapidly since the 1990s.
0 5 10 15 20 25 30 35 40 45
Swedish Scotch-Iris NorwegianDutch Scottish American IndianFrench PolishItalian Mexican AmericanEnglish African AmericanIrish German
Figure 1 Fifteen largest ancestry groups in the United States
Source: U. S. Census Bureau, Census 2000 special tabulation (in millions; percent of total population in parenthesis). 0 500.000 1.000.000 1.500.000 2.000.000 2.500.000 Italy Ireland 1820/ 1829 1830/1839 1840/1849 1850/1859 18691860/1870/18791880/18891890/1899 1900/190919191910/1920/1929 1930/1939 1940/19491950/19591960/1969 1970/1979 1980/1989 1990/1999 2000/2009
Figure 2 Immigration timeline: Italy and Ireland
In the sections below, I first examine theoretical developments in the study of immigrant settlement in the United States, followed by a comparative analysis of various socioeconomic indicators.
Theoretical background
The sociological study of immigrant settlement in America began in earnest in the 1920s with the Chicago School of Sociology, which developed a series of methodo-logical and theoretical tools to study the settlement patterns of the many immi-grant groups that had been settling in that city. The abrupt decline in immigration, following the enactment of the National Origins Act in the early 1920s, led to a de-marcation between the immigrant generations and the American born generati-ons, the latter of which increasingly became distant from their immigrant ancestry
0 500.000 1.000.000 1.500.000 2.000.000 2.500.000 1820/ 1829 1830/1839 1840/1849 1850/1859 18691860/1870/1879 1880/18891890/1899 1900/190919191910/1920/1929 1930/1939 1940/19491950/19591960/1969 1970/1979 1980/1989 1990/1999 2000/2009 Brazil Portugal Greece
Figure 3 Immigration timeline: Brazil, Portugal and Greece
Source: Office of Immigration Statistics, 2006 Yearbook of Immigrant Statistics.
Country of
ancestry 1990 2000 Change 1990 to 2000
Number % of total
population Number population% of total Numericalchange % change
U.S. 248,709,873 100.0 281,421,906 100.0 32,712,033 13.2 Brazil 65,875 0.03 181,076 0.1 115,201 174.9 Portugal 1,148,857 0.5 1,173,691 0.4 24,834 2.2 Greece 1,110,292 0.4 1,153,295 0.4 43,003 3.9 Italy 14,664,189 5.9 15,638,348 5.6 974,159 6.6 Ireland 38,735,539 15.6 30,524,799 10.8 -8,210,740 -21.2
Source: U.S. Census Bureau, Census 2000 Summary File 3 and 1990 special tabulation.
(Waters and Jiménez, 2005). This demarcation impacted the conceptualization of assimilation, which culminated in 1964, with Milton Gordon’s formulation of what has come to be known as classical assimilation theory. In his work, Gordon also de-veloped the concept of pluralism, which had been around since the early 20th century.
Classical assimilation theory postulated a “unified economy in which immi-grants started at the bottom and gradually moved up occupationally as they gai-ned social acceptance” (Wilson and Portes, 1980: 295). This process, composed of various stages of increasing assimilation, generally was completed within three ge-nerations. In the American popular imagination, the assimilation ideal was framed by the “melting pot” metaphor introduced by Israel Zangwill’s play in 1908.
Classical assimilation theory has been criticized for its failure to take into con-sideration “internal colonialism” (Blauner, 1982), or the “blocked mobility” experi-enced by exploited minority ethnic groups that have been prevented from assimi-lating due to racism, discrimination and segregation.1Further, by postulating a
li-near and irreversible progression towards assimilation, the theory could not ac-count for instances when the process occurs in a non-linear fashion or when a re-versal in stages of assimilation takes place. For example, immigrants who arrive with high educational and skill levels may attain high paying positions within the primary sector of the economy without first experiencing cultural or social assimi-lation. With the rise of immigration from Mexico, second, third, and higher genera-tion Mexican Americans have been known to increase their level of identificagenera-tion with Hispanic culture and organizational life (Waters and Jiménez, 2005: 220), and this may be considered a reversal of assimilation. Assimilation theory additionally could not explain the creation of economically successful ethnic communities which remain culturally and economically distinct from the larger host society, as was the case of Jews in Europe who remained involved in middlemen activities (Bonacich, 1973; Turner and Bonacich, 1980) or the case of the Cubans in Miami who formed a separate, highly successful economic enclave in that city (Wilson and Portes, 1980; Portes and Shafer, 2007).
With the need to affirm the experiences of America’s historically excluded mi-nority groups, such as African Americans and Native Americans, during the civil rights movement, the concept of assimilation was rejected in favor of the ideal of cultural pluralism. Ethnicity became a highly politicized issue, eventually evol-ving into what has been dubbed “identity politics”.
In opposition to assimilation, the concept of cultural pluralism was introdu-ced in 1916 by sociologist Horace Kallen (cited in Salins, 1997: 21), who argued that rather than assimilating immigrants should hold steadfast to their cultural herita-ge and remain a unified social and political bloc. The concept of cultural pluralism, however, did not fit an American reality where immigrant and minority ethnic groups become committed to America’s national project and integrate into its
1 For a more complete overview of the debates and polemics surrounding the concepts of assimi-lation and pluralism, see Gleason, 1992.
mainstream institutions. With “assimilation” becoming a “dirty word”, the term integration was adopted in the public arena to refer to a process where immigrant and minority ethnic groups integrate into the educational, economic, and political institutions of the dominant group while maintaining their cultural distinctive-ness. Later, the term incorporation would also come to be widely used among scholars.
Classical assimilation theory postulated that each successive generation would experience upward mobility, particularly as the level of education among the descendents of immigrants increased. After the civil rights movement and the outlawing of individual discrimination, the expectation was that America’s histori-cally excluded minority groups, as well as new immigrants, would undergo a pro-cess of socioeconomic integration, similar to that experienced by the 19th and early 20th century immigrants.
This notion would be questioned by scholars studying poverty in the United States; their findings led sociologists to the split or segmented labor market con-cept (see Bonacich, 1972, among others), which later, in combination with the noti-on of the dual ecnoti-onomy (Averitt, 1968, and Galbraith, 1971), crystallized in the cnoti-on- con-cept of the dual labor market (see Wilson and Portes, 1980). The primary sector is composed of large scale firms, research institutions, hospitals, and public and pri-vate universities. The secondary sector, which affects many members of ethnic and minority groups, provides unstable, sometimes informal, low wage employment.
In his seminal work, Julius Wilson (1980, 1987, and 1996) added great insights into the understanding of race and ethnicity in America. This scholar argued that the upward mobility experienced by the descendants of old European immigrants was grounded on the first generations’ access to stable, well-paid, low skill em-ployment in the industrial sector of the American economy. Wilson noted that the economic, social class and normative structures of American society were chan-ging radically due to movement of capital abroad and into the suburbs, as well as the exodus of the middle class from inner city areas. Wilson claimed that poor Afri-can AmeriAfri-cans and America’s current racially and culturally diverse immigrants settling in America’s inner cities — with access only to low-paid, unstable jobs — would no longer have the capacity to launch their descendents on a path of interge-nerational upward mobility. A “permanent underclass”, composed primarily of poor African Americans and some of the new immigrants, had become a reality in America.2
Subsequent to Wilson’s work, and taking into account the continuation of ra-cial discrimination, the growth of an inner-city marginalized population, and ri-sing inequality within the context of America’s dual labor market, the notions of “segmented assimilation” and “downward assimilation” emerged. Portes, Fer-nández-Kelly and Haller (2005: 1004) write: “For if it is true that most descendants
2 Wilson argued that after WWII, middle class blacks were able to take advantage of the break-down of racial barriers and experienced significant upward mobility. Lower class blacks, on the other hand, were not able to take advantage of expanding opportunities, and in fact, their class position deteriorated, generating a growing bifurcation in the African American class structure.
of today’s immigrants will eventually assimilate to American society, it still makes a great deal of difference whether they do so by ascending into the ranks of a pros-perous middle class or join in large numbers the ranks of a racialized, permanently impoverished population at the bottom of society. ” Studies (cited in Portes, Fer-nández-Kelly and Haller, 2005) have demonstrated the existence of downward mobility, whereby the first American born generation, and of those arriving at a young age, perform less well than their parents across various educational, econo-mic and health indicators. Portes (2006: 502) writes, the
increasingly bifurcated economy creates the fundamental structural context for segmen-ted assimilation. How could it be otherwise? Offspring of well-paid, well-informed pro-fessionals and entrepreneurs, properly supported by coethnic networks that deliver multiple resources, have opportunities that are immensely superior to those of labor mi-grants with barely an elementary education and no papers.
The notion of segmented assimilation fits well with the seminal work of Portes and his associates on migrant modes of incorporation (Portes and Böröcz, 1989; Portes and Rumbaut, 2006). The type of assimilation experienced by the second generati-on) depends on human and social capital, family structure, and the mode of incor-poration of the immigrant generation (Portes, Fernández-Kelly and Haller, 2005: 1011). Portes and his associates, arguing that there are different types and paths to assimilation, reject the classical assimilation theory assumption of a unified and ir-reversible assimilation path. According to Portes and Zhou (1993: 82), there are three patterns of adaptation for immigrants and their children. “One of them repli-cates the time-honored portrayal of growing acculturation and parallel integration into the white middle-class; a second leads straight into the opposite direction to permanent poverty and assimilation into the underclass; still a third associates ra-pid economic advancement with deliberate preservation of the immigrant commu-nity’s values and tight solidarity. ” They also reject the traditional framing of immi-gration in the “push/pull” factors principle of poverty in one country leading to a rational choice decision to move to a country with more opportunities. As framed in the modes of incorporation model, the reasons for leaving, the characteristics of those leaving, the manner of entrance into the host society (legally or illegally), and the context of reception are all factors that have made migration a much more mul-tifaceted process in today’s world, with varied consequences for the American born generations.3
Asomewhat related concept, the “ethnicity paradox”, addresses how the ma-intenance of ethnicity (and thus pluralism) can actually be a step that facilitates as-similation (see Lal, 1995). Groups that initially close ranks and create dense ethnic
3 More recently, two new concepts have emerged in the international migration literature: trans-national entrepreneurship (e.g., Portes, Heller and Guarnizo, 2002), and transtrans-national political action (e.g., Guarnizo, Portes and Heller, 2003). The involvement of Portuguese Americans in ethnic and transnational business and their engagement in politics in the country of origin are topics that merit investigation.
networks and institutions that replicate the ethnic culture and support the econo-mic activities of group members will be better able to instill the goals of success and provide opportunities for advancement, and thus assimilation, of the second gene-ration. Studies (cited in Portes, Fernández-Kelly and Haller, 2005) have shown that children who are grounded in strong ethnic communities perform better academi-cally than those who feel disconnected or annihilated from their ethnicity. Portes and Rumbaut (2006) also address the notions of generational dissonant and conso-nant acculturation. Upward assimilation is more likely to occur when consoconso-nant acculturation of parents and children occurs, with the later being able to lean on the moral and normative strength of the immigrant community as a shield against the oppositional culture found in America’s inner cities (Zhou, 1997: 995).
Does the concept of segmented assimilation apply to Portuguese Americans? The experience of Portuguese immigration and settlement approximates that of some of the earlier European immigrant groups, with incorporation into traditio-nal entry level blue collar occupations in America’s industrial sector, at least until the event of massive deindustrialization in the 1980s. Further, within the current construction of race in America, the Portuguese are considered to be white and as such do not face racial barriers as they integrate socially, economically and biologi-cally into American society. The American born descendents of Portuguese Ameri-cans, and immigrants arriving today, however, encounter a dual labor market structure. To what extent did the first generation’s access to stable employment in the industrial sector of the American economy, aided by strong normative and fa-mily structures within the immigrant communities, launch the American born ge-nerations on a path of upward mobility? Although I will address this question to some extent at the group level below, it would be interesting to conduct an in-depth study, using the individual as the unit of analysis, of the extent to which assimilati-on is occurring in an upward or downward manner for the children and grandchil-dren of the post-1960s immigrants.
A major debate currently taking place in American sociological circles revol-ves around the question of whether the experience of incorporation of today’s im-migrants into American society can be understood implicitly and explicitly as a process essentially similar to that of the 1880-1920 immigrants. While Portes and his associates argue that the study of the new immigrants’incorporation into Ame-rica requires a new set of analytical tools (see Portes, Fernández-Kelly and Haller, 2005), other scholars have argued that “nothing has changed, ” that the immigrants of today are “just like the immigrants of yesterday” (Alba and Nee, 2003; Perlmann, 2005; Waldinger and Perlmann, 1998, among others).
Despite its fall into disrepute, assimilation theory has been resurging in re-cent years, with the work of scholars such as Barkan (1995), and Alba and Nee (2003), among others. Barkan introduced a six stage assimilation model, and Alba (1995), dismissing some of the aspects of Barkan’s model, later developed, in collaboration with Nee, a reconceptualization of assimilation, The Remaking
of America’s Mainstream (2003). Conceptualizing assimilation as a blurring of
ethnic boundaries, Alba and Nee reject the classical notion of assimilation as “Anglo-conformity” and emphasize the contributions of newcomers to the
on-going construction of the American mainstream. These scholars provide a comprehensive reinterpretation of America’s immigration history based on their reconceptualization of the theory.
Other scholars have also questioned existing “canonical” interpretations of how assimilation occurred for the old immigrants. Waldinger (2007) criticizes the segmented assimilation theory’s assumptions of a unified assimilation path for the old second generation and of a fortuitous timing of immigrant incorporation into an expanding factory system between 1930 and 1970, not available to today’s wor-king and lower class immigrants. This scholar argues that like the children of to-day’s immigrants, the children of the turn of the 20th century immigrants experien-ced multiple paths towards assimilation. A deeper analysis of 1970 census data de-monstrates that the children of Italian immigrants, for example, did not engage to a great extent in factory work. “Today’s children of working-class immigrant parents
may suffer as the result of the erosion of well-paid manufacturing jobs; but they
may also take a trajectory similar to the Italians, who moved ahead without relying on the factory sector” (Waldinger 2007: 33). Based on census data related to the em-ployment patterns of Mexican American youth, Waldinger and Feliciano (2004), question the notion that children of the working class immigrants of today are ex-periencing downward assimilation into a “rainbow underclass”. According to the-se scholars (2004: 395), “the evidence… suggests that the experience of today’s the- se-cond generation is consistent with the earlier pattern, in which the children of im-migrants progressed by moving ahead within the working class”.
Notwithstanding current debates, the concept of assimilation, with its vari-ous dimensions — acculturation, primary and secondary structural assimilation, amalgamation, and psychological assimilation — remains useful for the unders-tanding of immigrant incorporation into American society. Structural assimilation has been conceived as having two facets: primary and secondary structural assimi-lation. Primary structural assimilation occurs when newcomers begin to engage in intimate, small group social interaction with individuals from the dominant group, such as in clubs, parties, family gatherings, and so on. Secondary structural assimilation occurs when ethnic group members become integrated into the large, impersonal societal groups in the educational, economic and political institutions of the larger society. The psychological dimension of assimilation cannot be measu-red directly with census data. At this stage of assimilation, individuals see themsel-ves, and are identified by others, as Americans rather than as members of a specific ethnic group. Descendents of the original ethnic groups may retain some memory of their ancestry, but they no longer identify with it and no longer participate in the group’s social and organizational life. Generally, this step is not taken by individu-als of the immigrant generation, who despite possibly participating fully in the new society, remain culturally, institutionally and psychologically identified with the society of origin. On the other hand, some individuals may be psychologically assimilated without having achieved socioeconomic integration. This would be the case of individuals from traditionally excluded minorities, who despite consi-dering themselves — and being considered by others — Americans, still live at the margins of society.
Assimilation is essentially a process that individuals and their families go through, but at the same time it is not divorced from processes that affect the entire ethnic group, such as public policies and reception contexts, that either encourage or impede assimilation. Assimilation and pluralism are processes that can exist si-multaneously at a societal, group, and individual level. While some group mem-bers, perhaps as a result of pursuing higher education, become highly integrated, others, never becoming fluent in the host country’s language, may remain highly dependent on the ethnic community to survive in the adopted society. Others may be assimilated in some areas of social life but not in others. Assimilation can be a bi-directional process, whereby the immigrants adopt the culture of the host society but members of the dominant group also take on some of the customs and traditi-ons of the immigrant group.
The indicators of assimilation — suitable for analysis of census data — utili-zed in recent studies are: (1) spatial concentration, i. e., dissimilarity in spatial dis-tribution and suburbanization as a measures of cultural and primary and secon-dary structural assimilation; (2) English language ability and loss of the mother tongue as an indicator of acculturation; (3) socioeconomic status, i.e., education, occupation, and income, as a measure of secondary structural assimilation; (4) and intermarriage as an indicator of amalgamation (Waters and Jiménez, 2005). I will use an additional indicator of structural assimilation, that of citizenship rates among the foreign born.
In the following section of this paper, using official data and statistics, I first examine the geographical concentration by state of Portuguese immigrants to de-termine the extent to which population concentration or dispersion, at the state le-vel, is occurring. Then, I examine how the foreign born Portuguese Americans and those of Portuguese ancestry have progressed along various dimensions of assimi-lation in comparison with Brazilian, Greek, Italian, and Irish foreign born and an-cestry groups. For the foreign born population, I have access to data on the selected demographic and socioeconomic indicators from Census 2000. For the entire an-cestry group, including the foreign born and those born in the United States, I use data from the 2005 and 2006 American Community Surveys. It is important to note that the census data accounts only for the people who were alive when the census was taken.
Geographical concentration
Spatial concentration influences the extent and the rate at which assimilation takes place. Where spatial concentration exists, the critical mass needed to maintain a more or less separate ethnic pluralistic culture, and in some cases a distinct econo-mic enclave, is present.4The model of “spatial assimilation”, developed by Massey
(1985), elaborates on the connection between dispersal of ethnic populations and cultural and economic assimilation. Immigrants may settle together initially for mutual support, but they and their children will eventually disperse, following si-milar patterns of spatial mobility as those exhibited by the majority population.
The concept of spatial assimilation has been criticized by Portes and Rumbaut (2006: 60), who point out that even for older immigrant groups, who are well assi-milated, this dispersion has not occurred to as large a degree as that postulated by the theory, since there are still geographical areas where the descendents of 19th and early 20th century immigrants remain concentrated. This is perhaps due to the political, economic and psychological advantages that can be gained as a result of spatial concentration, even for American born generations, for after all “there is strength in numbers” (Portes and Rumbaut, 2006: 60). Geographical concentration, however, does not prevent assimilation.
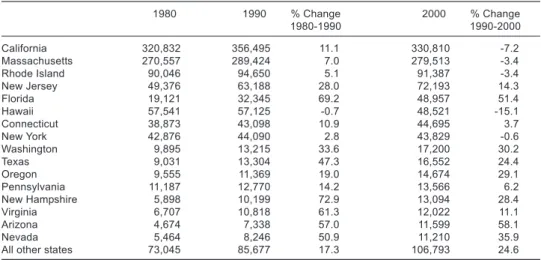
To examine the level of concentration and dispersion at the state level of the population of Portuguese ancestry, I use data from the 1980, 1990, and the 2000 cen-suses. In table 2, I list the states with more than 10,000 people in 2000. Due to space limitations, I chose not to include comparative data on population concentration by state for the other ethnic groups included in this paper.
Remarkably, there are people of Portuguese ancestry in all fifty states, but the data in table 2 indicate that the Portuguese continue to live in states of high ethnic concentration, with California, Massachusetts, Rhode Island, and New Jersey ha-ving the highest population levels. Simultaneously, there is a movement away from the traditional areas of settlement. This movement is similar to that exhibited by Americans in general. The greatest movement has been to Florida, to where the aging immigrant population has been retiring. Southern and southwestern states, like Texas, Nevada, and Arizona, have experienced sizeable increases in the popu-lation of Portuguese ancestry and so have two northwestern states, Oregon and Washington. The Portuguese are moving to these states perhaps in search of better employment opportunities and in some states better climatic conditions. Additio-nally, there has been movement to New Hampshire, perhaps away from Massa-chusetts. New Jersey is the only state where the Portuguese have traditionally set-tled that continues to experience sizeable Portuguese population growth. In the areas of geographical concentration within each state,5the Portuguese Americans
have increasingly moved away from the ethnic ghettoes into the suburbs, where they regularly commingle with people from other ethnic groups, and where, there-fore, assimilation will occur at a faster pace. The ethnic ghettos have been experien-cing a “brain drain”, and those left behind are perhaps on a path of downward assimilation.
The traditional areas of spatial concentration — now more diluted, but but-tressed by those living in nearby suburbs — will continue to produce a vibrant
4 In this paper I analyze spatial mobility at the state level. However, there are well-known areas of Portuguese American spatial concentration within certain states. A deeper analysis could be done to ascertain changes in the spatial concentration of Portuguese Americans at smaller geo-graphical levels.
5 The term enclave has been applied to areas of Portuguese spatial concentration; however, this is a misapplication, or at best, a very loose application, of Wilson and Portes´ (1980) original con-ceptualization of the ethnic enclave. Portuguese immigrants have not created a more or less self-contained, vertically integrated economy, with a dense network of co-ethnic businesses. Their mode of incorporation was primarily into traditional, blue collar areas of activity.
Portuguese American culture and be a source of ethnic identification for years to come, even though the spatial concentration among Portuguese Americans is de-clining and the level of assimilation is increasing. Over the years, and with decrea-sing levels of new immigrant replenishment from Portugal, Portuguese American culture may become increasingly Americanized. Immigrant traditions are modifi-ed as a result of the interaction between the old culture and the host society’s cultu-re. For example, in New Bedford, MA, the Madeira feast incorporates elements of the mainstream culture in order to meet the needs of the more acculturated chil-dren of immigrants and individuals of other ethnic groups. As the years pass, eth-nic ties will become increasingly diluted and etheth-nicity more symbolic. Gans (1979) introduced the concept of “symbolic ethnicity”, which for white Americans may involve the symbols of ethnicity, such as eating ethnic food, participating in festi-vals, and perhaps supporting political issues confronting the country of origin. At this stage, the ethnic heritage becomes peripheral and has no real impact on peo-ple’s daily existence, even if they do not relinquish entirely their ethnic identity.
Acculturation
According to assimilation theory, acculturation — the adoption of aspects of the host country’s culture that facilitate survival and adaptation to life in the host country — is an initial stage in the process of assimilation. Census data do not allow us to determine all the facets of acculturation among the Portuguese immigrants. However, it provides data on one indicator of acculturation — language use and ability to speak English. Scholars have identified a three generational model of
1980 1990 % Change 1980-1990 2000 % Change1990-2000 California 320,832 356,495 11.1 330,810 -7.2 Massachusetts 270,557 289,424 7.0 279,513 -3.4 Rhode Island 90,046 94,650 5.1 91,387 -3.4 New Jersey 49,376 63,188 28.0 72,193 14.3 Florida 19,121 32,345 69.2 48,957 51.4 Hawaii 57,541 57,125 -0.7 48,521 -15.1 Connecticut 38,873 43,098 10.9 44,695 3.7 New York 42,876 44,090 2.8 43,829 -0.6 Washington 9,895 13,215 33.6 17,200 30.2 Texas 9,031 13,304 47.3 16,552 24.4 Oregon 9,555 11,369 19.0 14,674 29.1 Pennsylvania 11,187 12,770 14.2 13,566 6.2 New Hampshire 5,898 10,199 72.9 13,094 28.4 Virginia 6,707 10,818 61.3 12,022 11.1 Arizona 4,674 7,338 57.0 11,599 58.1 Nevada 5,464 8,246 50.9 11,210 35.9
All other states 73,045 85,677 17.3 106,793 24.6
Source: U. S. Census Bureau: United States Censuses, 1980, 1990, and 2000.
language assimilation. The native language remains dominant within the immi-grant generation, their children are bilingual, and their grandchildren speak English only (Waters and Jiménez, 2005: 110). This model, however, is misleading because the first American born generation’s command of the ancestral language is very limited and usually restricted to the vocabulary needed for communication within the household.
I first examine language use among the foreign born for Brazilians, Portugue-se, Greek, Italians, and Irish. Secondly, I examine language use for the ancestry groups.
Those born in Brazil, not surprisingly, given that they are to a large extent re-cent immigrants, have the lowest level of acculturation, followed by the Portugue-se (Portugue-see table 3). The PortuguePortugue-se and the Greeks have similar levels of English lan-guage use. Of those originating in a non-English speaking country, the Italians are the most acculturated group. The Irish, of course, cannot be used for comparison purposes along this indicator since they speak English upon arrival.
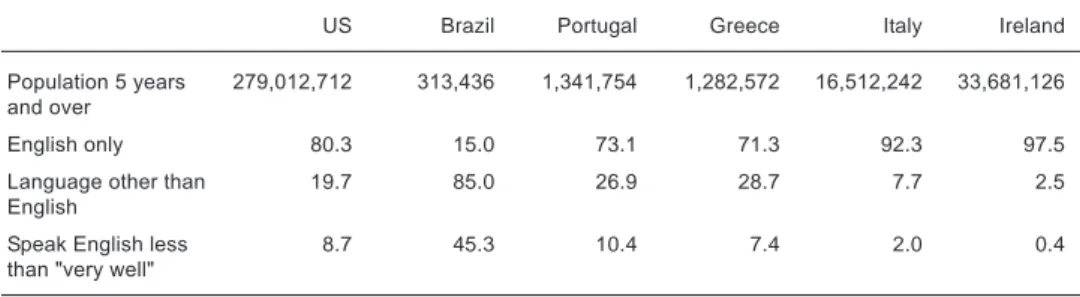
Language use is associated with the time of arrival of each ancestry group, which includes the foreign born and those born in the United States. The Portugue-se show a much higher level of acculturation than the Brazilians (table 4). The Por-tuguese level of acculturation is compatible to that of the Greeks, with whom they share similar immigration patterns. These two groups are somewhat less accultu-rated than the Italians, and this would be expected given the earlier arrival of Itali-an immigrItali-ants.
Predictions in the literature concerning the loss of the mother tongue among the American born generations are confirmed by the data. Only 26.9% of people of Portuguese ancestry in the United States speak a language other than English.
Socioeconomic integration
Educational achievement
Socioeconomic integration is an important dimension of assimilation. As immi-grants begin to venture out into the mainstream educational and employment institutions, their level of interaction with non-ethnics increases and so do the possibilities of engaging with the latter in intimate social interaction within pri-mary social groups.
Table 5 provides educational achievement data for the five ethnic groups con-sidered in this paper from census 2000 for the foreign born and from the 2006 Ame-rican Community Survey for the ancestry groups. With the exception of Brazilians, the level of educational attainment is higher for the ancestry groups. Of the foreign born, those born in Portugal have the lowest level of educational attainment, while those born in Brazil have the highest level, closely followed by those born in Ire-land. This educational pattern, and the occupational patterns that I will review in a later section, point to a bipolar form of immigration from Brazil, perhaps with highly educated immigrants entering primary sector occupations upon or shortly
after arrival and those with low levels of education being relegated to the secon-dary sector of the economy. According to the 2006 Yearbook of Immigration Statis-tics, 31% (i.e., 5,461 out of 17,748) of Brazilian immigrants, arriving that year, were granted legal permanent resident status under the employment based preferences category, a category under which immigrants with occupational skills needed in the U.S. are favored. Of the 1,439 Portuguese immigrants granted permanent resi-dent status that year, 381 (26%) received it under the employment based preferen-ces category.
The Portuguese American born generations have a higher level of education than the immigrant generations but are still below the national average, and are considerably below the three other European ancestries considered in this paper. People of Greek, Italian, and Irish ancestries have a higher percent of college gradu-ates than the general U. S. population. The lower educational attainment of people of Portuguese ancestry can be explained by the low educational levels of the immi-grant generation. The occupational concentration of the Portuguese in manufactu-ring in the 1970s and 1980s may also have held back the first American born genera-tion educagenera-tionally.
Brazil Portugal Greece Italy Ireland Population 5 years and over 209,420 202,685 165,395 472,465 156,155
English only 8.7 10.7 10.9 21.1 88.8
Language other than English 91.3 89.3 89.1 78.9 11.2
Speak English less than "very well" 49.1 52.6 44.8 40.5 2.3 Source: U. S. Census Bureau, Census 2000 Special Tabulations (STP-159).
Table 3 Language use among the foreign born
US Brazil Portugal Greece Italy Ireland
Population 5 years
and over 279,012,712 313,436 1,341,754 1,282,572 16,512,242 33,681,126
English only 80.3 15.0 73.1 71.3 92.3 97.5
Language other than
English 19.7 85.0 26.9 28.7 7.7 2.5
Speak English less
than "very well" 8.7 45.3 10.4 7.4 2.0 0.4
Source: U. S. Census Bureau, 2006 American Community Survey.
Income
With increased socioeconomic integration, groups that may have started at the bot-tom of the occupational structure may gradually rise to middle class status. Data on household income for the immigrant population show that Brazilians have the lowest level of income (see table 6). The higher level of participation of the Portu-guese in traditional immigrant areas of activity, in manufacturing and other blue collar jobs, explains the high median income of this population group, as well as the higher percentages in middle income levels, between $35,000 and $75,000, in spite of their lower levels of education. The median household income for the Portuguese is comparable to that of the other European immigrant groups consi-dered in this paper. Portuguese immigrants, however, perhaps due to lower edu-cational levels, have the lowest percent of households making an income of $200,000 or more.
The data on poverty rates show Brazilian immigrant families doing conside-rably worse than the other four immigrant groups. The Brazilians’lower income le-vel and higher poverty rate may be attributable to employment in the unstable sec-tor of the service economy. Brazilian immigrants arriving today are more likely to experience segmented assimilation than were the Portuguese who arrived two to five decades ago. The Portuguese rate of poverty is comparable to that of the Itali-ans and Greeks.
The 2006 American Community Survey data show that all five ancestry groups enjoy a higher household income than the national average, with people of Greek an-cestry performing better than the other four groups (see table 7). People of Brazilian ancestry have the lowest household income. The Portuguese Americans’ median household income is slightly lower than that of Greek and Italian Americans, but it is higher than the income of Irish Americans. Families of Brazilian ancestry have
Foreign born 2000
% Ancestry group 2006%
Brazil High school graduate or higher 80.2 84.0
Bachelor's degree or higher 32.0 29.2
Portugal High school graduate or higher 42.9 81.2
Bachelor's degree or higher 7.3 21.7
Greece High school graduate or higher 59.9 88.1
Bachelor's degree or higher 19.8 38.0
Italy High school graduate or higher 53.7 90.4
Bachelor's degree or higher 13.8 32.0
Ireland High school graduate or higher 78.3 91.0
Bachelor's degree or higher 24.0 31.1
U.S. 2000 U.S. 2006
United States High school graduate or higher 80.4 84.1
Bachelor's degree or higher r 24.4 27.0
Source: U. S. Census Bureau, Census 2000 Special Tabulations (STP-159) and 2006 American Community
medium income levels below the national average, but the groups with European roots have a family income above the national average, again with Greek families en-joying the highest median income. In terms of rates of poverty, all five groups per-form better than the national average, but those of Brazilian ancestry have a higher poverty rate than the European groups. People of Portuguese ancestry have a slightly higher poverty rate than those of Greek, Italian and Irish ancestries.
Portuguese immigrants and their descendents are catching up to the income levels of ancestry groups with roots in 19th century immigration. In that sense, it can be argue that they have achieved income parity in American society. The fore-ign born Portuguese, however, still have not made substantial inroads into the hig-her income categories in the United States. This can be explained by several factors, including the interaction between education and income and the opportunity structures in manufacturing, fishing and construction, which made the pursuit of education and entrepreneurship less necessary.
INCOME IN 1999 Brazil Portugal Greece Italy Ireland
Households 77,765 97,830 89,845 266,695 82,750 Less than $10,000 12.6 8.2 9.2 10.1 7.8 $10,000 to $14,999 6.0 5.2 6.1 8.1 6.3 $15,000 to $24,999 12.6 10.1 11.0 13.4 11.5 $25,000 to $34,999 13.3 11.1 10.5 11.2 10.8 $35,000 to $49,999 17.9 16.8 13.8 13.8 13.6 $50,000 to $74,999 18.0 24.3 19.1 17.8 18.5 $75,000 to $99,999 9.1 13.1 12.0 10.9 12.8 $100,000 to $149,999 6.3 8.1 10.9 9.2 11.6 $150,000 to $199,999 1.8 1.8 3.3 2.7 3.7 $200,000 or more. 2.3 1.5 4.0 2.7 3.3
Median household income (dollars) 38,570 48,805 49,184 42,090 49,780
Mean earnings (dollars). 52,794 58,599 67,505 64,226 69,653
Median family income (dollars) 41,148 53,500 57,280 53,885 65,318
Percent of families in poverty 14.0 5.3 6.3 5.1 3.0
Source: U. S. Census Bureau, Census 2000 Special Tabulations (STP-159). Quadro 6 Income and poverty rates among the foreign born
US Brazilian Portuguese Greek Italian Irish Income
Median household income
(dollars) 48,451 49,878 57,452 60,200 59,877 54,531
Median family income (dollars) 58,526 50,863 67,299 74,361 73,066 67,889
Poverty rates
All families 9.8 8.2 6.2 5.0 5.5 6.0
All people 13.3 11.2 8.2 7.9 7.9 8.6
Source: U.S. Census Bureau, 2006 American Community Survey. Quadro 7 Ancestry groups income and poverty rates
Occupation
Occupational integration is influenced by the opportunity structure found upon arri-val and the educational and occupational skills brought to America by the immigrant group (Steinberg, 1989). When the Portuguese arrived in New England after the 1960s, there were still plenty of low skill, entry-level jobs in the manufacturing sector of the economy, but the structural changes in the American economy brought about by glo-balization were starting to occur. A few decades later, de-industrialization and a downturn in the fishing industry generated massive occupational losses among Por-tuguese-Americans in the Northeast.
Those born in Ireland, at 41.1%, are to a much larger extent involved in mana-gement, professional, and related occupations than those from the other groups (table 8). Portuguese immigrants, at 17.6%, have the lowest level of involvement in this occupational category, followed by Brazilians, Italians and Greeks. Brazilian immigrants are more likely than the other groups to be involved in service occupa-tions, whereas the Portuguese along with the Irish are the least likely to be involved in this activity area. Portuguese immigrants have the highest level of involvement in farming, fishing, and forestry occupations, but have the lowest level of involve-ment in information occupations. They also have the highest level of involveinvolve-ment in production, transportation, and material moving occupations, manufacturing and construction. The Portuguese have the highest percentage of wage and salary workers, the lowest percent of government workers, and the lowest level of self-employed workers who own their own business.
Socioeconomic mobility among Portuguese American foreign born individu-als may have been delayed by concentration in manufacturing and related activiti-es. Access to stable employment in these sectors may have deferred the educational progress of Portuguese immigrants and their children, and therefore their rise to white collar and high skill technical professions. It may also have delayed their in-volvement in business ownership. Nevertheless, due to economic restructuring, the Portuguese immigrants have had to make inroads into other areas of activity, including business ownership.
For the ancestry groups (table 9), the patterns show the progressive integra-tion and upward mobility of Portuguese Americans. The extent to which the Por-tuguese are involved in management is at 31.3%, which although still lower than the level of involvement for the other ancestry groups, nevertheless shows pro-gression from blue collar to white collar occupations. The Portuguese ancestry group’s level of involvement in construction and manufacturing is lower than that of the immigrant group. The degree of involvement in public administration and government occupations is reaching levels similar to those of the other Euro-pean ancestry groups.
Although the American economy currently provides less entry-level jobs in manufacturing, people of Portuguese ancestry do not seem to be entering in large numbers lower level service occupations. Rather, they seem to be moving up oc-cupationally into managerial, professional, and other white collar occupations. Their lower level of education, however, has delayed slightly their entrance into
these types of occupations, in comparison with other European ethnic groups. At a group level, the Portuguese, do not appear to be experiencing downward assi-milation, although individual level analysis might show that some Portuguese Americans, particularly those left behind in the Portuguese ghettos, are perfor-ming worse than their parents and grandparents.
Citizenship
Another indicator of structural integration is political participation. Census data do not allow us to obtain a complete picture of political participation by the Portu-guese. To measure this type of integration properly, the current voting and political participation behaviors of Portuguese Americans would have to be studied. Cen-sus data, in the previous section, show that the Portuguese foreign born have a lo-wer percent of public administration and government workers than the other
Brazil Portugal Greece Italy Ireland Employed civilian population 16 years and over 117,015 116,675 85,815 199,530 81,685 Occupation
Management, professional, and related
occupations 27.2 17.6 37.5 30.8 41.1
Services 30.3 16.5 20.7 18.7 15.9
Sales and office 19.4 19.2 18.7 21.7 21.7
Farming, fishing, and forestry 0.3 1.3 0.2 0.2 0.1
Construction, extraction, and maintenance 11.0 16.2 10.7 12.0 14.4 Production, transportation, and material moving 11.8 29.1 12.2 16.6 6.8 Industry
Agriculture, forestry, fishing and hunting, and
mining 0.6 2.3 0.4 0.4 0.6
Construction 9.4 13.1 8.7 9.3 13.7
Manufacturing 9.3 28.6 10.5 15.1 7.7
Wholesale trade and retail trade 12.5 12.8 13.7 14.7 10.0
Transportation and warehousing, and utilities 4.8 3.5 4.0 4.6 4.4
Information 3.0 1.3 1.6 2.2 3.5
Finance, insurance, real estate, and rental and
leasing 5.3 5.5 6.3 7.1 9.7
Professional, scientific, management,
administrative and waste management services 13.4 6.9 6.9 8.1 11.5 Educational, health and social services 13.4 12.8 14.2 16.4 20.6 Arts, entertainment, recreation, accommodation
and food services 14.8 5.7 24.8 11.6 8.9
Other services (except public administration) 11.6 5.7 6.6 7.5 6.5
Public administration 1.8 1.8 2.3 2.9 3.0
Class of worker
Private wage and salary workers 79.8 86.4 76.5 78.0 80.2
Government workers 7.1 6.8 9.5 11.9 10.1
Self-employed in own not incorporated
business 12.8 6.6 13.5 9.7 9.3
Unpaid family workers 0.3 0.2 0.5 0.4 0.3
Source: U. S. Census Bureau, Census 2000 Special Tabulations (STP-159). Quadro 8 Foreign born occupational structure
ethnic groups considered in this paper. The ancestry group, however, is engaged in these types of jobs at a rate close to that of the other European groups, showing a progressive integration of the Portuguese into the political apparatus.
Before one can vote in the United States, one must become a citizen. Table 10 shows that nearly 28% of people of Brazilian ancestry were born in the United States, but over 81% of those of Portuguese ancestry were born in the U.S. Of the foreign born, only 20.1% of the Brazilians are naturalized citizens, but 55.6% of the Portuguese fore-ign born are citizens. The Brazilian lower rates of citizenship can be explained by their time of arrival and the five-year period required by law before petitions for naturaliza-tion can be filed. Portuguese immigrants have become citizens at rates lower than
US Brazil Portugal Greece Italy Ireland
Occupation
Management, professional, and
related occupations 34.0 19.8 31.3 44.1 39.0 38.4
Services 16.5 32.9 18.0 14.3 15.1 14.7
Sales and office 25.9 15.5 26.2 26.9 28.7 27.7
Farming, fishing, and forestry 0.7 0.2 0.5 0.2 0.2 0.4
Construction, extraction,
maintenance, and repair 10.0 21.3 12.0 7.5 8.5 8.9
Production, transportation, and
material moving 13.0 10.4 11.9 7.0 8.5 10.1
Industry
Agriculture, forestry, fishing and
hunting, and mining 1.8 0.4 1.6 0.5 0.7 1.3
Construction 7.9 21.0 10.0 7.1 7.3 7.3
Manufacturing 11.6 6.1 10.9 7.3 8.9 10.1
Wholesale and retail trade 14.9 9.6 15.0 15.3 15.7 15.1
Transportation, warehousing, and
utilities 5.0 3.8 4.9 3.9 4.4 4.7
Information 2.5 2.0 2.5 3.2 3.0 2.9
Finance, insurance, real estate,
rental and leasing 7.2 4.8 7.5 9.3 9.0 8.2
Professional, scientific, management, administrative and waste management services
10.1 13.0 9.3 11.7 11.2 10.6
Educational, health and social
services 20.8 9.0 19.5 20.7 21.3 22.1
Arts, entertainment, recreation,
accommodation and food services 8.6 16.2 8.9 12.1 9.3 8.3
Other services (except public
administration) 4.8 12.4 5.3 4.8 4.6 4.3
Public administration 4.7 1.6 4.6 4.0 4.8 5.2
Class of worker
Private wage and salary workers 78.6 83.1 78.5 78.0 78.8 77.8
Government workers 14.4 4.6 13.6 13.4 14.6 15.3
Self-employed in own not
incorporated business 6.8 12.0 7.7 8.3 6.5 6.6
Unpaid family workers 0.2 0.3 0.2 0.2 0.2 0.2
Source: U. S. Census Bureau, 2006 American Community Survey. Quadro 9 Ancestry groups occupational structure
those of the other European immigrants considered in this paper. Undoubtedly, lower levels of citizenship contribute to a lower level of political integration among Portu-guese Americans.
Amalgamation
As people intermarry and have children who may identify with more than one eth-nic group, the etheth-nic identity becomes increasingly diluted. I do not have data on the rate of intermarriage for the five ancestry groups analyzed in this paper. Howe-ver, a look at the first and second ancestries reported in the United States Census since 1980 is elucidating.
Table 11 shows data for the five ancestry groups from 1980 to 2005. Due to im-migration restrictions until 1965, a larger percent of people claimed more than one ancestry in the 1980 census. As immigration levels into the United States increased, the percent of people claiming a single ancestry rose. In 1980, the earliest immi-grants to the United States, Irish Americans, were the most likely to claim two an-cestries, followed by Italians, Portuguese, Greeks, and Brazilians. By 2005, Ireland still maintained a lead, with nearly 38% reporting two ancestries. This was follo-wed by Portugal at 25.9%, Italy at 21.7%, Greece at 19.3%, and Brazil at 8.7%. The data indicate that people of Portuguese ancestry have been marrying people of ot-her ethnic groups in the United States. This trend is likely to continue, particularly among the American born generations, and will result in an overall higher level of assimilation of Portuguese Americans.
The acculturation and social, economic and political integration of Portu-guese American individuals has been delayed by low levels of education, low le-vels of industrial and post-industrial skills brought to America by Portuguese im-migrants, their time of arrival, and geographical and occupational concentration. Even so, people of Portuguese ancestry are catching up with those of other Euro-pean ancestries. Portuguese Americans are following a pattern of assimilation
US Brazil Portugal Greece Italy Ireland
Total population 299,398,485 345,535 1,442,077 1,380,258 17,829,184 35,975,855
Foreign born 37,547,789 249,395 271,763 186,230 605,455 266,425
Percent U.S. born 87.5 27.8 81.2 86.5 96.6 99.3
Percent foreign born 12.5 72.2 18.8 13.5 3.4 .07
Percent naturalized
U.S. citizen 42.0 20.1 55.6 78.8 65.4 60.4
% not a U.S. citizen 58.0 79.9 44.4 21.2 34.6 39.6
Source: U. S. Census Bureau, 2006 American Community Survey. Quadro 10 Rates of citizenship by ethnic group
similar to that of 19th and early 20th century European immigrants. The theoreti-cal framework offered by assimilation theory has proven to be useful for an analysis of Portuguese settlement in the United States. In an age of increasing transnationalism, however, people, regardless of how assimilated they have be-come, are less likely to relinquish their ancestral memories or a pluralistic identi-fication with their original ethnic group.
Conclusion
The data presented in this paper show that the Portuguese and their descendents are well integrated and assimilated into American society. The settlement and assimilati-on experience of Portuguese Americans is perhaps more comparable to that of older European immigrant groups than it is to groups arriving today, the latter of which may be experiencing segmented assimilation. The Portuguese arrived in America with low levels of education and occupational skills, however, the opportunity
First ancestry Second Ancestry At least one ancestry Percent single ancestry Percent two ancestries Brazil 1980 18,750 8,890 27,640 67.8 32.2 1990 57,108 8,767 65,875 86.7 13.3 2000 163,608 17,468 181,076 90.4 9.6 2005 277,148 26,407 303,555 91.3 8.7 Portugal 1980 616,362 407,989 1,024,351 60.2 39.8 1990 900,060 253,291 1,153,351 78.0 22.0 2000 913,859 259,832 1,173,691 77.9 22.1 2005 1,021,805 357,642 1,379,447 74.1 25.9 Greece 1980 615,882 343,974 959,856 64.2 35.8 1990 921,782 188,591 1,110,374 83.0 17.0 2000 942,723 210,315 1,153,038 81.8 18.2 2005 1,041,561 249,820 1,291,381 80.7 19.3 Italy 1980 6,883,320 5,300,372 12,183,692 56.5 43.5 1990 11,246,781 3,417,769 14,664,550 76.7 23.3 2000 12,836,020 2,799,547 15,635,567 82.1 17.9 2005 13,501,534 3,740,892 17,242,426 78.3 21.7 Ireland 1980 10,337,353 29,828,349 40,165,702 25.7 74.3 1990 22,695,454 16,040,085 38,735,539 58.6 41.4 2000 19,279,211 11,245,588 30,524,799 63.2 36.8 2005 21,580,761 13,087,962 34,668,723 62.2 37.8
Source: U. S. Census Bureau: United States Censuses, 1980, 1990, and 2000 and 2005 American Community Survey. Quadro 11 First and second ancestries by ethnic group
structures found upon arrival — still within America’s industrial sector — and per-haps the normative strength of Portuguese American families and communities, en-sured that the immigrants, for the most part, could launch the next generation on a path of upward assimilation. The timing of arrival, however, along with the educatio-nal and occupatioeducatio-nal attributes of Portuguese immigrants, have kept the Portuguese from reaching full educational, income, and occupational parity with the descendents of the other European groups considered in this paper. What is remarkable, however, is that as an aggregate, people of Portuguese ancestry are not that far from matching the performance of people from the older ancestry groups.
As a result of increasing assimilation, waning levels of immigration, economic globalization and the consequent declining levels of occupational concentration in tra-ditional areas of immigrant economic activity, the Portuguese American communities of today are in a state of flux. Immigrants who arrived in the 1970s and 1980s are reti-ring and to some extent are moving away from the areas of Portuguese geographical concentration. As individuals from the immigrant and first American born generati-ons move to the suburbs and to states with lower levels of Portuguese spatial concen-tration, the traditional immigrant communities will continue to experience a “brain drain”. Those who remain behind in the old ethnic ghettos are at risk of experiencing downward assimilation. Those dispersing into areas of low ethnic concentration are li-kely to achieve structural integration, both at the primary and secondary levels of soci-al interaction, at a faster pace. They will soci-also be more likely to practice exogamy, ha-ving children whose identification with Portuguese ethnicity and language may be minimal. Their ethnicity will become increasingly symbolic.
Assimilation and pluralism are processes that may occur simultaneously not only in societies, but also within a single ethnic group, or even in the life of an indi-vidual. As some Portuguese Americans achieve higher levels of acculturation, structural integration, and amalgamation in America, others will remain less assi-milated along these dimensions, particularly the newcomers. However, it might be in Portugal’s interest to fuel the fire that keeps the ancestral ties alive, among inte-grated Portuguese Americans, for they are the ones who have the capacity and the power to promote the interests of their ancestral land in the United States. Not-withstanding, Portugal will have to do so in English rather than in Portuguese.
References
Alba, R. (1995), “Comment”, Journal of American Ethnic History, 14 (2), pp. 82-91. Alba, R., and V. Nee (2003), Remaking the American Mainstream. Assimilation and
Contemporary Immigration, Cambridge, MA, Harvard University Press.
Averitt, R. (1968), The Dual Economy. The Dynamics of American Industry Structure, New York, W. W. Norton.
Barkan, E. (1995), “Race, religion, and nationality in American society: a model of ethnicity — from contact to assimilation”, Journal of American Ethnic History, 14 (2), pp. 38-76. Blauner, R. (1982), “Colonized and immigrant minorities”, in A. Giddens and D. Held (eds.),
Bonacich, E. (1972), “A theory of ethnic antagonism: the split labor market”, American
Sociological Review, 37, pp. 547-59.
Bonacich, E. (1973), “A theory of middlemen minorities”, American Sociological Review, 38, pp. 583-594.
Galbraith, J. K. (1971), The New Industrial State, New York, NY, Mentor.
Gans, H. (1979), “Symbolic ethnicity: the future of ethnic groups and cultures in America”, Ethnic and Racial Studies, 2, pp. 1-20.
Gleason, P. (1992), Speaking of Diversity. Language and Ethnicity in Twentieth-Century
America, Baltimore, MD, John Hopkins University Press.
Gordon, M. (1964), Assimilation in American Life. The Role of Race, Religion, and National
Origins, New York, NY, Oxford University Press.
Guarnizo, L., A. Portes, and W. Heller (2003), “Assimilation and transnationalism: determinants of transnational political action among contemporary migrants”,
American Journal of Sociology, 108 (6), pp. 1211-48.
Lal, B. B. (1995), “Symbolic interaction theories”, American Behavioral Scientist, 38, pp. 421-441. Massey, D. S. (1985) “Ethnic and residential segregation: a theoretical and empirical
review”, Sociology and Social Research, 69, pp. 315-50.
Perlmann, J. (2005), Italians Then, Mexicans Now. Immigrant Origins and Second-Generation
Progress, 1890-2000, New York, NY, Russell Sage Foundation.
Portes, A. (2006), “Review essay, paths of assimilation in the second generation”, Sociological Forum, 21 (3), pp. 499-504.
Portes, A., and J. Böröcz (1989), “Contemporary immigration: theoretical perspectives on its determinants and modes of incorporation”, International Migration Review, 23 (3), pp. 606-630.
Portes, A., P. Fernández-Kelly, and W. Haller (2005), “Segmented assimilation on the ground: the new second generation in early adulthood”, Ethnic and Racial Studies, 28 (6), pp. 1000-1040.
Portes, A., W. Heller, and L. Guarnizo (2002), “Transnational entrepreneurs: an
alternative form of immigrant economic adaptation”, American Sociological Review, 67, pp. 278-289.
Portes, A., and R. G. Rumbaut (2006), Immigrant America. A Portrait, Berkeley, 3rded., CA,
University of California Press.
Portes, A., and S. Shafer (2007), “Revisiting the enclave hypothesis: Miami twenty-five years later”, The Sociology of Entrepreneurship, 25, pp. 177-190.
Portes A., and M. Zhou (1993), “The new second generation: segmented assimilation and its variants among post-1965 immigrant youth”, Annals of the American Academy of
Political and Social Science, 530, pp. 74-98.
Salins, P. (1997), “Assimilation, American style”, Reason, 28 (9), pp. 20-27.
Steinberg, S. (1989), The Ethnic Myth. Race, Ethnicity, and Class in America, Boston, MA, Beacon Press.
Turner, J. H., and E. Bonacich (1980), “Toward a composite theory of middleman minorities”, Ethnicity, 7, pp. 144-158.
Waldinger, R. (2007), “Did manufacturing matter? The experience of yesterday’s second generation: a reassessment”, International Migration Review, 41(1), pp. 3-39.
Waldinger, R., and C. Feliciano (2004), “Will the new second generation experience ‘downward assimilation’? Segmented assimilation re-assessed”, Ethnic and Racial
Studies, 27 (3), pp. 376-402.
Waldinger, R., and J. Perlmann (1998), “Second generations: past, present, future”,
Journal of Ethnic and Migration Studies, 24, pp. 5-24.
Waters, M., and T. Jiménez (2005), “Assessing immigrant assimilation: new empirical and theoretical tools”, Annual Review of Sociology, 31, pp. 105-25.
Wilson, J. (1980), The Declining Significance of Race, 2nded., Chicago, IL, University of
Chicago Press.
Wilson, J. (1987), The Truly Disadvantaged. The Inner City, the Underclass, and Public Policy, Chicago, IL, University of Chicago Press.
Wilson, J. (1996), When Work Disappears. The World of the New Urban Poor, New York, NY, Knopf. Wilson, K. L., and A. Portes (1980), “Immigrant enclaves: an analysis of the labor market
experiences of Cubans in Miami”, American Journal of Sociology, 86, pp. 295-319. Zhou, M. (1997), “Segmented assimilation: issues, controversies, and recent research on
the new second generation”, International Migration Review, 31(4), pp. 0975-1008. Dulce Maria Scott, professor of Sociology and Criminal Justice at Anderson University, Indiana, USA. E-mail: dmscott@anderson.edu
Resumo/ abstract/ résumé/ resumen
Aculturação luso-americana, integração socioeconómica e amalgamação: até onde avançaram?
Utilizando um referencial teórico resultante das formulações recentes da teoria da as-similação, este artigo apresenta uma análise comparativa da aculturação, da integra-ção socioeconómica e das tendências de amalgamaintegra-ção dos imigrantes portugueses e dos seus descendentes nos Estados Unidos. A assimilação ascendente dos indivíduos luso-americanos foi adiada pela concentração geográfica e ocupacional, e pelos baixos níveis de educação e competências profissionais trazidos para a América pelas gera-ções imigrantes portuguesas. É de salientar, no entanto, que em termos agregados, os indivíduos de ascendência portuguesa não estão tão longe de alcançar o desempenho económico dos indivíduos de grupos de ascendência mais antiga na América. Palavras-chave assimilação, integração, luso-americanos, imigração, etnia.
Portuguese americans’ acculturation, Socioeconomic integration, and amalgamation: how far have they advanced?
Using a theoretical framework derived from current formulations of assimilation the-ory, this paper provides a comparative analysis of the acculturation, socioeconomic
integration, and amalgamation trends of Portuguese immigrants and their descen-dents in the United States. Upward assimilation of Portuguese American individuals has been delayed by geographical and occupational concentration and the low levels of education and occupational skills brought to America by the Portuguese immigrant generations. What is remarkable, however, is that in aggregate terms, people of Portu-guese ancestry are not that far from matching the economic performance of people from older ancestry groups in America.
Key-words assimilation, integration, Portuguese Americans, immigration, ethnicity.
Acculturation luso-américaine, intégration socioéconomique et amalgame: jusqu'où son-ils allés ?
Par le biais d'un référentiel théorique qui résulte des formulations récentes de la théorie de l'assimilation, le présent article présente une analyse comparative de l'acculturation, de l'intégration socioéconomique et des tendances d'amalgame des immigrés portugais et de leurs descendants aux Etats-Unis. L'assimilation as-cendante des individus luso-américains a été retardée par la concentration géo-graphique et occupationnelle, et par les bas niveaux d'éducation et de compéten-ces professionnelles apportés en Amérique par les générations d'immigrés portu-gais. Cependant, en termes de ménages, les individus d'ascendance portugaise ne sont pas si loin d'atteindre la performance économique des individus des groupes d'ascendance plus ancienne en Amérique.
Mots-clé assimilation, intégration, luso-américains, immigration, ethnie.
Aculturación luso-americana, integración socioeconómica y amalgamación: hasta dónde avanzarán?
Utilizando un referencial teórico resultante da las formulaciones recientes de la te-oría de la asimilación, este artículo presenta un análisis comparativo de la acultura-ción, de la integración socioeconómica y de las tendencias de amalgamación de los inmigrantes portugueses y de sus descendientes en los Estados Unidos de Nortea-mérica. La asimilación ascendente de los individuos luso-americanos fue pospues-ta por la concentración geográfica y ocupacional, y por los bajos niveles de educa-ción y competencias profesionales traídas a América por las generaciones inmi-grantes portuguesas. Sin embargo, es de enfatizar, que en términos agregados, los individuos de ascendencia portuguesa no están tan lejos de alcanzar el desempeño económico de los individuos de grupos de ascendencia más antigua en América. Palabras-clave asimilación, integración, luso-americanos, inmigración, etnia.