Repositório ISCTE-IUL
Deposited in Repositório ISCTE-IUL:
2019-01-14
Deposited version:
Post-print
Peer-review status of attached file:
Peer-reviewed
Citation for published item:
Ramos, P., Botelho, L. & Martins, A. (2019). Enhancing excel business tools with additional relational and recursive capabilities. International Journal of Information Technology and Management .
Further information on publisher's website:
http://www.inderscience.com/info/ingeneral/forthcoming.php?jcode=ijitm
Publisher's copyright statement:
This is the peer reviewed version of the following article: Ramos, P., Botelho, L. & Martins, A. (2019). Enhancing excel business tools with additional relational and recursive capabilities. International Journal of Information Technology and Management .. This article may be used for non-commercial purposes in accordance with the Publisher's Terms and Conditions for self-archiving.
Use policy
Creative Commons CC BY 4.0
The full-text may be used and/or reproduced, and given to third parties in any format or medium, without prior permission or charge, for personal research or study, educational, or not-for-profit purposes provided that:
• a full bibliographic reference is made to the original source • a link is made to the metadata record in the Repository • the full-text is not changed in any way
The full-text must not be sold in any format or medium without the formal permission of the copyright holders.
Serviços de Informação e Documentação, Instituto Universitário de Lisboa (ISCTE-IUL) Av. das Forças Armadas, Edifício II, 1649-026 Lisboa Portugal
Phone: +(351) 217 903 024 | e-mail: [email protected] https://repositorio.iscte-iul.pt
Enhancing Excel Business Tools with
Additional Relational and Recursive
Capabilities
Abstract
This paper presents a new plug-in that enriches spreadsheet capabilities mainly in what regards its potential for relational queries and recursive computational processes. Currently some apparently trivial and useful queries can only be handled with the support of programing skills. Spreadsheet users with low computer science skills should have a natural and easy way to handle those queries within the spreadsheet, without relying on external programming (e.g., VBA). The tool we developed is supported on Prolog technology and provides those features to the most used professional spreadsheet: Microsoft Excel. Along the paper we explore the plug-in features with several business examples.
Keywords: Dedutive Spreadsheet, Business Tools, Excel, Prolog, Recursive Processing, Relational Data
1 Introduction
This paper presents a new plug-in that enriches spreadsheet capabilities mainly in what regards its potential for relational queries and recursive computational processes. As it will be presented later, currently some apparently trivial and useful queries can only be realized with the support of programing skills. Spreadsheet users with low computer science skills should have a natural and easy way to realize those queries within the spreadsheet itself. The tool we developed provides those features to the most used professional spreadsheet: Microsoft Excel.
The paper presents examples of simple problems that cannot be easily addressed using usual Microsoft Excel resources. Then we consider different technological solutions for the exemplified classes of problems, namely Relational Database/SQL-based technology, and Prolog-based technology. While SQL-based technology would solve some of the presented problems, it cannot solve all of them. Following, we describe a plug-in for the Microsoft Excel, through which MS Excel users can solve all the discussed classes of problems using Prolog technology integrated into the spreadsheet.
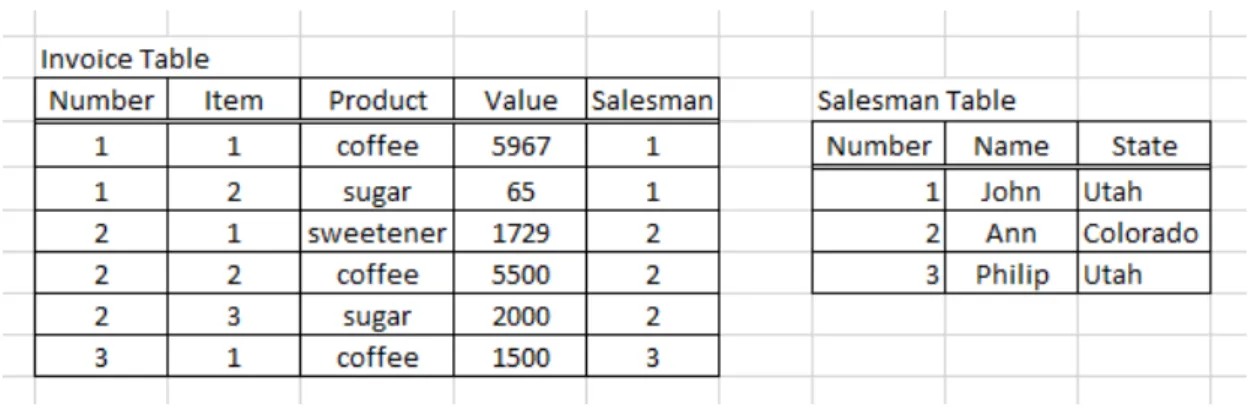
Microsoft Excel has powerful capabilities, which are strongly valued and used both by individuals and in every company for a large diversity of tasks. However, like all software tools, it has some limitations. One of those limitations pertains to relational queries, for example, queries whose filtering criteria concerns more than one row in a table. When a user works with a table with several columns and rows, it is relatively simple to filter the rows using criteria’s whose scope is the row itself. For example, it is simple to filter only the invoices that sell a specific product (assuming that the product is one of the table columns). However, since one invoice can include more than one item, the user can be interested in retrieving invoices for a specific product that do not include another specific one (to assess the success of specific selling policies). That kind of query cannot be made easily using Microsoft Excel features. Figure 1 illustrates the example (the expected answer is Invoice Number 3).
Figure 1 - Example of a query whose criteria relates with more than one row
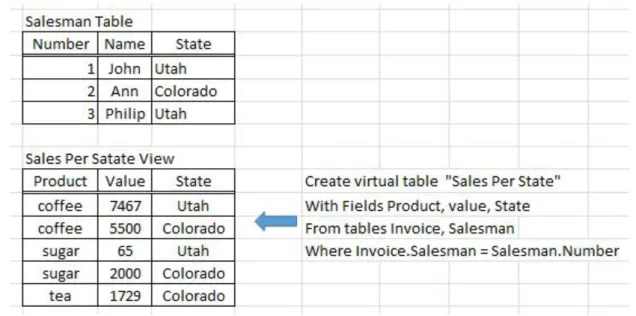
Another situation not covered in a satisfactorily way by Microsoft Excel involves queries that need to relate data stored in more than one table. In order to deal with those kinds of queries users usually need to create a new table that combines data from the “base” tables. That solution is laborious and entails the creation of redundant data in the spreadsheet (and all the well-known associated disadvantages). In relational databases it is possible to create virtual tables (called Views) that combine data from several tables. Those tables are virtual in a sense that they do not actually store the information, but only its “signature” (the table name, the columns name, and the query that retrieves the data). However, users can retrieve data from the virtual table exactly the way they do with any other table. Microsoft Excel does not allow the definition of virtual tables.
In Figure 2 we illustrate the desired feature (i.e., creating a virtual table), which is not possible in Microsoft Excel.
Figure 2 – An example of a virtual table
Microsoft Excel does also not allow recursive processing, but recursive reasoning if often needed in data analysis.
Let us suppose that a certain user creates a table with direct flights connecting two airports: the origin and the destination airports. A trivial problem is to determine if there is a sequence of one or more flights connecting two airports (even if there is no direct flight between the two). A simple solution to this problem may be defined, using a banal example of recursive processing. In fact, it is possible to go from airport 1 to airport 2, if there is a direct flight between them, or if there is a direct flight from airport 1 to any other airport, say airport 3, and if it is possible to go from airport 3 to airport 2. This kind of reasoning is called recursive because the solution to the original problem (i.e., determining if “it is possible to go from airport 1 to airport 2”) involves finding the solution to a similar problem (i.e., determining if “it is possible to go from airport 3 to airport 2”). Although simple and intuitive, this kind of solution cannot be implemented in Microsoft Excel spreadsheets.
With a set of filters and redundant data it is possible to implement it in a spreadsheet without recurring to a programming language. Nevertheless this kind of solution is not easy and intuitive to users without sophisticated computer science skills. We claim that solutions to trivial problems should be easy and intuitive for all users. In Figure 3 we illustrate the desired spreadsheet feature.
Figure 3 – An example of a recursive query
In the example presented in Figure 3 the user wants to know if it is possible to fly from London to Tokyo. There is on alternative: a flight with a connection in Frankfurt. To automatically answer the question (when there aren’t direct flights) the user must include in the spreadsheet a recursive rule that says something as “A flight is a direct flight, or a direct flight followed by a flight.”
Relation manipulation and calculus are strongly developed in several languages. One of such examples is the database standard query language SQL (Structured Query Language, [Date and O'Reilly 2009]). Prolog Language [Clocksin and Mellish 2003] is another example of a powerful language suitable for relational and recursive processing, perhaps the most flexible and complete one. Prolog, for example, deals very naturally with recursive reasoning, contrary to SQL that does not allow it at all. Prolog comes from a set of approaches based on logical representation and calculus. There are already some approaches that try to integrate logical mechanisms into spreadsheets, but we consider that all of them are far from achieving a satisfactory solution (in section 5 we summarize those approaches). However the underlying idea (”deductible spreadsheets”) seemed to be adequate to our intents. The solution we present in this paper is supported in the Prolog language, but in such a way that integration is transparent to the users. From the user’s perspective, what they have is just another Microsoft Excel function that allows very powerful queries, involving relational and recursive processing. Our new “function” has the same user interface as other Microsoft Excel functions. To illustrate Prolog potential, in Figure 4, Figure 5 and in Figure 7 we present examples of queries that will solve the problems illustrated in examples presented in Figure 1, Figure 2 and Figure 3.
Informally, this query can be read as “What are the invoice numbers (variable Number) including coffee but not sugar?”. Using the same variable Number in the two parts of the query ensures that it refers to the same invoice that should satisfy the two conditions: including coffee but not sugar.
Figure 5 – Prolog View equivalent to the virtual table of Figure 2
Figure 5 shows the Prolog definition of the virtual table described in Figure 2. The definition may have the following informal reading: “The specified Product, with the specified Value was sold in the specified State, if there is an invoice with the same product and value, sold by a salesman in the specified State”. The underscore in the second argument of the Invoice table means that the Item is not important. The underscore in the second argument of the Salesman table means that the name of the salesman is irrelevant.
If we define the virtual table ‘Sales Per State’ as in Figure 5, in order to obtain the sales from Utah we just need do execute the following query:
Figure 6 – Querying a Prolog virtual table (sales from Utah)
The recursive rule of the flight example can be represented in prolog in the following way:
Figure 7 – Recursive Flight Rule in Prolog
The flight definition presented in Figure 7 has two clauses. The first one says that there is a flight between two airports (Origin and Destination) if there is a direct flight between them.
The second part of the definition says that there is a flight between the Origin and the Destination airports if there is a direct flight from the Origin airport to another airport (Connection) and there is a flight from that airport (Connection) to the Destination. Notice that the Prolog syntax is very similar to the SQL syntax that is taught to business students in several universities. Users with basic informatics skills easily use SQL to retrieve information directly from a database without the support of dedicated forms. The SQL equivalent of the Prolog query presented in Figure 6 is the one depicted in Figure 8. Our point is that, if non-professional users can intuitively perform SQL queries, they will also be capable to do with the same in Prolog.
Figure 8 – Querying a View (sales from Utah)
Our tool integrates into Microsoft Excel spreadsheets exactly with the same features illustrated in Figure 4, Figure 5, Figure 6 and in Figure 7. As we present later, we managed to develop this functionality with the support of Swi-Prolog1 [Wielemaker et al 2012], an open source C implementation of Prolog.
The paper is organized as follows. In section 2 the features of our tool are fully presented. Some technical details about the tool are presented in section 3. In section 4 comprehensible examples are used to illustrate how our tool exceeds Microsoft Excel limitations to support some basic queries. In section 5 we present related work, namely, other approaches to bring together spreadsheets and the kind of features that our tool supports. In the last section we point out some directions for future developments.
2 Using Prolog within the Spreadsheet
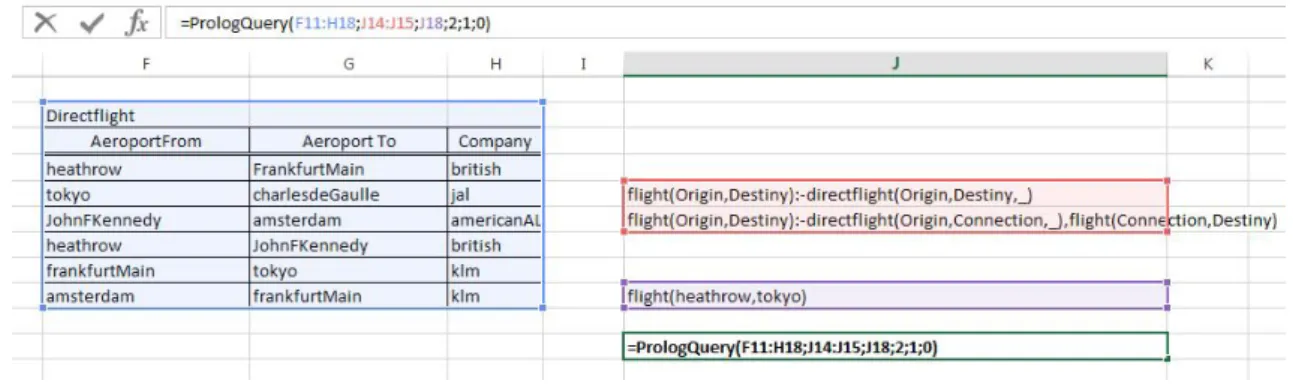
In this section, we present Prolog Query, its features, and the way the user interacts with it. In Figure 9 an example of a Prolog Query interaction is presented. A query is executed through a function placed on a single cell (last row of column J in the example). The function returns the “answers” in the cells immediately bellow it. A query has several components (arguments), but the relevant ones are the database (columns F, G and H) where the data is placed, the rules that can provide new data (first two non blank rows of column J) and the question itself (third non blank row of column J). The function arguments are explained in detail along the present section.
Figure 9 – Prolog Query Function Example
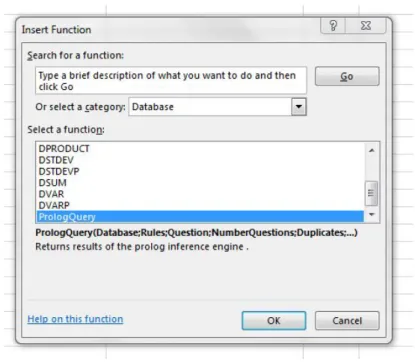
Prolog Query is a user-defined function under the Database Functions Category (Figure 10).
Figure 10 – PrologQuery as a Database Function
The ProlgogQuery function has six parameters that can be instantiated in a dialog box presented in Figure 11: database, rules, question, number of answers, permission to get duplicate answers, and case sensitiveness.
Database. The database (facts) that contains the information that supports the queries.
It is defined as a datasheet range that cannot be empty. A database can contain several tables. Each table has a name (placed in the first row) and columns. The columns names must be placed in the second row of the table, as in the DirectFlight table presented in Figure 9. Tables can contain blank lines, but they will be omitted.
Rules. Rules usually are created in order to generate new facts based on the ones
already in the database. The “Virtual table” presented in Figure 2 and the query presented in Figure 1 do not require specific rules definition: these are examples of direct queries to the database. In the Figure 3 example it is necessary to define a new rule. The parameter is defined as a datasheet range that can be empty.
For example, the rule presented in the Figure 3 example (Flight) was created to represent information that was not explicitly contained in the database: information about Flights. Flights are inferred based on a more specific concept already presented in the database: direct flights. The rule flight(Origin, Destination):-directFlight(Origin, Destination) means that if Destination):-directFlight(Origin, Destination) is a fact (whatever the values for Origin and Destination, which work here as variables), then flight(Origin, Destination) is true. In the second rule, we can see that if directFlight(Origin, Connection) is a fact and flight(Connection, Destination) is true, then flight(Origin, Destination) is also true.
Question. The Question parameter is used to specify the query expression defined in
the spreadsheet. The parameter is a cell range that cannot be empty. Several query examples are presented along the paper. The query syntax is that of Prolog: it is a simple query (e.g., ‘Sales per state’(Product, Value, utah)) or a compound query made up of conjunctions, disjunctions and negations of queries, in which simple queries have the form tablename<columns1, column2>), conjunctions are specified through the Prolog conjunction operator (,or and), disjunctions are specified through the Prolog disjunction operator (;) and negations are specified through the Prolog negation operators (not or \+). Constants are used to constrain (i.e., to filter) the answers. For example, ‘Sales Per State’(Product, Value, Utah) (Figure 6) is the same as asking “the columns Product and Value of all rows of table ‘Sales Per State’ where the State is ‘utah’. The names of the predicate arguments do not need to be those of the table columns. Only their position in the predicate is relevant (the first argument correspond to the first column, the second argument correspond to the second column, and so on). The comma symbol (between predicates) represent columns, and the not operator returns true if the table inside is empty.
The other three arguments (NumberAnswers, Duplicates, and Sensitive) are optional and do not require much explanation. The first, NumberAnswers (integer data type) can be used to limit the number of rows retrieved by the query. The next one, Duplicates (logical data type), can be used to eliminate duplicate rows from the answers to be presented. The last one will be explained later in the paper (it has to do with the distinction between lower and upper case letters).
In Figure 9 we simplified the name of the airports and removed all blank spaces for the sake of the explanation (as we will see later, we can use capital letters and blank spaces with some restrictions). The function returns True (not visible in the figure) since there is a flight between Heathrow and Tokyo (via FrankFurt).
In the next example, we ask where we can go if we leave from Heathrow. The question mark indicates that Destination is not a constant (a specific airport) but a variable that will become instantiated, in the answers, with all airports that match the query. The function returns the number five and presents the five flights. Notice that the query returns all flights (direct and indirect). The first row corresponds to the new table name (flight), the name of the columns come in the second row, and the first row retrieved from the database is the third row of the result. For example, row <heathrow charlesdeGaulle> corresponds to a long flight with two connections: heathrow – frankfurt – tokyo – charlesdeGaulle.
Figure 12 – Flight example without duplicates
Notice that the function in Figure 12 only returns five rows because the Duplicates parameter is set to false (no duplicates). Since there are two different alternatives to arrive to Frankfurt, the result will have duplicated rows. Figure 13 exemplifies this case, exactly with the same query but with the Duplicates parameter set to true. As we try to illustrate in the figure, after the query is executed, the returned rows are automatically highlighted.
It is important to understand that if one row that affects the function is changed (cells from the database, the rules or the query), the results of the function are automatically recalculated.
Figure 13 – Flight example with duplicates
Prolog makes a clear distinction between lower and upper case in what regards the first letter of a symbol (e.g., predicate name or argument). Uppercase first letter is used to represent variables; lower case first letter specifies an alphanumeric constant. Predicates names must start with a lowercase letter. In Prolog, if the user wants to have a constant that starts with a capital letter the constant must be enclosed within the single quote characters, ‘England’ for example. Those distinctions are odd to excel Microsoft Excel users, so we hided them from users. The last function parameter (Sensitive) may have two possible values: 0 and 1. The zero value means that data will be treated exactly as it was written in cells, which means that the strings starting with capital letters in the database will be treated as constants. Otherwise, before the query is processed by Prolog, all first letters will be replaced with lower case letters.
In Figure 14 the query returns True because the zero value was used for the parameter Sensitive. Consequently, in the internal prolog database the fact stored is the following directflight(frankfurtMain, tokyo, klm), and not as it is written in excel (directflight(frankfurtMain, Tokyo, klm). If the parameter had the value (1) the result would only continue to be True if the question were changed to flight(heathrow, Tokyo). In that scenario, if we want to use constants beginning with an uppercase letter in the rules, the variables must be preceded with the dollar ($) character ($Tokyo, for example).
Figure 14 – Flight example with capital letters
Figure 15 – Flight example with blank spaces
In Figure 15 one can see that blank spaces can be used in the database (in the facts and as well as in the column names), and in the question. However they cannot be used in the table name and in the predicates name.
3 System Architecture
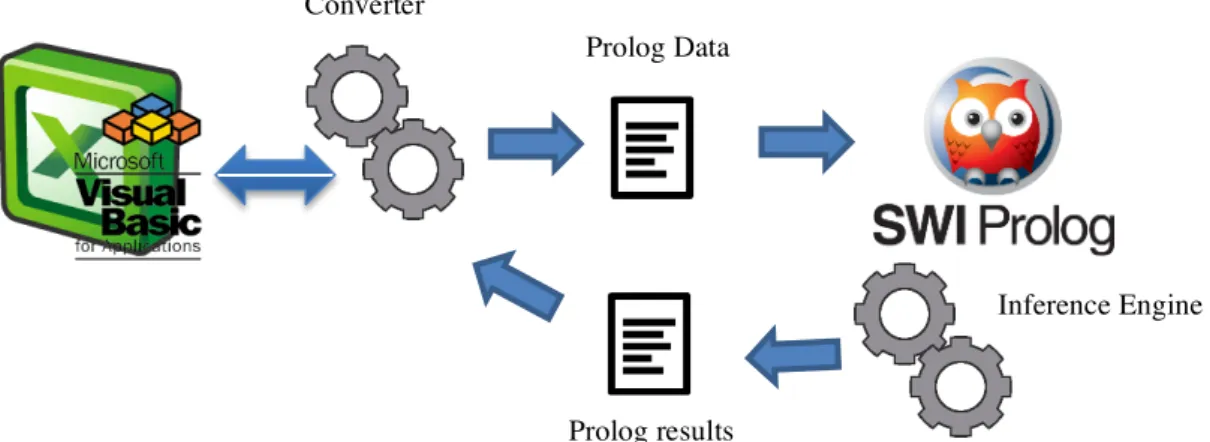
Technically, Prolog Query is essentially a sophisticated Microsoft Excel interface to Swi-Prolog. All data required for a PrologQuery function invocation is collected from the spreadsheet. Prolog is only used to process the queries. Used data and definitions are not stored in Prolog internal database after the query has been processed and answered. When the PrologQuery function is executed in the spreadsheet the following steps take place (see Figure 16):
a) The facts, rules and the query are converted to the prolog syntax;
b) After the conversion, the facts, rules and query are written in a temporary file created by the plug-in (in the current user folder);
c) Swi-Prolog is automatically executed via command line (transparent to the user); d) Swi-Prolog imports the temporary file and executes the query;
e) Swi-Prolog output in written in a temporary file in the same location; f) Data is imported to excel and the temporary file removed;
g) Data is displayed in the spreadsheet.
Any user spreadsheet may contain any amount of tables and definitions to be processed by Prolog. Users can submit all kinds of queries to Prolog, using the whole prolog potential. Notice that, unlike the data in the database range, the data placed in the rules range is “sent” to prolog without conversion. A complete prolog program can be placed in the rules range. But the most important feature is the spreadsheet interface that we supply to Excel users. They do not need to understand prolog language in order to naturally work with powerful queries.
Figure 16 – Prolog Query Architecture
To work with the spreadsheet it is mandatory to have Swi-Prolog and a Java (JRE) installed in the same machine. The tool only uses the current user folder and needs to access the global environment system variable PATH.
4 Exploring Prolog Query features with business examples
In the present section we illustrate how our tool exceeds Microsoft Excel limitations, providing easy spreadsheet support to some basic queries.
4.1 Product Sales Scenario
In Figure 17 we come back to the example presented in the first section, namely to queries whose filtering criteria concerns more than one row in a table.
In the example, since one invoice can include more than one item, the user can be interested in retrieving invoices for a specific product that do not include other specified products (for instance, to assess the success of specific selling policies).
Prolog Data
Prolog results
Inference Engine Converter
Figure 17 - Product Sales Example
Considerer the following query: who are the salesmen that have coffee sales that don’t include sugar? That kind of query cannot be made easily using Microsoft Excel features. The fact that one invoice is described in more than one row prevents a solution based on Pivot Tables or filtering. In the next figure we illustrate a possible implementation using standard Excel.
Figure 18- Product Sales Example with standard Excel
The bottom table (Salesmen that have coffee sales that don’t include sugar) is a kind of temporary table built from the other two. Data in columns C, D, E, F and G is automatically filled based on the following formulas:
C13 -> =COUNTIFS(B$4:B$9;B13;D$4:D$9;$C$12) D13 -> =COUNTIFS(B$4:B$9;B13;D$4:D$9;$D$12) E13 -> =IF(AND(C13>0;D13=0);"x";"")
F13 -> =IF(E13="";"";VLOOKUP(B13;B$4:F$9;5;0)) G13 -> =IFERROR(VLOOKUP(F13;H$5:J$7;2;0);"")
The “cond.” column (E13) is used to mark the rows that satisfy the query (coffee without sugar) with an “X”. We can apply filters to the table in order to only display the desired rows (where cond. = “X”).
This solution is not flexible at all. Let us assume that now the user wants to have queries based on other products: the user should have a column for each product, which is impracticable. Users should have a practical way to quickly and easily obtain exploratory data analysis. For example, the user can be interested in knowing the total amount of invoices that only sells secondary products (sugar and sweetener). A new temporary table can be built, similar to the previous one, but that is too much work for a simple query.
PrologQuery provides a much simpler solution, as we illustrate in Figure 19.
The user only has to define two rules (we choose to use ‘and’ instead of ‘,’ to represent conjunctions, since its more intuitive and both syntaxes are correct):
The following,
/* An invoice corresponds to a coffee sales that does not include sugar if one of its rows corresponds to coffee and none of its rows pertains to sugar. */
invoicecoffeewithoutsugar(Number):- invoicetable(Number,_,coffee,_,_) and not((invoicetable(Number,_,sugar,_,_))) and a second one
/* salesmen has coffee sales that do not include sugar if he is associated to an invoice that corresponds to a coffee sales that does not include sugar */
salesmaninvoicescoffeewithoutsugar(Name):- invoicetable(Number,_,_,_,Salesman)and invoicecoffeewithoutsugar(Number)and salesmantable(Salesman,Name,_)
Figure 19 - Product Sales Example using PrologQuery
The query salesmaninvoicescoffeewithoutsugar(?Name) finds only one solution (1) and displays the corresponding name ‘Philip’.
In Figure 20 we present the solution to the second considered query: the total amount of invoices that only sells secondary products.
The previous two rules are now replaced by a single one (‘;’ means OR): salesSecondaryProducts(Value):-
invoicetable(_,_,sugar,Value,_); invoicetable(_,_,tea,Value,_)
Figure 20 - Product Sales Example with PrologQuery (cont.)
In order to obtain the total amount of sales it is sufficient to use a sum function to computes the three values, returning 3794. Users may have sheets with PrologQueries and original Excel formulas.
Notice that the Or (;) is optional, the same rule can be written in the following way (two expressions):
salesSecondaryProducts(Value):- invoicetable(_,_,sugar,Value,_) salesSecondaryProducts(Value):- invoicetable(_,_,tea,Value,_)
4.2 Performance evaluation, a recursive scenario
In Figure 21 we can see some data from an employee table imported from a database. The first row should be read in the following way: John is one of Ann’s subordinates, he works in the accounting department and he has been evaluated with an eight (in a ten point scale). The data in the table reflects a hierarchical structure, like an organization chart, in which Ann and Paul are on the top of the tree.
Figure 21 – Employee Table
Let us assume that the final Evaluation Score of each employee is a combination of his or her own score (fourth column), with the average evaluation of all his or her subordinates (including the subordinates of his subordinates and so on).
Using Excel built in functions it is not possible to add a computed column that calculates the desired value. The AVERAGEIF function placed on a row can only calculate the average of the direct subordinates. For example, if the function is placed on the first row (=AVERAGEIF(G$13:G$24;G13;I$13:I$24)), it will return 7.5, the average of the evaluations of John and Peter (Figure 22)
Figure 22 – Performance Evaluation with Standard Excel
In order to get the average of all subordinates, it is necessary to extract them first, and then use the usual average function. In Figure 23 we exemplify how it can be done with PrologQuery.
In the solution we use a rule defined in two steps. One employee A is superior of a second one B, in the hierarchical structure, if (i) A is direct superior of B (first part); or, A is a direct superior of another employee that is superior of B (second part). The rule is the following one:
superior(EmployeeName,ChiefName,Evaluation):-employee(EmployeeName,ChiefName,_,Evaluation)
superior(EmployeeName,ChiefName,Evaluation):-employee(EmployeeName,Person,_,_)and superior(Person,ChiefName,Evaluation)
Figure 23 - Performance Evaluation using PrologQuery
The query (superior(?Subordinate,Ann,Evaluation)) returns eight rows. Having the results, we just need to add a trivial average function to get the desired result: 6.75. Let us consider a different but similar query: what is the average evaluation of the employees on the second level of the organizational structure?
In order to apply the average function we need first to define what second level employees are. The definition in PrologQuery is the following one:
secondLevelEmployee(Employee):-
employee(Employee,Chief,_,_) and not(employee(Chief,UpperChief,_,_))
Informally, someone is a second level employee if he or she has a chief that does not have a chief, in turn. Having that rule we can have a query that returns all second level employees and their evaluation.
secondLevelEmployee(Employee)and employee(Employee,_,_,Evaluation)
Figure 24 - Performance Evaluation using PrologQuery (cont.)
This example can be generalized to all situations where we need to compute aggregate values, but the decomposition of rows is not explicitly represented. Another application example would be the computation of aggregate sales of geographical sales distribution (computation of values per region, states, cities/…).
5 Related Work
Since the late 80s there have been several attempts to develop Logic (or Deductive) Spreadsheets that combine traditional features with reasoning capabilities.
One of the oldest, LogiCalc [Kriwaszek, 1988], follows an approach similar to the one presented in this paper: an attempt to integrate Prolog power into Microsoft Excel. However LogiCalc has some limitations, like the impossibility to have disjunctions and a weak and unintuitive interface with users (Tuples were held in a single cell, as opposed to displaying each component of a tuple in a separate column).
In 2004 DARPA (Defense Advanced Research Projects Agency, EUA) promoted an event (Small Business Innovation Research) in which several deductive spreadsheet have been presented. As a consequence, four projects appeared: NEXCEL [Cervesato, 2007], LESS [Valente et al., 2007], XcelLog [Ramaskrishnan et al., 2007] and [Tallis et al., 2007]. All those systems aimed to enrich Microsoft Excel features. DARPA wanted to use those spreadsheet tools for military purposes, namely, to support quick decisions in critical situations.
It is important to refer that none of these is available. We exchanged emails with the authors of three of them, but we only had access to one demo (the demo runs over Google Spreadsheet so its far from having Microsoft Excel functionalities). What we know about them is what is described in the referred papers.
XcelLog represents rules with Datalog [Maier and Warren 1988], a declarative logic
programming language similar to Prolog (syntactically, it is a subset of Prolog, with no functional symbols). Excel works as a front end for writing rules and data. The evaluation of the queries is made through XSB in the backend. XSB (Extended Stony Brook)2 is a Logic Programming and Deductive Database system for Unix and Windows, whose development started in the Stony Brook University [Sagonas, Swift and Warren 1994]. The way the users write the rules in Excel is exemplified in the following illustration.
Figure 25 - An XcelLog Example [Ramaskrishnan et al. 2007]
Italic expressions written in cells represent users’ intents (what users wants, the “rules”), and expressions in braces represent the results of the “rule”. For example, rule number 3 says that all IEEE members are preferred clients of ORG. Amy and Joe is the result of the Rule. XcelLog use those special cells where users can “write” the rule and, simultaneously, get the results.
Nexcel also relies on Datalog to support the deductive engine. The authors developed a
specific Datalog adaption. Nexcel has an add-on developed in Visual Basic for applications that connect Microsoft Excel with the Deductive Engine. The authors gave special attention to the ability to supply explanations of the inference results to the user. The prototype we had access to was so limited (based on a Google Drive Spreadsheet tool) that it is not possible to analyze the user interface and functionalities. Once again, Microsoft Excel wasn’t the chosen spreadsheet.
LESS is built on top of Microsoft Excel. A custom-built middleware was developed to
provide access to logic reasoning functionality supported by PowerLoom3 . PowerLoom is a logic-based knowledge representation and reasoning system based on a variant of KIF (Knowledge Interchange Format). Users can add formulas to the spreadsheet in order to express relational information. Those relations are stored in PowerLoom as a set of assertions that can be furthermore retrieved by other formulas. Consider the example presented in the following figure.
Figure 26- Time Schedule Example
In Microsoft Excel, the Total formula (line 6) is calculated by a SUM function (=SUM(B3:B5)). With LESS the user can place the following formula in top of each
column: =ASSERTMULTI(“hours”, $A$3: $A$5, B2, $A$1) and, for the given example, the
following assertions will be created:
(hours A3 B2 A1) = (hours “Fred” Jan-05 “Task 1”) =12 (hours A4 B2 A1) = (hours “Wilma” Jan-05 “Task 1”) = 4 (hours A5 B2 A1) = (hours “Barney” Jan-05 “Task 1”) = 10 Furthermore, the following formula can be placed anywhere in the spreadsheet:
=SUM (RETRIEVEALL “(hours ?person Jan-05 “Task 1”)”)) In [Tallis et al., 2007] a different approach is proposed, this one using, alternatively, Prolog, Jess (a rule engine that implements the Rete algorithm), or KAON2 (an inference engine that manages Ontologies). We have not found any example or
application of this approach, but according to authors, one of its major strengths is the ability to use a semantic representation (OWL, for instance) of the knowledge base. Other approaches have been proposed, namely PERPLEX [Spenke and Beiken 1989], Knowledgesheet [Gupta and Akhter, 2000], CSSOLVER [Felfernig et al., 2003] and PrediCalc [Kassoff et al., 2005]. None of them is based on Microsoft Excel or in Prolog. We have not found, in the literature, any ready to use solution that integrates Microsoft Excel with Prolog Language. As we briefly presented in this section, there have been several attempts to integrate both technologies, some of them proposing very powerful features, but none fulfills our need: to have natural integration to integrate spreadsheet users with low computer science skills should have a natural and easy way to realize those queries within the spreadsheet itself
We found a vba Module, created by Dipak Audy, that connects Swi-Prolog and Excel, (https://friendpaste.com/3aNELWiC1ed4bzApDhYIPl)). We try to use it but it has too many limitations in what regards the Excel usability (namely the use of copy/paste, column names). It’s wasn’t exactly an integrated approach, but more a technical way to connect and transport data between Excel and Swi-Prolog.
6 Future Directions
In the paper we present the first version of the Prolog Query Tool. There are still improvements to be done. It is important that the tool is used and tested by Microsoft Excel advanced users. Their feedback is important since they are our priority users. The current version has some limitations that we intend to address in the next version. For example, it is not yet possible to have more than one active Query Prolog function for each spreadsheet. Also, lists aren’t yet properly treated in the spreadsheet: when prolog returns a list of values, the result is placed in only one cell.
Using a file for data communication works for now, but is not the best solution. We intent to use a DLL for a direct communication.
7 References
[Cervesato 2007] Cervesato, Iliano. 2007. NEXCEL, A deductive spreadsheet. In The Knowledge Engineering Review (2007), 22:221-236 Cambridge University Press Copyright © Cambridge University Press 2007 doi:10.1017/S0269888907001142 [Clocksin and Mellish 2003] Clocksin, W.F.; and Mellish, C.S. 2003. Programming in Prolog. Using the ISO Standard. Springer-Verlag. ISBN 3-540-00678-8
[Date and O'Reilly 2009] Date C. J.; and O'Reilly. 2009. SQL and Relational Theory. Publisher: O'Reilly Media . IBSN: 978-0-596-52306-0
[Felfernig et al. 2003] Felfernig, A; Friedrich, G.; Jannach D; Russ C.; and Zanker M. Developing Constraint-Based Applications with SpreadsheetsIn Developments. in Applied Artificial Intelligence: 16th International Conference on Industrial and Engineering Applications of Artificial Intelligence and Expert Systems, IEA/AIE 2003 Loughborough, UK, June 23–26, 2003 Proceeding, Springer Berlin Heidelberg
[Gupta and Akhter 2000] Gupta, G.; and Akhter, S. 2000. Knowledgesheet: A graphical spreadsheet interface for interactively developing a class of constraint programs. in Proceedings of the Second International Workshop Practical Aspects of Declarative Languages, Springer Verlag LNCS 1753, Boston, MA.
[Kassoff et al., 2005] M. Kassoff, L.-M. Zen, A. Garg; and Genesereth M. 2005. Predicalc: A logical spreadsheet management system. In 31st International Conference on Very Large Databases (VLDB)
[Kriwaszek 1988] Kriwaszek, F. 1988. LogiCalc – A PROLOG Spreadsheet. in D. Michie and J. Hayes, Machine Intelligence 11, 1988.
[Maier and Warren 1988] Maier, D.; and Warren, D.S. 1988. Computing with Logic. Benjamin/Cummings. Menlo Park, California. ISBN10: 0805366814
[Ramaskrishnan et al., 2007] Ramakrishnan, C. R.; Ramakrishnan, I. V.; and Warren, D. S. 2007. XcelLog: A deductive spreadsheet system. The Knowledge Engineering Review, 22(03), 269–279.
[Sagonas, Swift and Warren 1994] Sagonas, K.; Swift, T.; and Warren, D.S. 1994. XSB as a Deductive Database. In Proceedings of the SIGMOD '94 ACM International Conference on Management of Data. ACM New York, NY, USA. DOI: 10.1145/191839.191970
[Spenke and Beiken 1989] Spenke, M.; and Beilken, C. 1989. A spreadsheet interface for logic programming, in ‘CHI ’89: Proceedings of the SIGCHI conference on Human Factors in Computing Systems’, ACM Press, pp. 75–80.
[Tallis et al. 2007] Tallis, M.; Waltzman, R.; and Balzer, R. 2007. Adding deductive logic to a COTS spreadsheet. The Knowledge Engineering Review, 22(03), 255–268. [Valente et al. 2007] Valente, A.; van Brackle, D.; Chalupsky, H.; andEdwards, G. 2007. Implementing logic spreadsheets in LESS. The Knowledge Engineering Review, 22(03), 237–253.
[Wielemaker et al 2012] Wielemaker, J.; Schrijvers, T.; Triska, M.; and Lager, T. 2012. SWI-Prolog. Theory and Practice of Logic Programming 12(1-2):67-96. DOI: http://dx.doi.org/10.1017/S1471068411000494