I
Universidade de Trás-os-Montes e Alto Douro
Positional Synchronization and Performance in
Football Teams
Dissertação de Mestrado Internacional em Análise da
Performance Desportiva
José Manuel Marques Gomes
Orientador: António Jaime Eira Sampaio
Coorientador: Bruno Gonçalves
II
Universidade de Trás-os-Montes e Alto Douro
Positional Synchronization and Performance in
Football Teams
Dissertação de Mestrado Internacional em Análise da
Performance Desportiva
José Manuel Marques Gomes
Composição do Júri:
Catarina Isabel Neto Gavião Abrantes
Luís Miguel Teixeira Vaz
António Jaime Eira Sampaio
III
Declaração
Nome: José Manuel Marques Gomes Cartão de Cidadão nº: 14839031 Telemóvel: (+351) 911570055
Correio Eletrónico: [email protected]
Designação do Mestrado: Mestrado Internacional em Análise da Performance Desportiva Título da Dissertação: Positional Synchronization and Performance in Football Teams Orientador: António Jaime da Eira Sampaio
Coorientador: Bruno Gonçalves Ano de conclusão: 2018
Declaro que esta dissertação de mestrado é o resultado de uma pesquisa e trabalho pessoal efetuada por mim e orientada pelos meus supervisores. O seu conteúdo é original e todas as fontes consultadas estão devidamente citadas no texto e mencionadas na bibliografia final. Declaro ainda que este trabalho não foi apresentado em nenhuma outra instituição para a obtenção de qualquer grau académico.
Vila Real, Outubro de 2018 José Manuel Marques Gomes
IV
V
Agradecimentos
Em primeiro ligar agradeço à minha Família, porque sem eles isto não seria possível. Obrigado pelo apoio constante, por me oferecerem a possibilidade de ser cada vez melhor e me proporcionarem um futuro melhor.
A todos os Amigos que Vila Real me deu, por todas as experiências e lições que com eles vivi e me fizeram uma melhor pessoa. Durante três anos, conheci pessoas incríveis, vivi momentos que pensei nunca experienciar e que deixaram uma enorme e significante marca na minha vida.
Ao Zé, ao Tiago e à Joana por terem partilhado comigo o percurso que este mestrado nos
ofereceu. Foram dois anos de experiências únicas, repletos de aventuras e desafios constantes. Partilhamos momentos ímpares e especiais que me fizeram crescer como pessoa e profissional. São dois anos da minha vida que guardarei na minha memória com especial carinho.
To all my IMPAS classmates, from Germany, to Portugal and Lithuania, for this amazing experience. I have never expected to meet people like you, thank you!
A todo o staff do FC Stumbras Kaunas, pela oportunidade de estagiar num clube de tal envergadura e com excelentes profissionais. Um especial apreço pelo Professor Mariano
Barreto, Treinador João Luís, Treinador Luís Guilherme, Treinador Sérgio Louro e Fisioterapeuta Artur Pereira, por toda a disponibilidade e partilha.
Ao Professor Doutor Nuno Leite, pela oportunidade de ingressar neste mestrado que tanto me ajudou a evoluir como pessoa e profissional.
Aos meus orientadores, Professor Doutor Jaime Sampaio e Professor Doutor Bruno
Gonçalves, por toda a disponibilidade, orientação e conselhos na elaboração deste trabalho.
VI
Abstract
Positional data is collected using automatic tracking systems and have been used to understand how the location of each player varies in the pitch throughout a football match. These data can be used to assess players’ movement synchronization. The aim of this study was to identify the relation between movement synchronization and match statistics, so as to investigate the behavior of positional synchronization towards the match according to opponent level. The sample included 12 matches from a professional football team (season 2016/2017). Positional data was retrieved using 20Hz TRACAB System and processed in MATLAB® (The MathWorks Inc., Natick, MA, USA). Players’ movement synchronization was quantified by calculating the relative phase of all dyads of outfield teammates during the entire match and for a time window of 1-min and 5-min, for both displacement axes. Notational analysis was carried using LongoMatch – Sports Video Analysis Software. Correlation analysis was used to test the relationship between positional synchronization variables and notational variables. The intra-team synchronization data were considered as dependent variables and compared according to the levels of opposition (stronger and weaker opponents). One-way ANOVA was used to compare notational variables and the percentage of time of dyadic synchronization according to opposition level. Univariate ANCOVA analyzed the relationship between positional synchronization values and notational variables, using opponent level as co-variable. Opponent level applied differences in positional synchronization. Pass efficacy (%) was negatively related to longitudinal and latitudinal synchronization. The number of accurate passes were highly related to players’ synchronization. Latitudinal synchronization showed to be highly positively related to the number of wrong passes. Higher values of accurate passes and consequently pass efficacy were observed when the team registered similar levels of latitudinal and longitudinal synchronization. A higher number of wrong passes were observed when latitudinal synchronization presented higher values and longitudinal synchronization lower values. Pass efficacy (%) showed differences according to the synchronization groups, but not according to the opponent level. These findings suggest that players must move synchronized towards the goal and vary their movement in a parallel axis to the goal, in order to increase the odds of successfully passing the ball to their teammates.
VII
Resumo
Dados posicionais são recolhidos usando sistemas de rastreamento automáticos e têm sido usados para perceber como a localização de cada jogador varia no campo ao longo de um jogo de futebol. Estes dados podem ser usados para avaliar a sincronização dos movimentos dos jogadores. O objetivo deste estudo foi identificar a relação entre a sincronização do movimento e estatísticas de jogo, assim como investigar o comportamento da sincronização posicional no jogo de acordo com o nível do oponente. A amostra incluiu 12 jogos de uma equipa de futebol profissional (época 2016/2017). Os dados posicionais foram recolhidos usando o Sistema TRACAB 20Hz e processados no MATLAB® (The MathWorks Inc., Natick, MA, USA). A sincronização dos movimentos dos jogadores foi quantificada através do cálculo da fase relativa de todos os pares de jogadores durante o jogo e numa janela de 1 e 5 minutos, para ambos os eixos. A análise notacional prosseguiu com o uso de LongoMatch – Sports Video Analysis Software. A análise de correlações foi usada para testar a relação entre variáveis de sincronização posicional e de análise notacional. Os dados de sincronização intra-equipa foram considerados como variáveis dependentes e comparadas de acordo com o nível de oposição (adversários fortes e fracos). O one-way ANOVA foi usado para comparar variáveis notacionais e a percentagem de tempo de sincronização par de acordo com o nível de oponente. O univariate ANCOVA analisou a relação entre valores de sincronização posicional e variáveis notacionais, considerando o nível de oponente como co variável. O nível de oponente implicou diferenças na sincronização posicional. A eficácia de passe (%) estava negativamente relacionada com a sincronização longitudinal e latitudinal. O número de passes corretos esta consideravelmente relacionado com a sincronização dos jogadores. A sincronização latitudinal mostrou ser consideravelmente e positivamente relacionada com o número de passes errados. Valores mais elevados de passes corretos e eficácia de passe, consequentemente, foram observados quando a equipa registou níveis similares de sincronização latitudinal e longitudinal. Um número elevado de passes errados foi observado quando a sincronização latitudinal apresentou valores mais altos e a sincronização longitudinal valores mais baixos. A eficácia de passes (%) demonstrou diferenças de acordo com os grupos de sincronização, mas não de acordo com o nível de oponente. Estes descobrimentos sugerem que os jogadores devem-se mover sincronizados em direção à baliza e variar o movimento no eixo paralelo às balizas, de modo a aumentar as chances de passar a bola para os colegas de equipa.
VIII Index Introduction ... 1 Methods ... 7 Sample ... 7 Procedures ... 7 Statistical Analysis ... 7 Results ... 9 Discussion ...14
Conclusions and Practical Implications ...17
IX
Table Index
Table 1. Positional synchronization related articles mentioned in the literature review. ... 4
Table 2. Correlation between longitudinal/latitudinal synchronization (%) and notational
variables (interceptions, chances created, pass efficacy (%), accurate passes and wrong passes). ... 11
Figure Index
Figure 1. Longitudinal and Latitudinal Synchronization (%) distribution according to the
opponent level. ... 9
Figure 2. Variation of mean differences in Longitudinal and Latitudinal Synchronization
percentage throughout a football match. ... 10
Figure 3. Variation of SD (Standard Deviation) differences in Longitudinal and Latitudinal
Synchronization percentage throughout a football match. ... 10
Figure 4. Clustering groups association between Pass Efficacy (%), Accurate Passes and Wrong Passes with the respective synchronization groups. latitude – group with the
highest values of latitudinal synchronization; longitude – group with the highest values of longitudinal synchronization; other – group with undifferentiated values of latitudinal and longitudinal synchronization. ... 12
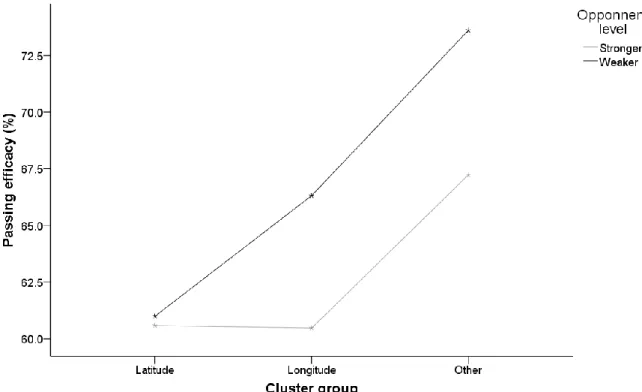
Figure 5. Clustering groups association between Passing Efficacy (%) and the respective synchronization groups, according to the opponent level. latitude – group with
the highest values of latitudinal synchronization; longitude – group with the highest values of longitudinal synchronization; other – group with undifferentiated values of latitudinal and longitudinal synchronization. ... 13
X
Abbreviations List Min - Minutes
SD – Standard Deviation
Lat% - Latitudinal Synchronization Percentage Long% - Longitudinal Synchronization Percentage
1
Introduction
Football is a team sport where two opposing teams dynamically interact in order to gain an advantage over the other team (McGarry, Anderson, Wallace, Hughes & Franks, 2002). Considering this, the observation and assessment of individual and collective performance are important procedures if certain goals are aimed to be achieved. In this context, performance has a multidimensional setting (Casal, Maneiro, Ardá, Marí & Losada, 2017) and it should be understood in terms of space-time interaction dynamics and not only in terms of the players’ individual actions and/or time-motion demands (Folgado, Duarte, Fernandes & Sampaio, 2014). Analyzing playing behavior is one of the most important tasks a coach must achieve (Franks & Hughes, 2016) and performance analysis is an effective and objective instrument to collect information and identify the most relevant events that occur in the game (Casal et al., 2017). In this way, the assessment of tactical performance through game analysis should seize how players adapt, individually and collectively, to the ever-changing moments of play, aiming to gain an advantage over their opponents (Gréhaigne, Godbout & Bouthier, 1999).
Match analysis has taken a key role in sports (Carling et al., 2009) and, more specifically in football, it aims to understand and clarify in-game patterns, both offensive and defensive. Publications related to match analysis are, usually, confined to the collection of quantitative, qualitative and external indicators of the game (Sarmento, Leitão, Anguera, & Campaniço, 2009). It is important to identify and analyze game models’ specific characteristics - especially those related to offensive behaviors – through the analysis of performance indicators, allowing researchers and coaches to access this data and develop new investigations as well as the training process and the opponents’ analysis (Santos, Moraes & da Costa, 2015). These different variables inherent to competition, their interaction and the difficulty in controlling contextual variables, allow understanding behavioral patterns associated with performance, affecting training planning and aiming to increase individual and collective outcomes (Hughes et al., 2007; Silva et al., 2011).
Performance indicators are used to assess the performance of an individual, a team or elements of a team (Hughes & Bartlett, 2002). Despite that, in most sports, the imperative ones vary from coach to coach (Hughes, Caudrelier, James, Redwood-Brown, Donnelly, Kirkbride & Duschesne, 2012). Nowadays, positional data are starting to have a substantial impact on the assessment of a team’s behavior. As an indicator, positional data can be understood as a functional behavior of a team, where players try to coordinate themselves to gain an advantage over their opponents (Duarte et al., 2013). These data are collected using tracking systems that allow understanding how the position of each player varies in the field throughout the
2 game. The connections between teammates are called dyads and positional synchronization is characterized according to their variation. Dyadic synchronization of players can serve as a relevant performance indicator, being intrateam measures and time-motion demands aiding tools in the contextualization of player performance in team sports (Folgado et al, 2014). Movement synchronization is calculated by the relative phase of players’ displacement (Folgado, Gonçalves & Sampaio, 2017) allowing the quantification of space–time relation between two players’ relative positions time-series (McGarry et al., 2002). Travassos and colleagues (2012) clarified the practical perception of the topic by stating that different patterns of coordination vary between in-phase (near 0°) when two players are moving in the same direction, and anti-phase (180°), when they are moving in opposing directions. Synchronization ranges are collected considering two field directions, latitude and longitude. For instance and considering the first attacking principle in football (penetration - the ability to play through or behind the opposition (Strudwick, 2016)), when the player with the ball runs towards the opponent goal, the whole team must follow him and go forward on the field, translating a collective synchronized movement. This example stays in accordance with earlier studies which demonstrated that synchronized (in-phase) behaviors are used to surpass opponent teams’ organization (Folgado et al., 2014; Folgado, Duarte, Marques & Sampaio, 2015; Siegle & Lames, 2013; Travassos, Araújo, Vilar, & McGarry, 2011; Travassos et al., 2012). Also, changes in synchronization tendencies relate to higher awareness of football principles and developed expertise (Sampaio & Maçãs, 2012), reflecting the fact that higher levels of movement synchronization show better levels of tactical performance (Folgado et al., 2015). Folgado et al. (2014) suggest that considering different speed categories in the assessment of player’s movement synchronization tendencies can also help to clarify its effects in match performance. It has been proved that different speed displacements are associated with individual movement trajectories (Sampaio & Maçãs, 2012; Sampaio, Lago, Gonçalves, Maçãs, & Leite, 2013).
Previous studies associated different performance indicators with team’s synchronized movements, obtaining interesting results. Table 1 summarizes all the positional synchronization related articles stated in the literature review of this document. For instance, it is possible to assess the way a team’s complexity varies throughout a football match. A study that used five different positional variables (surface area, stretch index, team length, team width and geometrical center) demonstrated that, across the game, teams tend to become less complex but have increased magnitudes of variation in their organizational shape (Duarte, Araújo, Folgado, Esteves, Marques & Davids, 2013). The idea follows with the decrement in speed synchronization towards the match, suggesting that players are affected by mental fatigue, due to highly variable contextual situations with consequences on their physical and
3 tactical performance (Gonçalves, Coutinho, Travassos, Folgado, Caixinha & Sampaio, 2018). Also, the opponent’s level can affect the team synchronization, as higher-level teams tend to increase the player’s movement synchronization (Folgado et al., 2014). In this case, a higher synchronization can be expected in the defensive phase of the game (Pinto, 2014). The same author suggested that field zones were not associated with positional synchronization. In a physical and physiological perspective, dyadic synchronization can also be associated with distance covered and heart rate responses, since more synchronized teams cover the same or less distance, happening the same in heart rate responses (Folgado et al., 2017). According to the same author, non-congested fixtures allow teams to be more synchronized proving that performance impairments during congested fixtures surpasses players’ physical response and that their tactical performance must be considered when analyzing teams’ performance. Following these conclusions, the authors suggested that distinct levels of tactical performance may be related to different players’ physical demands during match or training circumstances. As Folgado et al. (2014) stated, integrating time-motion demands and movement synchronization variables together with performance analysis can bring a different insight to teamwork and game dynamics. By integrating notational methods and computational collective measures it is possible to identify long-term patterns in performance dynamics during competition (Sarmento, Clemente, Araújo, Davids, McRobert & Figueiredo, 2018). Team dynamics are constantly changing towards the in-game demands and are affected by the player’s tactical-technical awareness. Tactical principles arise from the logic of the game and are operationalized by players' tactical-technical behaviors (da Costa, da Silva, Greco & Mesquita, 2009). Defensive unity and offensive unity are two principles, stated by the same authors, that are inherent to the match and based on cohesion, effectiveness and functional balance between team's longitudinal and transversal lines (Bauer & Ueberle, 1988). While defending, the main aim of a team is to recover the ball. Intercepting a ball is an individual action in football, that allows the defending team to regain ball possession. This action is influenced by the team defending positioning but can, sometimes, happen due to an opponent’s bad decision or pass. Passing is a football skill (Ali, 2011) and is the most frequent event in a football match (Saal, Zinner, Fiedler, Lanwehr & Krug, 2018). It is the action that connects the players throughout a match. A few studies have discussed the fact that both pass accuracy and the total number of passes may be related to the probability of winning (Castellano & Casamichana, 2015; Liu, Gomez, Lago-Peñas, & Sampaio, 2015). Also, Gonzalez-Rodenas, Lopez-Bondia, Calabuig, Pérez-Turpin & Aranda (2016) stated that the behavior of the opposing team may influence the process of creating chances to score. However, the available studies did not approach the relationship between these variables and positional synchronization. Therefore, there seems to be a gap in the literature when it comes
4 to clarifying, for example, if player positioning may turn intercepting movements easier if pass precision is affected by the teammate positioning and if chances created may be influenced by the athletes positioning. In this perspective, the present study aims to explore interactions between notational analysis variables and positional data at different levels of opposition. Opposition can influence player’s behavior on the pitch (Davids, Araújo & Shuttleworth, 2005) and its quality has been proposed as an important factor associated with match performance indicators (Taylor, Mellalieu, James & Shearer, 2008). For instance, Folgado and colleagues (2014) proved that higher opponent level can promote higher intra-team movement synchronization and increase physical demands. In this way, in-game performance was measured by the quantification of offensive and defensive actions while using positional synchronization data to assess players’ movement displacement. The use of this approach might help to better understand players’ actions and movements during football matches.
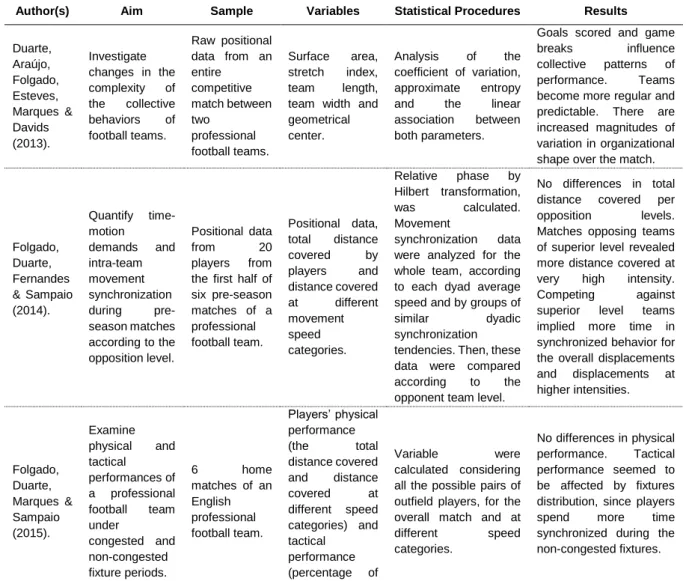
Table 1. Positional synchronization related articles mentioned in the literature review.
Author(s) Aim Sample Variables Statistical Procedures Results
Duarte, Araújo, Folgado, Esteves, Marques & Davids (2013). Investigate changes in the complexity of the collective behaviors of football teams. Raw positional data from an entire competitive match between two professional football teams. Surface area, stretch index, team length, team width and geometrical center.
Analysis of the coefficient of variation, approximate entropy and the linear association between both parameters.
Goals scored and game breaks influence collective patterns of performance. Teams become more regular and predictable. There are increased magnitudes of variation in organizational shape over the match.
Folgado, Duarte, Fernandes & Sampaio (2014). Quantify time-motion demands and intra-team movement synchronization during pre-season matches according to the opposition level. Positional data from 20 players from the first half of six pre-season matches of a professional football team. Positional data, total distance covered by players and distance covered at different movement speed categories. Relative phase by Hilbert transformation, was calculated. Movement synchronization data were analyzed for the whole team, according to each dyad average speed and by groups of similar dyadic synchronization tendencies. Then, these data were compared according to the opponent team level.
No differences in total distance covered per opposition levels. Matches opposing teams of superior level revealed more distance covered at very high intensity. Competing against superior level teams implied more time in synchronized behavior for the overall displacements and displacements at higher intensities. Folgado, Duarte, Marques & Sampaio (2015). Examine physical and tactical performances of a professional football team under congested and non-congested fixture periods. 6 home matches of an English professional football team. Players’ physical performance (the total distance covered and distance covered at different speed categories) and tactical performance (percentage of time of players’ Variable were calculated considering all the possible pairs of outfield players, for the overall match and at different speed categories. No differences in physical performance. Tactical performance seemed to be affected by fixtures distribution, since players spend more time synchronized during the non-congested fixtures.
5 movement synchronization of lateral and longitudinal displacements) Folgado, Gonçalves & Sampaio (2017). Identify changes in tactical, physical and physiological performances in large-sided games during the pre-season. 30 professional football players participated in several GK+8vs8+GK across the first four weeks of the season. Players’ movement synchronization, players’ external and internal load and exercise intensity (%HRmax).
Variables were compared according to the preseason period, players’ positioning and professional
experience.
Training situation promoted similar physiological responses during the first and the last training period. Players revealed to have higher levels of positional synchronization during the last preseason period.
Gonçalves, Coutinho, Travassos, Folgado, Caixinha & Sampaio (2018). Examine whether the speed synchronization and physical performance of an elite football team changed between the first and the second half, using match time blocks of 15-min, and explore the match-to-match variation of players' speed synchronization performance. 28 outfield elite footballers participated in 51 official matches. Positional data, speed and distance covered. Relative phase, by Hilbert transformation, was calculated as well as the match-to-match variation of the players' speed synchronization.
Small to moderate decreases in the % of synchronization were found in the second half periods for the jogging and running speed, while the opposite was found for the walking speed. Small to moderate higher synchronization was found during the first half periods. Small to moderate increases were found in coefficient of variation during jogging
and running displacements Pinto (2014). Examine whether the level of opposition, game phase and field zone influence whole team synchronization. First-halves of six matches of a professional team. Positional data, game phase and dominant field zone.
Cluster phase method was used.
Opponent team level had a major impact on the degree of teams’ synchronization, while the influence of game phase and dominant field zone is very limited. Higher values of team synchronization were found in matches against opponents of similar higher level and in the defensive phases.
Sampaio & Maçãs (2012). Explore how football players’ dynamic positional data can be used to assess tactical behavior. 12 students that were enrolled in football classes in the Sport Sciences, Exercise and Health Department from the University of Trás-os-Montes e Alto Douro (Portugal). Positional data, geometrical center of the team, speed and distance covered.
Approximate entropy and relative phase, by Hilbert transformation, were calculated.
Approximate entropy values were lower in post-test situations suggesting that these time series became more regular with increasing expertise in football. Relative phase post-test values showed frequent periods with a clear trend to moving in anti-phase.
6 Sampaio, Lago, Gonçalves, Maçãs & Leite (2013) To compare time-motion variables, heart rate and players’ tactical behavior according to game pace, status and team unbalance in football 5-a-side small-sided games. 24 male footballplayers. Positional data, speed and distance covered. Randomness in distance to team centroid was measured using approximate entropy values. Differences in time motion variables, heart rate and tactical variables were calculated according to match status and team unbalance. Differences in these variables were identified according to game paces.
Stronger predictor variables of pacing were the randomness in distance to team centroid and the distances covered above13 km h−1. The results also changed according to game status and team unbalance. The strongest predictor variables were the distance covered bellow 6.9 km h−1, distance and randomness to team centroid, with higher values when winning in superiority conditions. Siegle & Lames (2013). Apply the method of relative phase to football, give first results for team-, groups-, and single player-couplings, and discuss the applicability of the method. World Cup Football Final 2006 between France and Italy. Mean longitudinal and lateral positions of all 20 outfield players. Relative phase, by Hilbert transformation, was calculated.
Football is clearly an
in-phase game.
Perturbations of the relative phase structure help to identify scoring opportunities. Travassos, Araújo, Vilar & McGarry (2011). Identify phase attractions between movement kinematics of players and ball and between players themselves in 5-vs-4+GK futsal game practice. 15 male senior players were grouped in 3 teams of 5 players each. Movement trajectories of the ball and players. Relative phase, by Hilbert transformation, was calculated. Defenders demonstrated strong in-phase attractions with the ball and with each other. Weaker phase attractions were observed for the attackers and ball, as well as between attackers themselves. Different coordination dynamics are present in defending and attacking dyads.
Travassos, Araújo, Duarte & McGarry (2012). Investigate the behavioral dynamics of teams in a futsal game when the goalkeeper of the attacking team is substituted for an extra outfield player. 15 male senior players grouped in 3 teams of 5 players each. Movement trajectories of ball and players and length of trials.
Lateral and longitudinal displacements of the ball and both teams, their kinematics expressed in angles and radial distances from the goal center were subjected to relative phase analysis.
Stronger phase relations with the ball for the defending team. Phase relations between each team and ball and between teams themselves, produced greater stabilities in the lateral direction than the longitudinal direction. Phase attractions were most pronounced for the defending team and ball when using angles as a measure of association.
7
Methods Sample
A total of 12 matches from a professional football team from the Season 2016/2017 were analyzed in this study. Matches were played against the 3 top and 3 bottom teams. The studied team finished the season in the third place, meaning that the 3 top teams present in the research were the first, second and fourth qualifiers. During the matches, whenever a substitution took place, one player ceased to be tracked.
Procedures
Positional data was retrieved using 20Hz TRACAB System (www.chyronhego.com) and processed in MATLAB® (The MathWorks Inc., Natick, MA, USA) replicating existing methodological procedures (Folgado, Duarte, Marque, Gonçalves & Sampaio, 2018). Players’ movement synchronization was quantified by calculating the relative phase of all dyads of outfield teammates (n = 45 dyads per team)during the duration of each match and in a 1 and 5 min time window, for both displacement axes. This calculation was based on the Hilbert transform applied to players’ positional time series (Palut & Zanone, 2005). From these results, synchronized movements were quantified as the percentage of time each dyad spent in between −30° and 30° of relative phase (near-in-phase synchronization mode), calculated for each pair of players in each match, for both longitudinal and lateral displacement axes (Folgado et al., 2014). The notational analysis was carried using LongoMatch – Sports Video Analysis Software (www.longomatch.com), by tagging the action variables according to their occurrences. The variables included in the study were: interceptions (intercepting an opponent’s pass and preventing it from reaching its target); chances created (pass that leads to a shot on goal from a teammate); pass accuracy (percentage of passes that successfully reached its target); accurate passes (number of passes that successfully reached its target); wrong passes (number of passes that didn’t reach its target). Data were introduced in a spreadsheet for further statistical processing.
Statistical Analysis
Before the statistical test procedures, the assumptions of normality and homogeneity of variance were verified. Correlation was used to check any relationship between positional synchronization variables and notational variables. Time-motion and intra-team synchronization data were considered as dependent variables and compared according to the
8 two levels of opposition (top and bottom teams). One-way ANOVA was used to compare notational variables and the percentage of time of dyadic synchronization according to opposition level. To understand how the team behaved in the longitudinal and latitudinal axis, a twostep cluster analysis was performed, that resulted in three different clusters: group 1 (group with the highest values of latitudinal synchronization – ~65,3 Lat%, ~82,7 Long%); group 2 (group with highest values of longitudinal synchronization - ~35,6 Lat%, ~90,4 Long%); group 3 (group with undifferentiated values of latitudinal and longitudinal synchronization - ~35,1 Lat%, ~63,3 Long%). Univariate ANCOVA analyzed the relationship between positional synchronization values (dependent variable) and notational variables (independent variables), using opponent level as a co-variable. Mean differences and SD (standard deviation) differences were analyzed for positional synchronization percentages across time.
9
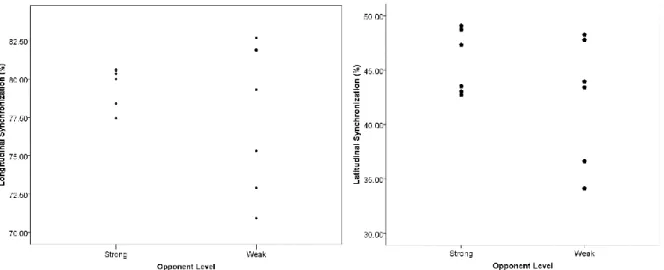
Results
Figure 1 presents the results from the synchronization according to the opponent level. There were differences in longitudinal (F1,1078=6,4 p=0,012) and lateral synchronization (F1,1078=10,9
p=0,001), with higher values obtained by the stronger teams. The weaker team’s results exhibit higher spreading.
10 In figure 2 the results show the differences between confronting teams in longitudinal and lateral synchronization percentages. In longitudinal synchronization, there were differences according to opposition level (F1,1=7,1 p=0,009) but not across the 5 min time periods (F1,17=0,7
p=0,746) neither in the interaction (F1,17=0,7 p=0,817). In lateral synchronization, there were
no differences according to opposition level (F1,1=1,2 p=0,274), 5 min time periods (F1,17=1,0
p=0,479) or the interaction (F1,17=0,7 p=0,768).
Figure 2. Variation of mean differences in Longitudinal and Latitudinal Synchronization percentage
throughout a football match.
The figure 3 presents the standard deviations from the previously presented data, across the 5 minutes periods of the match. The results might suggest that weaker teams show higher SDs in longitudinal synchronization. There seems to be a trend to lower values towards the end of the game.
Figure 3. Variation of SD (Standard Deviation) differences in Longitudinal and Latitudinal
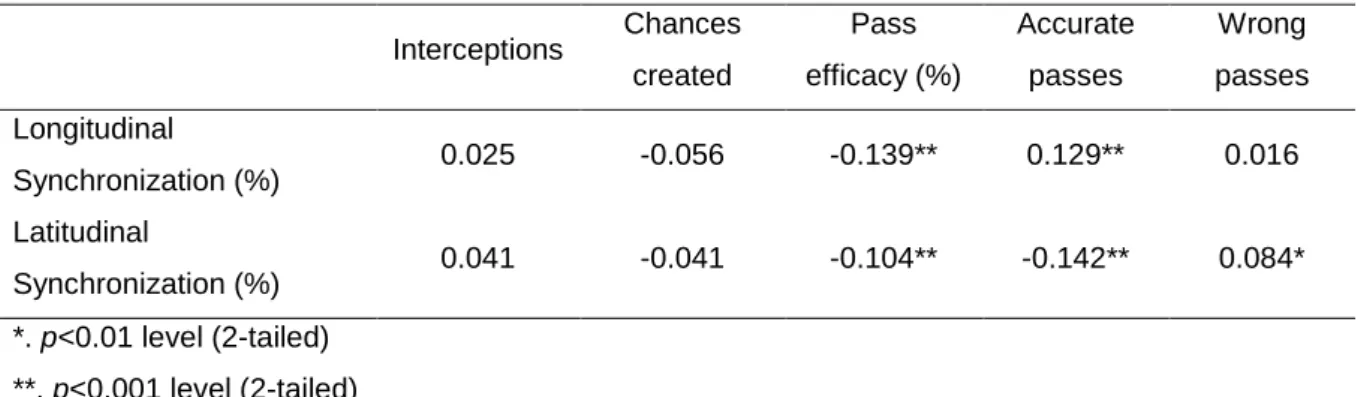
11 Table 2 presents the correlations between notational analysis variables and synchronization values. Pass efficacy (%) was negatively related to longitudinal and latitudinal synchronization (p≤0.001), meaning that when positional synchronization was lower, pass efficacy was higher. The number of accurate passes were also highly related to players’ synchronization (p≤0.001). Their number increased when longitudinal synchronization was higher and latitudinal synchronization was lower. Latitudinal synchronization showed to be highly positively related (p≤0.01) to the number of wrong passes.
Table 2. Correlation between longitudinal/latitudinal synchronization (%) and notational variables
(interceptions, chances created, pass efficacy (%), accurate passes and wrong passes).
Interceptions Chances created Pass efficacy (%) Accurate passes Wrong passes Longitudinal Synchronization (%) 0.025 -0.056 -0.139** 0.129** 0.016 Latitudinal Synchronization (%) 0.041 -0.041 -0.104** -0.142** 0.084* *. p<0.01 level (2-tailed) **. p<0.001 level (2-tailed)
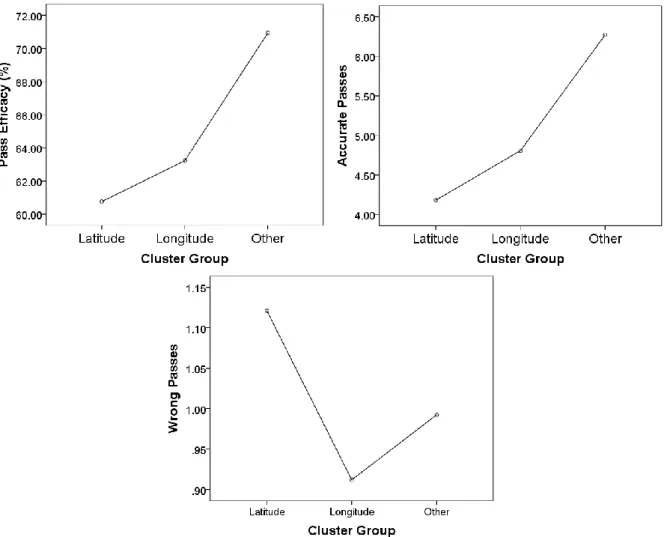
12 Pass efficacy (%) and accurate passes showed highly significant differences between the three synchronization groups (F2,1077=7,742 p=0.000; F2,1077=17,136 p=0,000). As seen in figure 4,
higher values of accurate passes and consequently pass efficacy were observed when the team registered similar levels of latitudinal and longitudinal synchronization, rather than higher latitudinal neither longitudinal synchronization. Wrong passes were also significantly different between the same synchronization groups (F2,1077=3,667 p=0,026). A higher number of wrong
passes were observed when latitudinal synchronization presented higher values. When longitudinal synchronization was prevailing, wrong passes were lower.
Figure 4. Clustering groups association between Pass Efficacy (%), Accurate Passes and Wrong Passes with the respective synchronization groups. latitude – group with the highest values of latitudinal synchronization; longitude – group with the highest values of longitudinal synchronization; other – group with undifferentiated values of latitudinal and longitudinal synchronization.
13 Figure 5 show the results regarding differences between the synchronization groups. Pass efficacy (%) showed differences according to the synchronization groups (F1,2=6,7 p=0,001),
but not according to the opponent level (F1,1=3,5 p=0,06) as well as the interaction (F1,2=0,7
p=0,507).
Figure 5. Clustering groups association between Passing Efficacy (%) and the respective synchronization groups, according to the opponent level. latitude – group with the highest values
of latitudinal synchronization; longitude – group with the highest values of longitudinal synchronization; other – group with undifferentiated values of latitudinal and longitudinal synchronization.
14
Discussion
The aim of the present study was to relate football specific actions with the players’ movement displacement and how their practical effectiveness could be manipulated. Teams’ synchronization changes with different levels of opposition. It is possible to assume that to overcome higher tactical performance offered by stronger teams, players adopt more similar and precise movements, translating higher and accurate synchronization values. This may be explained by the fact that high-level competing teams have a mutual positive influence on each other synchronization processes (Pinto, 2014) and enhance team responsiveness to lateral ball movements (Yue, Broich, Seifriz & Mester, 2008). Due to these results, it’s possible to agree with the study of Folgado et al. (2014) which concluded that opponent’s level can affect the team synchronization and higher-level teams tend to increase the player’s movement synchronization, displaying better levels of tactical performance (Folgado et al., 2015). On the other hand, when playing against weaker teams, the player’s movement synchronization varies. As speculated by Pinto (2014), players may have different senses of responsibility when facing different team levels, resulting in higher mental concentration and collective engagement when playing against stronger teams, while on the other hand, demonstrating more relaxed attitudes and less commitment in the teamwork during matches against weaker teams and consequently displaying lower levels of synchronization. As a result of accumulated mental fatigue and due to moments of low risk, such as facing weaker opponents, players may oscillate movement synchronization (Folgado et al., 2015). Also, players’ different playing positions can display distinct synchronization patters during the match (Folgado et al., 2014) and together with their in-game role influence team coordination. The time that the teams spend in attacking and the defensive process is not always the same and reflects different cooperating strategies across the match since defensive dyads show a more synchronized behavior than the offensive dyads (Folgado et al, 2018). Higher synchronized behaviors in defensive situations may allow restricting space and time (McGarry, 2009) and prevent from opponent in-depth attacks (Pinto, 2014). These findings allied with other studies suggest that the level of opposition is a contextual variable affecting actual on-field performance (Pinto, 2014).
Longitudinal displacements are the most promoted in the game due to pitch length and goals location (Folgado et al., 2015) and facing different opponent levels can influence a team’s longitudinal synchronization. It shows higher levels of variation when facing weaker teams and more particular values when facing strong opponents, displaying more precise behaviors in the last case. As stated by Gonçalves and colleagues (2018), superior level teams imply a longer time spent in synchronized behavior and, this way, showing less variation compared to
15 weaker opponents. Following the previous thoughts of Pinto (2014), the noticeable variation in longitudinal synchronization when playing against weaker teams can be explained by the fact that players can be less focused and committed to teamwork, by knowing that the opponents are weaker. On the other hand, opponent level didn’t show any influence on lateral synchronization. In general terms, positional synchronization values get lower towards the end of the match. The first half of the match characterizes the highest positional synchronization values of the match, which decrease during the second half period (Gonçalves et al., 2018). This seems to be aligned with the exercise intensity of football players, which declines in periods during the match, occurring mostly in the initial phase of the second half towards the end of the match most likely due to fatigue (Mohr, Krustrup & Bangsbo, 2005). Gonçalves et al. (2018) defends that players are affected by mental fatigue, due to highly variable contextual situations with consequences on their physical and tactical performance. It is also clear that the game break is an influenceable moment of the match, affecting collective patterns of performance (Duarte et al., 2013).
When players move synchronized towards the goal the number of accurate passes increases, which agrees with the aim of the match – the team moves towards the opponent goal so that shots can be taken (Franks & Hughes, 2016). When the movements are not synchronized parallel to the goal line, accurate passes increase due to a superior level of dispersion during the attacking phase (with ball possession) and the consequent increase of the interpersonal distances between team members (Pinto, 2014). The idea is strengthened by the clarifications of Folgado and colleagues (2018), which stated that lower levels of synchronization may result in more scoring opportunities. In practice, when players move laterally synchronized team compactness increases, leading to an increase of opponents in that specific area and reducing the chance to successfully pass the ball to a teammate or shot on goal. We can assume that players increase their chance of successfully pass the ball to their teammates when irregular movements occur in order to break the opponents defensive organization (Gonçalves, Figueira, Maçãs & Sampaio, 2013). This stays in accordance with some of the key characteristics to successfully pass the ball to a teammate – to approach the colleague in order to receive the ball and move after passing the ball. According to Frencken and colleagues (2012), changes in lateral displacements are related to opponent’s sideway passes, influencing the way players deal with specific game situations. Following the previous interpretation, players miss more passes (wrong passes increase) when movements are synchronized parallel to the goal line. In sum, efficiency in the attacking process implies low lateral synchronization values, while on the defending process lateral synchronization values are higher in order to perform better.
16 Following the previous thoughts and moving on with the enlightenment, positional synchronization values can influence the players’ pass efficacy, but opponent level cannot. Higher pass efficacy can be achieved when similar values of synchronization are achieved, regardless of the opponent level.
17
Conclusions and Practical Implications
Players must move synchronized towards the goal and vary their movement in a parallel axis to the goal, in order to increase the odds of successfully passing the ball to their teammates. This study reached the conclusion that to increase pass efficacy, teams should be worried with maintaining a consistent synchronization, rather than being more synchronized latitudinal than longitudinal and vice-versa. The remaining notational variables (interceptions and chances created) didn’t show any specific relation to the involving study environment.
This study’s sample involved a professional football team, meaning that professional and quality players were part of the study. The fact that higher-level players have better positioning and increased decision abilities (Kannekens et al., 2011) may allow the team to reach and maintain high levels of synchronization (Fradua et al., 2013).
Assessing a team’s synchronization can help clubs technical staff evaluating their tactical performance throughout the season by quantifying players’ synchronization during the matches, providing objective measures to support coaches’ decisions (Folgado et al., 2018). It can also bring a new insight into performance analysis in football, since spatiotemporal relationships formed by players during matches may explain some behaviors that notational analysis cannot measure (Sarmento et al, 2018). By combining both approaches, it is possible to widen the studying possibilities and to reach new conclusions regarding the non-stopping football development.
Since two notational variables (interceptions and chances created) did not offer specific conclusions, different methods should be used in forthcoming approaches. Future studies should consider different match intensities by classifying diverse speed categories. Categorizing positional synchronization according to opponent levels and additionally considering different speed categories could bring new insights into this approach. Other interesting facts that could be involved with the study of positional synchronization are the playing tactics and specific training exercises used. This way it could be possible to associate some tactical components to higher synchronization values. Future investigations should also consider player’s fatigue – by considering internal load throughout matches and accumulated external load according to certain intervals in each match – as a variable that can affect synchronization values.
18
Bibliography
Ali, A. (2011). Measuring soccer skill performance: a review. Scandinavian journal of medicine & science in sports, 21(2), 170-183.
Barreira, D., Garganta, J., Machado, J., & Anguera, M. T. (2014). Effects of ball recovery on top-level soccer attacking patterns of play. Revista Brasileira de Cineantropometria & Desempenho Humano, 16(1), 36-46.
Bauer, G., & Ueberle, H. (1988). Fútbol: factores de rendimiento, dirección de jugadores y del equipo. Martínez Roca.
Carling, C., Reilly, T., and Williams, A. M. (2009). Performance Assessment for Field Sports. London: Routledge.
Casal, C. A., Maneiro, R., Ardá, T., Marí, F. J., & Losada, J. L. (2017). Possession Zone as a Performance Indicator in Football. The Game of the Best Teams. Frontiers in psychology, 8, 1176.
da Costa, I. T., da Silva, J. M. G., Greco, P. J., & Mesquita, I. (2009). Tactical principles of Soccer: concepts and application. Motriz, 15(3), 657-668.
Davids, K., Araújo, D., & Shuttleworth, R. (2005). Applications of dynamical systems theory to football. Science and football V, 537, 550.
Duarte, R., Araújo, D., Folgado, H., Esteves, P., Marques, P., & Davids, K. (2013). Capturing complex, non-linear team behaviours during competitive football performance. J. Systems Science & Complexity, 26(1), 62-72.
Fradua, L., Zubillaga, A., Caro, Ó., Iván Fernández-García, Á., Ruiz-Ruiz, C., & Tenga, A. (2013). Designing small-sided games for training tactical aspects in soccer: Extrapolating pitch sizes from full-size professional matches. Journal of sports sciences, 31(6), 573-581.
Frencken, W., Poel, H. D., Visscher, C., & Lemmink, K. (2012). Variability of inter-team distances associated with match events in elite-standard soccer. Journal of sports sciences, 30(12), 1207-1213.
Folgado, H., Duarte, R., Fernandes, O., & Sampaio, J. (2014). Competing with lower level opponents decreases intra-team movement synchronization and time-motion demands during pre-season soccer matches. Plos one, 9(5), e97145.
Folgado, H., Duarte, R., Marques, P., & Sampaio, J. (2015). The effects of congested fixtures period on tactical and physical performance in elite football. Journal of sports sciences, 33(12), 1238-1247.
Folgado, H., Duarte, R., Marques, P., Gonçalves, B., & Sampaio, J. (2018). Exploring how movement synchronization is related to match outcome in elite professional football. Science and Medicine in Football, 1-7.
Folgado, H., Gonçalves, B., & Sampaio, J. (2017). Positional synchronization affects physical and physiological responses to preseason in professional football (soccer). Research in Sports Medicine, 1-13.
Franks, I., & Hughes, M. (2016). Soccer Analytics: Successful Coaching Through Match Analysis. Meyer & Meyer Sport.
Gonçalves, B. V., Figueira, B. E., Maçãs, V., & Sampaio, J. (2013). Effect of player position on movement behaviour, physical and physiological performances during an 11-a-side football game. Journal of Sports Sciences, 32(2), 191-199.
19 Gonçalves, B., Coutinho, D., Travassos, B., Folgado, H., Caixinha, P., & Sampaio, J. (2018). Speed synchronization, physical workload and match-to-match performance variation of elite football players. PloS one, 13(7), e0200019.
Gonzalez-Rodenas, J., Lopez-Bondia, I., Calabuig, F., Pérez-Turpin, J. A., & Aranda, R. (2016). Association between playing tactics and creating scoring opportunities in counterattacks from United States Major League Soccer games. International Journal of Performance Analysis in Sport, 16(2), 737-752.
Gréhaigne, J. F., Godbout, P., & Bouthier, D. (1999). The foundations of tactics and strategy in team sports. Journal of teaching in physical education, 18(2), 159-174.
Hughes, M. D., & Bartlett, R. M. (2002). The use of performance indicators in performance analysis. Journal of sports sciences, 20(10), 739-754.
Hughes, M., & Franks, I. (2007). The essentials of performance analysis: an introduction. Routledge.
Hughes, M., Caudrelier, T., James, N., Redwood-Brown, A., Donnelly, I., Kirkbride, A., & Duschesne, C. (2012). Moneyball and soccer-an analysis of the key performance indicators of elite male soccer players by position. Journal of Human Sport and Exercise, 7(2).
Kannekens, R., Elferink‐Gemser, M. T., & Visscher, C. (2011). Positioning and deciding: key factors for talent development in soccer. Scandinavian journal of medicine & science in sports, 21(6), 846-852.
McGarry, T., Anderson, D. I., Wallace, S. A., Hughes, M. D., & Franks, I. M. (2002). Sport competition as a dynamical self-organizing system. Journal of sports sciences, 20(10), 771-781.
McGarry, T. (2009). Applied and theoretical perspectives of performance analysis in sport: Scientific issues and challenges. International Journal of Performance Analysis in Sport, 9(1), 128-140.
Mendo, G., Anguera, T., & Santos, R. (2005). Desarrollo y optimización d euna herramienta observacional en el tenis de individuales. Psicothema, 17(1), 123-127.
Mohr, M., Krustrup, P., & Bangsbo, J. (2005). Fatigue in soccer: a brief review. Journal of sports sciences, 23(6), 593-599.
Palut, Y., & Zanone, P. G. (2005). A dynamical analysis of tennis: Concepts and data. Journal of Sports Sciences, 23(10), 1021-1032.
Pinto, C. E. D. C. C. (2014). The emergence of team synchronization during the soccer match: understanding the influence of the level of opposition, game phase and field zone (Doctoral dissertation).
Saal, C., Zinner, J., Fiedler, H., Lanwehr, R., & Krug, J. (2018). Ger J Exerc Sport Res. DOI: https://doi.org/10.1007/s12662-018-0511-6
Sampaio, J., & Maçãs, V. (2012). Measuring tactical behavior in football. International Journal of Sports Medicine, 33(5), 395–401.
Sampaio, J., Lago, C., Gonçalves, B., Maçãs, V. M., & Leite, N. (2013). Effects of pacing, status and unbalance in time motion variables, heart rate and tactical behaviour when playing 5-aside football small-sided games. Journal of Science and Medicine in Sport, 1–5. DOI: 10.1016/j.jsams.2013.04.005
Santos, R. D. M. M., Moraes, E. L., & da Costa, I. T. (2015). Análise de padrões de transição ofensiva da Seleção Espanhola de Futebol na Copa do Mundo FIFA® 2010. Revista Brasileira de Educação Física e Esporte, 29(1), 119-126.
20 Sarmento, H., Leitão, J., Anguera, T., & Campaniço, J. (2009). Observational methodology in football: Development of an instrument to study the offensive game in football. Motricidade, 5(3), 19-24.
Sarmento, H., Clemente, F. M., Araújo, D., Davids, K., McRobert, A., & Figueiredo, A. (2018). What performance analysts need to know about research trends in association football (2012– 2016): A systematic review. Sports medicine, 1-38.
Siegle, M., & Lames, M. (2013). Modeling soccer by means of relative phase. Journal of Systems Science Complexity, 26(1), 14–20.
Silva, P. M., Castelo, J., & Santos, P. (2011). Caracterização do processo de análise do jogo em clubes da 1ª liga portuguesa profissional de futebol na época 2005/2006. Revista brasileira de educação física e esporte, 25(3), 441-453
Strudwick, A. (2016). Soccer Science. Human Kinetics.
Taylor, J. B., Mellalieu, S. D., James, N., & Shearer, D. A. (2008). The influence of match location, quality of opposition, and match status on technical performance in professional association football. Journal of Sports Sciences, 26(9), 885-895.
Travassos, B., Araújo, D., Vilar, L., & McGarry, T. (2011). Interpersonal coordination and ball dynamics in futsal (indoor football). Human Movement Science, 30(6), 1245–1259.
Travassos, B., Araújo, D., Duarte, R., & McGarry, T. (2012). Spatiotemporal coordination behaviors in futsal (indoor football) are guided by informational game constraints. Human
Movement Science, 31(4), 932–945.
Yue, Z., Broich, H., Seifriz, F., & Mester, J. (2008). Mathematical analysis of a soccer game. Part II: Energy, spectral, and correlation analyses. Studies in Applied Mathematics, 121(3), 245-261.