417 EALR, V. 7, nº 2, p. 417-442, Jul-Dez, 2016
Universidade Católica de Brasília – UCB Brasília-DF
Economic Analysis of Law Review
Why Did EU’S Bailout to Greece Fail?
Por que a ajuda da UE à Grécia falhou?
Hungdah Su1
National Taiwan University
RESUMO
Este artigo discute a crise da dívida soberana que atin-giu a União Europeia nos últimos anos. A questão prin-cipal é que por isso que ajuda da UE à Grécia falha. Para analisar isso, compara-se com a ajuda da UE para com Portugal. Nós achamos que ambas as variáveis econômicas e a capacidade do governo estão no centro dessa falha.
ABSTRACT
This paper discusses the sovereign debt crisis that has hit the EU in recent years. The main question is why the EU’s bailout to Greece failed. In order to analyze thisthe author compares it to the EU’s bailout to other PIIGS and particularly Protugal. The author findsthat both economic variables and government capacity are at the heart of this failure.
Palavras-chave: Crise; União Europeia; Grécia; Portu-gal
Keywords: Euro Crisis; EU; Greece; Portugal
JEL: K0 R: 06/09/16 A: 13/10/16 P: 30/12/16
EALR, V. 7, nº 2, p. 417-482, Jul-Dez, 2016 418
1. Introduction
ince April 2010, sovereign debt crises have broken out successively in Greece, Ireland, Portugal and Spain, all of which were then forced to demand bailout from the EU and IMF. All of their credibility in the financial market was downgraded by rating agencies to the extent that they could no longer sell their government bonds in the market.2 Even Italian bonds were downgraded owing to Italy’s political instability, economic stagnation and rocketing debt ratio in spite of the fact that Italy has never demanded any bailouts from any international institutions. These five countries were nicknamed as PIIGS by British media.3 As all of them are member states of the Eurozone and Italy and Spain being the biggest economies only after Germany and France in particular, the sovereign debt crises in PIIGS soon developed into Euro Crisis, shaking market confidence in this common currency in the EU, which in turn constituted a storm in the global financial market.
In order to manage these crises along with the help of IMF, the EU decided to supply Debt 4 with a series of bailouts. Between April 2010 and August 2015, they have received a sum of €569.5 billion in both the EU and IMF bailouts.4 Under such circumstances, Ireland, Spain and Portugal have recovered from the crises; the yield rates of those three countries’ ten-year bonds were reduced to less than 7% one by one, who finally reintroduced and successfully sold out their ten-year bonds in the market before the end of 2014. The only exception is Greece, which is still unable to issue its ten-year bond in the financial market and whose debt ratio never ceased to increase since 2010. The EU was therefore forced to supply Greece with the second and third bailouts.
This paper therefore aims to answer why EU’s bailout to Greece failed to produce ex-pected results. There exist a lot of publication on the origin and history of Euro crisis; therefore, I will start with a retrospective analysis of EU’s strategies vis-à-vis these crises (section 2) before comparing the consequences of EU’s bailouts to the Debt 4. (section 3) Different ap-proaches aimed at explaining frustration of EU’s bailout to Greece are presented in section 4, which are evaluated one by one in order to falsify some popular theses and find out the real reasons why EU’s bailout to Greece failed to produce expected results. In the end, I will draw conclusions deduced from the above mentioned analyses and indicate the direction of future research.
2. Development of the EU’s bailout to Debt 4
2 The world’s three rating agencies are Moody’s Investor Service, Standard & Poor’s and Fitch Ratings。 3 PIGS as a jargon appeared for the first time in the British media in 1999, which included those newly acceded
Southern European countries such as Portugal, Italy, Greece and Spain. After financial tsunami broke out, the British columnist in Financial Times Robert Holloway started to use PIGS on 15 September 2008 to indicate those four Southern European countries suffering high debt ration and vulnerable to international financial tsunamis. In the aftermath of the outbreak of Euro crisis in spring 2010, PIGS was replaced by PIIGS which included Ireland. As PIGS or PIIGS was pejorative and publicly condemned by Portuguese Minister of Economic Affairs Manuel Pinho, they are now rarely used in public.
4 In this article, I will use Debt 4 to indicate Greece, Portugal, Ireland and Spain, which received bailout from the
EU since 2010. Debt 5 indicates Debt 4 plus Italy.
419 EALR, V. 7, nº 2, p. 417-442, Jul-Dez, 2016
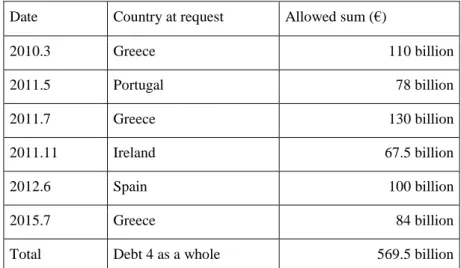
Quite often, Europeans believe that Debt 4 and Euro are the victims of financial tsunami after the Lehman Brothers Holdings Inc. had failed to obtain loans from the US government. To cope with this financial crisis, the G205 convened in spring 2009 in London decided to adopt the quantitative easing as policy to maintain the liquidity of world currencies and to avoid com-peting devaluation and global depression.6 If this policy did stabilize the global financial order, it did contribute substantively to inflation and rapidly increase deficit and debt in a lot of tries, provoking general worries about the debt repayment capacities particularly in those coun-tries whose credibility was always unsolid. Accordingly, the yield rate of ten-year bond of Debt 5 rocketed to more than 7% within a very short period of time, which prevented them from collecting capital in private markets and shook market confidence in Euro. In spring 2010, sov-ereign debt crisis firstly broke out in Greece.7 (Table 1)
Table 1 - Chronology of EU’s bailouts to Debt 4
Date Country at request Allowed sum (€)
2010.3 Greece 110 billion 2011.5 Portugal 78 billion 2011.7 Greece 130 billion 2011.11 Ireland 67.5 billion 2012.6 Spain 100 billion 2015.7 Greece 84 billion
Total Debt 4 as a whole 569.5 billion
Source: Author with reference of European Commission, Financial Assistance to EU Member States, <http://ec.europa.eu/economy_finance/assistance_eu_ms/index_en.htm> (retrieved on January 29, 2016)
In order to rescue the Debt 4, EU and IMF have offered a series of bailouts with a sum of €569.5 billion while striving for construction of following firewalls to contain the crises.8
5 G20 includes G7, four Asian countries (People’s Republic of China, India, South Korea and Indonesia), three
Latin American countries (Mexico, Brazil and Argentina), Russia, Turkey, South Africa, Saudi Arabia, Australia and the European Union. In total, G20 represents two-third of global population and 85% of global GDP.。 < http://www.diplomatie.gouv.fr/fr/politique-etrangere-de-la-france/diplomatie-economique-et-commerce-exteri- eur/peser-sur-le-cadre-de-regulation-europeen-et-international-dans-le-sens-de-nos/faire-de-la-regulation-inter-nationale-un-atout-pour-l-economie-francaise/article/qu-est-ce-que-le-g20 > (retrieved on October 2, 2015)
6 Concerning G20 in London, see Gordon Brown, Beyond the crash: overcoming the first crisis of globalization,
New York and London: Free Press, 2010.
7 Regarding development of Euro crisis, see Catherine Li, “EU Economic Governance and Fiscal Compact
Treaty”, in Catherine Li ed., The New Economic and Financial Policies of the EU under the Shadow of European
Debt Crisis, Taipei: NTU Press, 2013, pp. 75-114; Hsien-Feng Lee, “The European Sovereign Debt Crisis and the
Role of Credit Rating Agencies – Butcher’s Role or Scapegoats?” in Catherine Li ed., op. cit. pp. 75-114;
Der-Chin Horng, “ECB’s Responses to the Financial Crisis”,in Catherine Li ed., op. cit. pp. 75-114; Kuo-Chun Yeh,
“The Bail-out Debate and International Policy Coordination in the Euro Area”, in Catherine Li ed., op. cit., pp.
75-114.
8Hungdah Su, “Crisis and Opportunities in the EU Governance: Can Franco-German Cooperation Resolve the
EALR, V. 7, nº 2, p. 417-482, Jul-Dez, 2016 420
First, all EU member states except UK and the Czech Republic signed and ratified a treaty on Stability, Coordination and Governance in the Economic and Monetary Union aimed at reestablishing financial and budgetary disciplines in the EU and Eurozone. Signatory coun-tries with an annual deficit ratio of more than 3% or accumulative debt ratio of over 60% will be punished and obliged to reduce them.9 Second, an IMF-modeled European Stability Mech-anism (ESM) was created with a capital of €700 billion, whose mission is to rescue those mem-ber states of the Eurozone suffering from financial difficulties.
Third, European Central Bank (ECB) has adopted a more and more pro-active role in parallel to the bailout process by launching the Outright Monetary Transactions (OMT), the Public Sector Purchase Programme (PSPP), and the quasi-QE to print more banknotes to buy bonds of Debt 4 in order to scale down debt ratio of member states in the Eurozone. Fourth, German, French and other European leaders repeatedly reiterated their common resolution to defend Euro at any price and rebut any rumors that euro would be abandoned. Their firm reso-lution was further supported by America, Japan and IMF, which echoed European leaders’ statements and adopted appropriate policies in cooperation. EU’s bailout and construction of these firewalls did bury the expectation and rumors that Euro would collapse and resolve sov-ereign debt crises in Ireland, Spain and Portugal. But it failed to drag Greece out of the crisis as expected.
Ireland
Praised as Celtic Tiger, Ireland had enjoyed high-speed economic growth between mid-1990s and 2007. Its average annual growth rate was 6%, the best in the EU and among the top ten in the world (Table 2). Its unemployment rate was less than 5% or half of the average rate of the EU (Table 3) and its investment steadily represented at least 20% of the GDP (Table 4).
Table 2 - Irish economic growth between 1999 and 2013
Year 1999 2000 2002 2003 2004 2005 2006 2007 2008 2009 2010 2011 2012 2013
Rate 8.4 9.9 5.2 1.4 5.1 5.5 6 6 -3 -7.6 -1 0.7 0.9 0.6
Source: Indexmundi <http://www.indexmundi.com/g/g.aspx?c=ei&v=66> (retrieved on August 15, 2015) Table 3 - Irish unemployment rate between 1999 and 2013
Year 1999 2000 2002 2003 2004 2005 2006 2007 2008 2009 2010 2011 2012 2013
Rate 5.5 4.1 4.3 4.7 4.3 4.3 4.3 4.6 6.1 11.8 13.7 14.4 14.7 13.5
Source: Indexmundi <http://www.indexmundi.com/g/g.aspx?v=74&c=ei&l=en> (retrieved on August 15, 2015) Table 4 - Irish investment ratio of GDP between 2004 and 2012
Country 2004 2005 2006 2007 2008 2009 2010 2011 2012
421 EALR, V. 7, nº 2, p. 417-442, Jul-Dez, 2016
Ireland 23.8 27 28 26.3 21.2 15.5 16.5 19.7 10
Source: Indexmundi <http://www.indexmundi.com/g/g.aspx?v=142&c=ei&l=en> (retrieved on August 15, 2015)
Nonetheless, rapid economic growth and increasing investment led to rising price of real estate and, finally, bubbles. Between 1994 and 2006, an average price of real estate in Ireland had doubled. According to World Bank, Irish real estate index was 100 in 1970, slowly rising to 108.5 in 1988 but rocketing to 149.9 in 1999 and 381.2 in 2006.10 As the average income did not rise proportionately, Irish people resorted to loans for purchasing real estate, facilitated by the low interest rate. The ratio of total loan/GDP was 100% in 1999, increasing to 250% in 2008 and 290% in 2009.11 In 2006, among the two thirds of real estate deals, loans surpassed 90% of the purchasing fund.12 Irish real estate bubbles collapsed immediately after the financial tsunami had broken out in Wall Street in September 2008. Falling price of real estate, rising bad debts and fast expanding defaults forced Irish government to establish the National Asset Management Agency (NAMA) to assume the reimbursement of €100 billion of the six biggest banks. Accordingly, Ireland demanded bailouts from the EU and IMF in No-vember 2011.
EU’s bailout to Ireland is without doubt a success story. Over the past five years, Ireland has rapidly and steadily recovered from the real estate bubbles and debt crisis. Having suffered recession until 2012, Irish economy restarted to grow in 2013. In 2014, its economic growth rate even reached 5%, among the highest in Europe and the world (Table 5). More importantly, on 26 July 2012, Ireland succeeded in selling out its five-year bond with the yield rate of 5.9% and eight-year bond with the yield rate of 6.1% for €5 billion. On 13 March 2013, for the first time since it demanded rescue from the EU, Ireland sold out its ten-year bond with a yield rate of 4.3% for €5 billion. In December 2013, EU announced formally that its bailout to Ireland was terminated.
Table 5 - Irish economic growth rate (2004-2014)
Year 2004 2005 2006 2007 2008 2009 2010 2011 2012 2013 2014
% 4.6 5.7 5.5 4.9 -2.6 -6.4 -0.3 2.8 -0.3 0.2 4.8
Source: Eurstat, real GDP growth rate, <http://ec.europa.eu/eurostat/tgm/table.do?tab=table&init=1&lan-guage=en&pcode=tec00115&plugin=1> (retrieved on August 15, 2015)
Spain
Spain became the second country that was successfully dragged out of the crisis. Similar to Ireland, Spain had experienced real estate bubbles since the Olympic Games was held in
10 Hugh Pavletich, “International House Prices Comparison 1970-2006”, <
http://finfacts.ie/irishfinancenews/arti-cle_1012464.shtml> (retrieved on August 15, 2015)
11 Morgan Kelly, “The Irish Credit Bubble”, UCD Centre for Economic Research Working Paper Series 2009, WP
09/32 Dec. 2009. <https://www.ucd.ie/t4cms/wp09.32.pdf> (retrieved on August 15, 2015)
12 Patrick Honohan, “What Went Wrong in Ireland?” Paper for the World Bank in May 2009, p. 4.
EALR, V. 7, nº 2, p. 417-482, Jul-Dez, 2016 422
Barcelona in 1996. Between then and 2006, the average price of real estate in Spain rose to 250%. In Madrid and Barcelona, it even rose to more than 500%. Real estate bubbles and the relatively low interest then had facilitated loans and overvaluation of the mortgage until the financial tsunami. Since then, the price of real estate started to fall and bad debts were rocketing, accumulated to € 180 billion. In order to sustain its banking system, Spain demanded bailout from the EU in June 2012 and was granted €100 billion one month later.13 EU bailout did help Spain avoid the worst and soon recover from crises. On 20 November 2013, Spain successfully issued its six-month bond with yield rate of 0.494% for 840 million and one-year bond with yield rate of 0.687% for 3.709 billion. On 20 December 2013, Spain sold out its five-year bond with yield rate of 2.72% for 1.486 billion and ten-year bond with yield rate of 4.121% for 1.056 billion. On 23 January 2014, EU announced that its bailout to Spain was over.
Portugal
Several months later, the EU announced that its bailout to Portugal was also terminated. Unlike Ireland and Spain, Portugal did not go through a real estate bubble, but it did have a rocketing deficit and debt since the mid-1990s. Portuguese deficit rose up with an average an-nual rate of at least 10% between 1998 and 2007, far over the threshold of 3% imposed by the European Stability and Growth Pact. Fast enlargement of spending and rising deficit resulted in inflation and obliged the Portuguese government to issue more and more bonds. All this was leading to a fast rising debt ratio and a downgrading of Portuguese competitiveness in world ranking.14 Accordingly, on the eve of a financial tsunami, Portuguese economy depended heav-ily upon loans and hot money from abroad and suddenly collapsed afterwards. The two biggest banks, Banco Português de Negocios (BPN) and Banco Privado Português (BPP) risked bank-ruptcy in late 2010 and needed rescue from the government. In May 2011, Portugal demanded bailout from the EU and was granted 78 billion. After a series of reforms were adopted to im-plement austerity as required by the EU, the Portuguese government issued its three-year bond with yield rate of 3.10% for 3.76 billion on 3 October 2012. In January 2014, it issued a five-year bond with an interest of 4.657% for 3.25 billion.15 On 23 April 2014, Portugal auctioned €750 million in a ten-year bond at yield rate of 3.58%.16 On 18 May, the EU announced that its bailout to Portugal was completed.
Greece
However, unlike Ireland, Spain and Portugal, Greece still fails to return to the bond market as the EU has expected. On 10 April 2014, for the first time since the EU started its bailout in 2010, the Greek government issued a five-year bond with yield rate of 4.95% for 3 billion. It was more successful than expected as 20 billion was competing in buying these Greek bonds. On 9 July, Greece auctioned another 1.5 billion in a five-year bond at a yield rate of
13 William Chislett, “Is Spain Different? The Political, Economic and Social Consequences of Its Euro Crisis.”
International Journal of Iberian Studies, Vol. 28, No. 2-3, 2015, pp. 257-267.
14 Vito Gaspar, “Adjusting the Euro Area: The Case of Portugal”, speech at the IIIS-TSD Special at Trinity College
(Dublin, April 11, 2013). The author was the Portuguese Finance Minister back then. < http://www.irishecon- omy.ie/index.php/2013/04/04/iiis-tcd-special-event-vitor-gaspar-adjusting-in-the-euro-area-the-portuguese-case/> (retrieved on January 29, 2016)
15 Financial Times on 10 January 2014. 16 Financial Times on 23 April 2014.
423 EALR, V. 7, nº 2, p. 417-442, Jul-Dez, 2016
3.5%. These two successful experiences resulted in rising optimism in the EU about the Greek exit of bailout before the end of year 2014. Unfortunately, Greek politics entered into chaos in late 2014, which forced the EU to freeze all bailouts to Greece, and the Greek government shut down all banks for three weeks, which caused the yield rate of Greek bonds to skyrocket. Even after EU reopened its negotiations with Greece and adopted the third bailout, Greece still failed to return to bond market. (Table 6, Figure 1)
Table 6 - Yield rate of Greek ten-year bond between 2010 and 2015
2010 2011 2012 2013 2014 2015 January 6.02 11.73 -- 11.10 8.18 9.48 February 6.46 11.40 -- 10.95 7.70 9.72 March 6.24 12.44 -- 11.38 6.90 10.52 April 7.83 13.86 21.48 11.58 6.20 12.01 May 7.97 15.94 26.90 9.07 6.38 10.95 June 9.10 16.69 27.82 10.07 5.93 11.43 July 10.34 16.15 25.82 10.53 6.10 -- August 10.37 15.90 24.34 10.01 6.09 -- September 11.34 17.78 20.91 10.15 5.89 -- October 9.57 18.04 19.96 8.74 7.26 -- November 11.52 17.92 17.20 8.41 8.10 -- December 12.01 21.14 13.33 8.66 8.42 --
Source: Bank of Greece, “Government benchmark bond prices and yields”
<http://www.bankofgreece.gr/Pages/en/Statistics/rates_markets/titloieldimosiou/titloieldimo-siou.aspx?Year=2010> (retrieved on August 14, 2015)
Figure 1 - Yield rate of Greek ten-year bond between 2010 and 2015
Source: Author based upon the statistics of table 2
Comparing economic development of Debt 4 between 2008 and 2014, Greece did lag far behind other three countries (Table 7). Since the financial tsunami broke out in 2008, Greece was suffering ceaseless recessions and even depressions until 2014. In 2011, its economic
0, 7,5 15, 22,5 30,
Jun-10 Dec. 2011 Jun-13 Dec-14
%
EALR, V. 7, nº 2, p. 417-482, Jul-Dez, 2016 424
growth was even -9%, the worst in the world. (Table 8) Accordingly, Greek GDP of the year 2014 was only 82.5% of its GDP in 2010, compared to 107.5% in Ireland, 97.4% in Spain and 93.5% in Portugal. (Table 9)
Table 7 - Average economic growth of DEBT 5 between 2008 and 2014
2008-2014 2010-2014 EU28 0.11% 0.94% Euro19 -0.11% 0.64% Ireland -0.21% 1.44% Greece -4.11% -4.8% Spain -0.71% -0.5% Portugal -1.06% -0.92%
Source: made by the author with reference to Eurostat <http://www.indexmundi.com/g/g.aspx?c=ei&v=66> (re-trieved on August 14, 2015)
Table 8 - Economic growth rate of PIIGS between 2004 and 2014
2004 2005 2006 2007 2008 2009 2010 2011 2012 2013 2014 EU28 2.5 2.0 3.4 3.1 0.5 -4.4 2.1 1.7 -0.5 0.1 1.3 Euro19 2.2 1.7 3.3 3.1 0.5 -4.5 2.0 1.6 -0.8 -0.4 0.8 Ireland 4.6 5.7 5.5 4.9 -2.6 -6.4 -0.3 2.8 -0.3 0.2 4.8 Greece 5.0 0.9 5.8 3.5 -0.4 -4.4 -5.4 -8.9p -6.6p -3.9p 0.8p Spain 3.2p 3.7p 4.2p 3.8p 1.1p -3.6p 0.0p -0.6p -2.1p -1.2p 1.4p Italy 1.6 0.9 2.0 1.5 -1.0 -5.5 1.7 0.6 -2.8 -1.7 -0.4 Portugal 1.8 0.8 1.6 2.5 0.2 -3.0 1.9 -1.8 -4.0 -1.6e 0.9e
Source: Eurostat <http://www.indexmundi.com/g/g.aspx?c=ei&v=66> (retrieved on August 14, 2015) Table 9 - GDP ratio of the DEBT 5 between 2010 and 2014(2010=100.0)
2010 2011 2012 2013 2014 EU28 100.0 101.7 101.2 101.3 102.6 Euro19 100.0 101.6 100.8 100.4 101.3 Ireland 100.0 102.8 102.5 102.6 107.5 Greece 100.0 91.1 85.1 81.8 82.5 Spain 100.0 99.4 97.3 96.1 97.4 Italy 100.0 100.6 97.8 96.1 95.7 Portugal 100.0 98.2 94.2 92.7 93.5
425 EALR, V. 7, nº 2, p. 417-442, Jul-Dez, 2016
Source: Eurostat <http://appsso.eurostat.ec.europa.eu/nui/submitViewTableAction.do> (retrieved on August 14, 2015)
Among the four cases, Ireland is distinguished from the other three as it had suffered financial and banking crises only. Regarding Greece, Spain and Portugal, the crises were more complicated and comprehensive, involving financial, banking, economic, social and even po-litical difficulties.17 All these three countries had become democracies as late as the 1970s be-fore they acceded to the then European Communities in the 1980s. Since then abundant public and private capital started to invest in these countries, resulting in structural transition. In order to continue the peaceful democratization, appease the military and even please the electorate, all these three countries ceaselessly increased the spending on social welfare, free education, cheap oil, cheap electricity, nearly free water supply and a lot of unnecessary public construc-tion. In order to satisfy massive job seekers and, at the same time, downsize the military and police, governments had to enlarge the public sector and create a number of unnecessary posts. Accession to European Communities also reshaped consuming behaviors in these three coun-tries, which more and more got used to loans and credits and their saving rates never ceased to decrease.
Accordingly, public and private debts were fast rising up, which could only be balanced by the trade surplus and inflow of foreign capital. Loans from capital market, structural funds from the EU, regular devaluation to stimulate export, and even emigration have constituted the leverages for these countries over the past decades.18 Stripped of devaluation maneuvering since circulation of the Euro in 2002 as well as the EU structural fund after its eastward en-largement in 2004, Greece, Spain and Portugal could not but depend increasingly upon loans and hot money to sustain their economic development, leading to sovereign debt crisis. How-ever, even with help of bailouts from the EU and the IMF, why did Greece fail to drag out of the crisis as other Debt 4 countries had achieved in 2014?
3. Approaches explaining
the failure of EU’s bailout to Greece and their
evaluation
3.1. Approaches
The debate over this failure can be divided into three groups.
The most popular approach blamed the supplier of bailout, that is, the EU and its bailout strategy. Ideally, the EU bailout should aim to stimulate Greek economic recovery by attracting more international as well as domestic capital to invest in Greece. Unfortunately, inflow of the FDI to Greece was always negligible while the outflow of Greek capital was accelerating
17 The author, interview, Daniel Traca, Professor and Dean of NOVA School of Business and Economics, NOVA
School of Business and Economics (Lisbon), September2, 2015.
18 The author, Interview, Maria Jose Alvarenga, Adjoint Director of AICEP Portugal, AICEP (Lisbon), August 31,
EALR, V. 7, nº 2, p. 417-482, Jul-Dez, 2016 426
throughout the bailout process.19 The EU bailout also failed to reverse the vicious circle of in-creasing debt ratio, inin-creasing loan volume and more demanding bailout.20 To make things worse, the EU bailout might have discouraged private sectors to invest in Greece as the EU imposed more constraints in the domestic economy.21 The austerity imposed by the EU bailout totally buried any hope for economic recovery in Greece, leading to another vicious circle com-posed of bailout, austerity and recession.22 In brief, the EU’s bailout is contradictory in itself. It intended to prevent Greece from defaulting by imposing austerity that turned off all engines of economic growth.
The second approach also blamed the EU but focused upon the political maneuvering in the bailout. It is wrong from the very beginning for the EU with leadership of Germany and France to resolve the economic and financial crises by political solutions.23 The German, French and Eurozone leaders focused exclusively on integrity of the Euro and financial order in the EU and took into consideration domestic politics of their own countries. In the end, they neglected the politics in Greece and failed to evaluate and understand the sustainability of the Greek political system.24 Massive reduction of positions in public sector and reduction of pen-sions and salaries of public servants all caused general hostility and even resistance against the EU actions or inactions in the process.25 The fact that the EU bailout failed to help reform and consolidate Greek political system explained its failure.
The third approach highlighted the lack of Greek social participation in the bailout pro-cess. As bailout negotiations were handled by the bureaucrats in Brussels and Athens and often dominated by key figures of the ECB and the German Ministry of Finance, they were easily lobbied by interest groups and constraint by bureaucratic culture to the extent that they never seriously took into consideration general interest of Greek salaries. The latter then became vic-tims of the bailout, leading to general hostility and resistance against the EU and rise-up of extremist parties.26
3.2. Evaluation
The failure of the EU bailout to Greece has provoked debate in academia that intended to find out the reasons of this frustration. Based upon the first approach, this failure has resulted from the EU’s bailout strategy itself that never aimed at stimulating Greek economy. On the
19 Jonathan Munemo, Arabinda Basistha, "Chapter 21 Foreign Aid and Export Performance: A Panel Data
Analy-sis of Developing Countries" In Sajal Lahiri ed., Theory and Practice of Foreign Aid, Amsterdam; Oxford: Else-vier, 2007, pp. 421-433.
20 Harris Dellas and George S. Tavlas, “Gold Standard, the Euro, and the Origins of the Greek Sovereign Debt
Crisis”, Cato Journal, Vol. 33, No. 3, fall 2013, p. 515.
21 Hamid beladia and Reza Oladib, “Chapter 4 Does Foreign Aid Impede Foreign Investment?” in ibid, pp. 53-63. 22 Hartmut Fischer; Elliot Neaman; Shalendra Sharma, “Why the Greek Meltdown Became a Euro-Zone Crisis”,
Whitehead Journal of Diplomacy and International Relations, Vol. 12, No. 2, summer/fall 2011, p. 48.
23 Grant Hollis, “Sovereignty Debt Crisis”, North East Law Review, Vol. 2, No. 1, January 2014, p. 22.
24 Michael P. Malloy, “Negotiating in a Ditch: Institutional Implications of the Sovereign Debt Crisis”,
Connecti-cut Journal of International Law, Vol. 28, No. 1, fall 2012, p. 12.
25 Farah Abuzeid, “Foreign Aid and the ‘Big Push’ Theory: Lessons from Sub-Saharan Africa”, Stanford Journal
of International Relations, Vol. 11, No. 1, 2009, pp. 18-20.
26 Claudia Williamson, “Exploring the Failure of Foreign Aid: The Role of Incentives and Information”, Review
427 EALR, V. 7, nº 2, p. 417-442, Jul-Dez, 2016
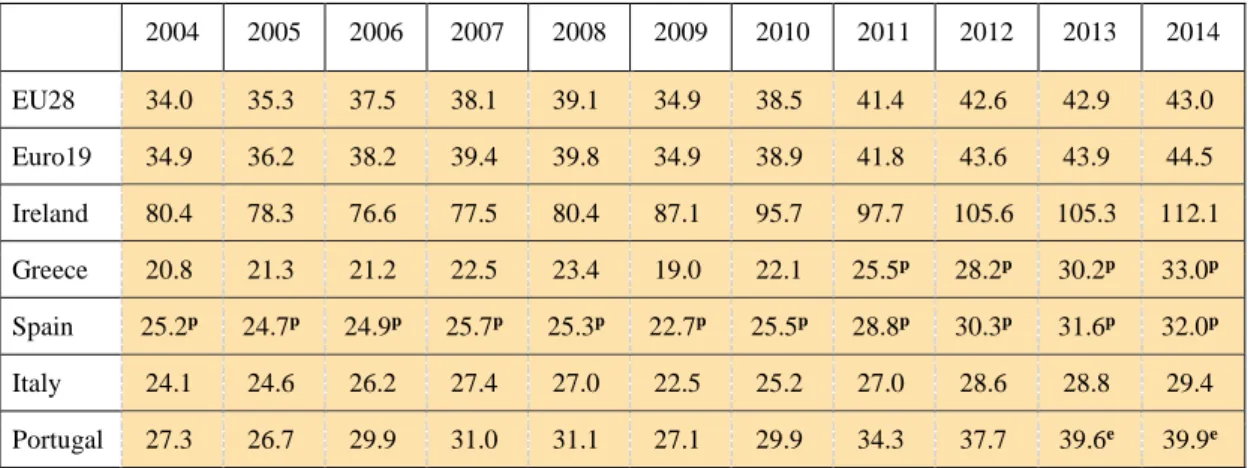
contrary, it imposed austerity as a pre-condition and refrained from helping restructure the Greek economy. Before all, the depreciation of euro did help increase export of Debt 4 but Greece did not benefit from it as much as the other three countries because, compared to the three other countries, its export represents a lower percentage in its GDP. However, this hy-pothesis has been falsified. Among the Debt 4, the export/GDP ratio in Ireland was 80% in 2010 and surpassing 100% in 2012. Portugal, Spain and Greece had very similar ratios between 2010 and 2014. In 2010, they were respectively 29.9%, 25.5% and 22.1%. In 2014, they were 39.9%, 32.0% and 33.0%. Within four years, their exports have respectively grown 10.0%, 6.5% and 10.9%. (Table 10)
Table 10 - Ratio of export/GDP of Debt 5 between 2004 and 2014
2004 2005 2006 2007 2008 2009 2010 2011 2012 2013 2014 EU28 34.0 35.3 37.5 38.1 39.1 34.9 38.5 41.4 42.6 42.9 43.0 Euro19 34.9 36.2 38.2 39.4 39.8 34.9 38.9 41.8 43.6 43.9 44.5 Ireland 80.4 78.3 76.6 77.5 80.4 87.1 95.7 97.7 105.6 105.3 112.1 Greece 20.8 21.3 21.2 22.5 23.4 19.0 22.1 25.5p 28.2p 30.2p 33.0p Spain 25.2p 24.7p 24.9p 25.7p 25.3p 22.7p 25.5p 28.8p 30.3p 31.6p 32.0p Italy 24.1 24.6 26.2 27.4 27.0 22.5 25.2 27.0 28.6 28.8 29.4 Portugal 27.3 26.7 29.9 31.0 31.1 27.1 29.9 34.3 37.7 39.6e 39.9e
Source: Eurostat <http://www.indexmundi.com/g/g.aspx?c=ei&v=66> (retrieved on August 14, 2015)
Therefore, with help of the EU and the IMF bailout, Greece did increase its exports as much as Portugal and its exports have steadily represented a similar ratio of GDP to that of Portugal. The real weakness in Greek trade exists in its long-term trade deficit. In 2010, the Greek export/import ratio was 0.63% behind Portugal (0.79%), Spain (0.93%) and Ireland (1.22%). Four years later, Greek export/import ratio was upgraded to 0.85%, however, still far behind Portugal (0.98%), Spain (1.02%) and Ireland (1.29%) (Table 11). The continuous trade deficit explained well why Greece failed to reimburse its debt as fast as the other three countries because it could not accumulate capital by trade.27
Table 11 - Export/Import ratio of Debt 5 between 2004 and 2014
2004 2005 2006 2007 2008 2009 2010 2011 2012 2013 Ireland 1.24 1.22 1.17 1.14 1.13 1.12 1.22 1.23 1.27 1.29 Greece 0.62 0.69 0.71 0.67 0.63 0.62 0.63 0.71 0.76 0.85 Spain 0.92 0.87 0.83 0.81 0.8 0.82 0.93 0.93 0.97 1.02 Italy 1.02 1.03 1 0.97 0.99 0.97 0.98 0.93 0.95 1.04 Portugal 0.8 0.77 0.75 0.78 0.8 0.76 0.79 0.8 0.89 0.98 Source: Eurostat
<http://www.indexmundi.com/g/g.aspx?c=ei&v=66> (retrieved on August 14, 2015)
27 The author, Interview, Daneiel Traca, Dean of NOVA School of Business and Economics, NOVA School of
EALR, V. 7, nº 2, p. 417-482, Jul-Dez, 2016 428
Another Achilles heel was the high debt ratio in Greece from the very beginning. Be-tween 2010 and 2014, the debt/GDP ratio in Greece increased 30.1%, higher than that in Ireland (22.3%) but lower than that in Spain (37.6%) and Portugal (34%), indicating that the EU bailout might have slowed down Greek debt growth of this period. However, Greece already suffered a debt/GDP ratio of 147% when it deposited demand for bailout from the EU in 2010 but Por-tugal and Spain had only 111.1% and 84.4% when they deposited the similar demands respec-tively in 2011 and 2012 (Tables 12, 13 and 14). The overweighed debt/GDP ratio might explain why EU bailout to Greece failed to constitute similar success to that in Ireland, Spain and Por-tugal.
Table 12 - Debt/GDP ratio of Debt 5 between 2004 and 2014
2004 2005 2006 2007 2008 2009 2010 2011 2012 2013 2014 EU28 x x x X X X X 80.9 83.7 85.5 86.8 Euro19 X x x X X X x 85.8 89.1 90.9 91.9 Ireland 28.3 26.2 23.8 24.0 42.6 62.3 87.4 111.2 121.7 123.2 109.7 Greece x x x 112 116 131 147 171.3 156.9 175.0 177.1 Spain 45.3 42.3 38.9 35.5 39.4 52.7 60.1 69.2 84.4 92.1 97.7 Italy 100.0 101.9 102.5 99.7 102.3 112.5 115.3 116.4 123.1 128.5 132.1 Portugal 62.0 67.4 69.2 68.4 71.7 83.6 96.2 111.1 125.8 129.7 130.2 Source: Eurostat <http://ec.europa.eu/eurostat/tgm/table.do?tab=table&init=1&language=en&pcode=tsdde410&plugin=1> (re-trieved on August 14, 2015)
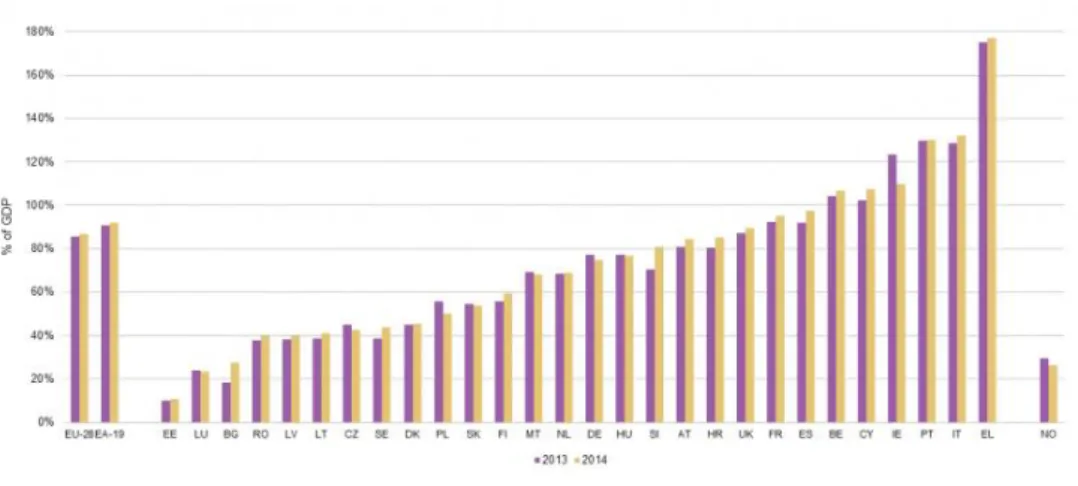
Table 13 - Debt/GDP ratio of EU 28 in 2013-2014
Source: Eurostat
<http://ec.europa.eu/eurostat/statistics-explained/index.php/File:Maastricht_debt_as_a_percent-age_of_GDP,_2013%E2%80%932014.png> (retrieved on August 14, 2015)
429 EALR, V. 7, nº 2, p. 417-442, Jul-Dez, 2016
Source: Eurostat
<http://ec.europa.eu/eurostat/statistics-explained/images/b/b1/Public_balance_and_general_govern-ment_debt%2C_2011%E2%80%9314_%28%C2%B9%29_%28%25_of_GDP%29_YB15_II.png> (retrieved on
August 14, 2015)
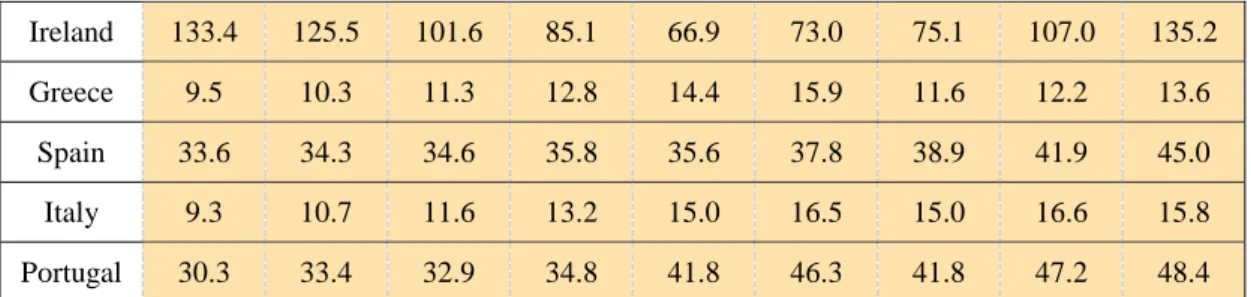
Another indicator has also shown Greece’s weakness in economic recovery. In compar-ison to the other three countries of Debt 4, Greece suffered insufficient investment both from the private and public sector, regardless as to whether the investment was domestic or from abroad. Low investment and inflow of FDI should have damaged Greek economic recovery. (Tables 15 and 16)
Table 15 - Investment/GDP ratio of Debt 5 between 2004 and 2014
2004 2005 2006 2007 2008 2009 2010 2011 2012 2013 2014 EU28 21.1 21.4 22.0 22.6 22.5 20.6 20.1 20.2 19.7 19.2 19.3 Euro19 21.7 22.0 22.7 23.1 23.0 21.1 20.6 20.7 20.1 19.5 19.5 Ireland 26.6 28.9 29.1 27.6 24.2 19.7 15.8 14.5 15.6 15.2 16.4 Greece 24.5 20.7 23.1 25.7 23.7 20.9 17.3 15.4p 11.7p 11.2p 11.6p Spain 28.5p 29.9p 31.1p 31.0p 29.2p 24.3p 23.0p 21.4p 19.7p 18.5p 18.9p Italy 20.8 21.1 21.5 21.6 21.2 20.0 19.9 19.6 18.3 17.4 16.8 Portugal 23.4 23.1 22.5 22.5 22.8 21.1 20.5 18.4 15.8 14.6e 14.6e
Source: Eurostat <http://www.indexmundi.com/g/g.aspx?c=ei&v=66> (retrieved on October 14, 2015) Table 16 - Inflow of FDI/GDP of Debt 5 between 2004 and 201
2004 2005 2006 2007 2008 2009 2010 2011 2012
EALR, V. 7, nº 2, p. 417-482, Jul-Dez, 2016 430 Ireland 133.4 125.5 101.6 85.1 66.9 73.0 75.1 107.0 135.2 Greece 9.5 10.3 11.3 12.8 14.4 15.9 11.6 12.2 13.6 Spain 33.6 34.3 34.6 35.8 35.6 37.8 38.9 41.9 45.0 Italy 9.3 10.7 11.6 13.2 15.0 16.5 15.0 16.6 15.8 Portugal 30.3 33.4 32.9 34.8 41.8 46.3 41.8 47.2 48.4
Source: Eurostat <http://ec.europa.eu/eurostat/tgm/table.do?tab=table&init=1&lan-guage=en&pcode=tec00105&plugin=1> (retrieved on October 14, 2015)
A number of scholars also attacked the oversized public sector in Greece, charged as the main reason of the Greek debt crisis and the malaise of Greek economic recessions. Ac-cording to them, the Greek economy was mainly driven by governmental investment and the public sector, both of which were cut off by austerity policies imposed by the EU bailout. Ac-cordingly, EU’s bailout did prevent Greece from default and bankruptcy but also deprived Greece of its main engines of economic growth. However, in comparison to the other three countries of Debt 4 in the years 2010-2014, Greek public sector did represent a higher ratio in economy, which was however not evident. Its ratio is equivalent to the average of EU 28 and Eurozone 19 (Table 17).
Table 17 - Public spending/GDP ratio of PIIGS between 2004 and 2014
2004 2005 2006 2007 2008 2009 2010 2011 2012 2013 2014 EU28 20.1 20.2 20.0 19.7 20.2 21.8 21.5 21.0 21.0 21.0 20.9 Euro19 19.8 19.9 19.8 19.5 20.0 21.6 21.4 20.9 21.0 21.1 21.1 Ireland 16.0 15.9 16.2 16.7 18.6 20.1 18.7 17.9 17.7 17.5 16.9 Greece 18.7 19.7 19.5 19.9 20.3 22.7 21.6 21.2p 21.2p 20.0p 19.8p Spain 17.2p 17.3p 17.4p 17.7p 18.8p 20.5p 20.5p 20.4p 19.6p 19.5p 19.2p Italy 19.1 19.6 19.4 18.9 19.4 20.6 20.4 19.6 19.6 19.6 19.5 Portugal 16.6 16.6 17.0 16.5 17.0 18.8 18.2 18.6 18.0 17.4p 15.7p
Source: Eurostat <http://www.indexmundi.com/g/g.aspx?c=ei&v=66> (retrieved on August 14, 2015)
In sum, excessive debt ratio from the very beginning, continuous and cumulative trade deficit and lack of investment did slow down Greek economic recovery to the extent that it still fails to collect capital in the private market even after it has received three bailouts from the EU.
The second approach distinguished itself from the first as it put absolute emphasis on the role of government. According to it, sovereign debt crisis happened in those countries where the government failed to play its legitimate role that should supply its society and people with good and efficient governance. Inefficient governance could not adapt the country to a fast evolving world economy or alert the society of the crisis during its very first stage. Therefore the EU’s bailout that promoted austerity and reform of public sector as pre-conditions was cor-rect. The failure of the EU’s bailout to Greece resulted from insufficient reforms of its public sector, not less.
431 EALR, V. 7, nº 2, p. 417-442, Jul-Dez, 2016
According to Transparency International, between 2010 and 2014, Greek scores in cor-ruption did progress from 35 to 43 while Portugal progressed from 60 to 63 and Spain was even downgraded from 60 to 61.28 Though having achieved impressive progress within four years, Greece still lagged far behind a majority of European countries and ranked equivalently to any third world countries. In other words, corruption still exists in a majority of public sectors in Greece, which has severely handicapped its economic governance. (Table 18)
Table 18 - Corruption index of DEBT 4 between 2010 and 2014
2009 2010 2011 2012 2013 2014
Greece 3.8 3.5 3.4 36 40 43
Spain 6.1 6.1 6.2 65 59 60
Portugal 5.8 6.0 6.1 63 62 63
Ireland 8.0 8.0 7.5 69 72 74
Source : Transparency International : Corruption Perception Indexes 2009-2014 <http://www.transparency.org/research/cpi> (retrieved on October 14, 2015)
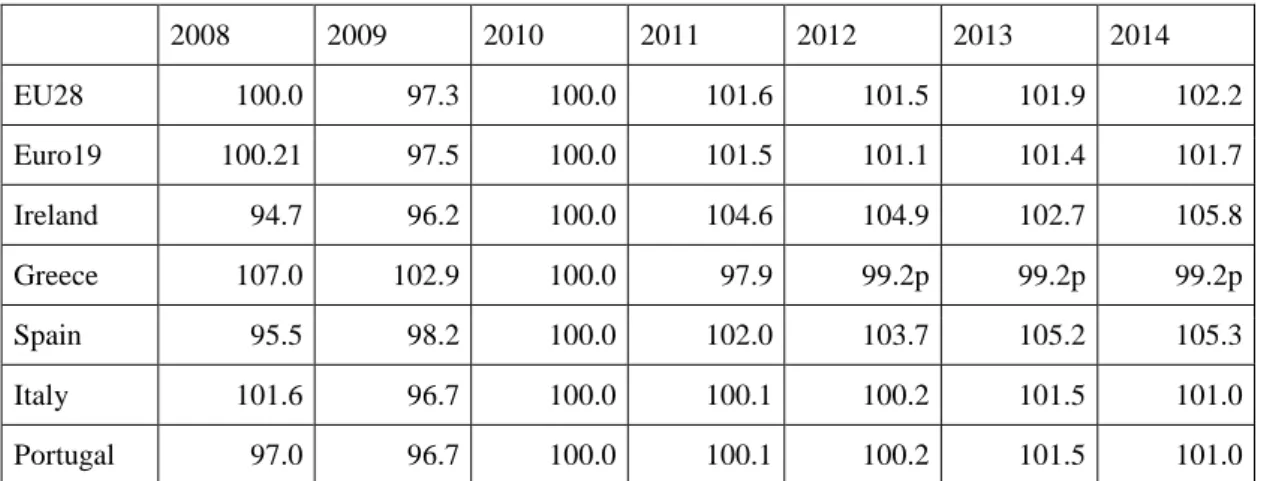
To worsen things, Greek competitiveness ceaselessly downgraded since it received bailout from the EU and IMF in 2010. Its ranking fell from 67 in 2010 to 91 in 2013-2014, though it rose to 81 in 2014-2015. Contrary to Greece, Spain steadily ranked between 35 and 38 during the same period while Portugal rose from 42 to 35 and Ireland from 35 to 25. In terms of governance capacities, Greece’s ranking fell between 2010 and 2012 but surprisingly im-proved afterwards. (Table 19 and 20) As regards to the basic and advanced infrastructural con-struction, Greece’s ranking stagnated between 2010 and 2012 but, again, rose afterwards (Table 21).
Table 19 - Debt 4 in Global Competitiveness ranking between 2013 and 2015
2013-14 average 2014-15 average 2013-14 Institution* 2014-15 institution 2013-14 Governance** 2014-15 governance 2013-14 innovation 2014-15 innovation Greece 91 81 88 76 67 65 81 74 Spain 35 35 38 42 28 31 32 39 Portugal 51 36 41 41 46 37 38 31 Ireland 28 25 33 31 24 21 21 20
Source: World Economic Forum, Global Competitiveness Reports 2013-2014 & 2014-2015. <http://www.weforum.org/reports?filter[type]=Competitiveness&page=2> (retrieved on August 14, 2015)
* World Economic Forum grouped those 12 indicators into three categories. The first category indicates the Basic Requirements Subindexes, including governmental institutions, basic infrastructures, macroeconomics, health care and fundamental education.
** The second category is Efficiency enhanced subindexes, including higher education, market regulation and techonology.
28 In corruption index, 0 indicates very corrupt and 100 indicates very clean. Transparency International <
EALR, V. 7, nº 2, p. 417-482, Jul-Dez, 2016 432
Table 20 - Evolution of Debt 4 competitiveness between 2008 and 2014 (2010=100.0)
2008 2009 2010 2011 2012 2013 2014 EU28 100.0 97.3 100.0 101.6 101.5 101.9 102.2 Euro19 100.21 97.5 100.0 101.5 101.1 101.4 101.7 Ireland 94.7 96.2 100.0 104.6 104.9 102.7 105.8 Greece 107.0 102.9 100.0 97.9 99.2p 99.2p 99.2p Spain 95.5 98.2 100.0 102.0 103.7 105.2 105.3 Italy 101.6 96.7 100.0 100.1 100.2 101.5 101.0 Portugal 97.0 96.7 100.0 100.1 100.2 101.5 101.0
Source: Eurostat <http://appsso.eurostat.ec.europa.eu/nui/show.do?dataset=nama_10_lp_ulc&lang=en> (re-trieved on October 2, 2015)
Table 21 - Debt 4 in World ranking of infrastructure 2010-11 av-erage 2011-12 average 2010-11 institutions 2011-12 institutions 2010-11 Infra. 2011-12 Infra. Greece 67 80 84 96 42 45 Spain 38 38 35 49 14 12 Portugal 42 44 48 51 24 23 Ireland 35 37 24 23 38 29
Source: World Economic Forum, Global Competitiveness Reports 2013-2014 & 2014-2015. <http://www.wefo-rum.org/reports?filter[type]=Competitiveness&page=2> (retrieved on August 14, 2015)
* Until 2012, WEF used twelve indicators. Here it indicates governmental institutions. ** Here it indicated infrastructure.
Greece was also blamed of its weak taxation system to the extent that fraud has become a common phenomenon, stripping government of its important income from taxation. However, Greek ratio of taxation/GDP is very similar to other three countries of Debt 4. (Table 22-25) This comparison has revealed that Greek taxation capacity is not necessarily weaker than Por-tuguese. Taxation did not contribute to the explanation of failure of the EU bailout to Greece.
Table 22 - Ratio of taxation/GDP in DEBT 5 between 2004 and 2014
2004 2005 2006 2007 2008 2009 2010 2011 2012 2013 2014 EU28 11.6 11.7 11.7 11.7 11.3 10.9 11.3 11.6 11.8 11.9 11.9 Euro19 11.1 11.3 11.4 11.4 10.9 10.5 10.8 11.0 11.3 11.4 11.5 Ireland 10.5 10.8 11.7 11.3 10.0 8.8 9.0 8.5 8.8 9.3 9.5 Greece 10.1 10.2 10.9 11.1 11.0 9.9 10.9 11.3p 11.1p 11.5p 13.5p Spain 10.2p 10.7p 10.8p 10.0p 8.2p 6.9p 8.7p 8.4p 9.0p 9.6p 9.8p Italy 12.2 12.5 13.1 13.0 12.2 11.7 12.3 12.5 13.4 12.9 13.3
433 EALR, V. 7, nº 2, p. 417-442, Jul-Dez, 2016
Portugal 12.0 12.7 13.2 13.0 12.6 11.2 11.6 12.1 12.1 12.1e 12.5e
Source: Eurostat
<http://www.indexmundi.com/g/g.aspx?c=ei&v=66> (retrieved on October 2, 2015)
Table 23 - Ratio of taxation from production and import of PIIGS between 2004 and 2014
2004 2005 2006 2007 2008 2009 2010 2011 2012 2013 2014 EU28 13.1 13.1 12.6 12.5 12.8 13.0 13.3 13.4p 13.5p Euro19 12.9 12.8 12.3 12.3 12.4 12.6 12.9 12.9p 13.1p Ireland 12.5 12.7 13.4 12.9 11.8 10.7 10.8 10.2 10.4 10.9 11.2 Greece 12.2 12.6 12.6 11.7 12.6 13.5 13.3 13.9 15.4 Spain 11.8 12.2 12.3 11.5 9.7 8.5 10.2 9.9 10.4 11.0 11.2 Italy 13.7 13.9 14.5 14.4 13.6 13.4 13.9 14.1 15.2 14.8 15.3 Portugal 13.8 14.5 14.8 14.4 14.0 12.6 13.2 13.9 13.9 13.8 14. Source: Eurostat <http://ec.europa.eu/eurostat/tgm/table.do?tab=table&init=1&language=en&pcode=tec00020&plugin=1> (re-trieved on October 2, 2015)
Table 24 - Ratio of income tax/GDP of DEBT 5 between 2004 and 2014
2004 2005 2006 2007 2008 2009 2010 2011 2012 2013 2014 EU28 13.0 13.2 13.0 12.2 12.1 12.3 12.7 12.9p 12.9p Euro19 12.0 12.4 12.3 11.4 11.4 11.7 12.2 12.5p 12.4p 12.0 12.4 Ireland 13.2 13.1 13.9 13.5 12.5 12.2 12.1 12.4 13.1 13.3 13.6 Greece 8.2 8.3 8.2 8.5 8.2 9.1 10.6 10.3 9.4 Spain 10.2 10.8 11.6 12.7 10.4 9.4 9.3 9.5 10.1 10.0 10.0 Italy 12.8 12.8 13.8 14.5 14.7 14.1 14.1 13.8 14.8 15.0 14.7 Portugal 8.1 8.0 8.3 9.2 9.3 8.6 8.5 9.5 9.0 11.4 10.9 Source: Eurostat <http://ec.europa.eu/eurostat/tgm/table.do?tab=table&init=1&language=en&pcode=tec00018&plugin=1> (re-trieved on October 2, 2015)
Table 25 - Ratio of Governmental income/GDP of DEBT 5 between 2004 and 2014
2004 2005 2006 2007 2008 2009 2010 2011 2012 2013 2014
EU28 44.0 44.0 44.0 43.6 43.6 44.0 44.7 45.4p 45.2p
Euro19 44.6 44.7 44.4 44.4 44.3 44.8 45.9 46.6p 46.6p
EALR, V. 7, nº 2, p. 417-482, Jul-Dez, 2016 434 Greece 38.7 40.2 40.6 38.7 41.1 43.8 45.7 47.8 45.8 Spain 38.6 39.5 40.5 40.9 36.7 34.8 36.2 36.0 37.0 37.5 37.8 Italy 43.3 43.0 44.0 45.2 45.1 45.9 45.6 45.6 47.8 48.0 48.1 Portugal 39.9 40.5 40.9 41.5 41.6 40.4 40.6 42.6 42.9 45.2 44.5 Source: Eurostat <http://ec.europa.eu/eurostat/tgm/table.do?tab=table&init=1&language=en&pcode=tec00021&plugin=1> (re-trieved on October 2, 2015)
Nonetheless, this comparison has also highlighted longtime existent Greek high defi-cit/GDP ratio. Between 2010 and 2013, Greece’s average defidefi-cit/GDP ratio was 10% while it was 8.5% in Spain and 7.25% in Portugal. Though Ireland suffered 14.78% in 2010 owing to the governmental solution to bank debt crisis, it quickly dropped to 5.8% in 2013. Everlasting high deficit forced the Greek government to depend upon loans and debt, leading to the debt crisis (Table 26).
Table 26 - Ratio of debt/GDP of PIIGS between 2004 and 2014
2004 2005 2006 2007 2008 2009 2010 2011 2012 2013 2014 EU28 x x x x x x X -4.5 -4.2 -3.2 -2.9 Euro19 x x x x x x X -4.1 -3.6 -2.9 -2.4 Ireland 1.4 1.3 2.8 0.3 -7.0 -13.9 -32.5 -12.7 -8.1 -5.8 -4.1 Greece x X -3.6 -5.1 -7.7 -13.6 -8.7 -10.2 -8.7 -12.3 -3.5 Spain 0.0 1.2 2.2 2.0 -4.4 -11.0 -9.4 -9.4 -10.3 -6.8 -5.8 Italy -3.6 -4.2 -3.6 -1.5 -2.7 -5.3 -4.2 -3.5 -3.0 -2.9 -3.0 Portugal -6.2 -6.2 -4.3 -3.0 -3.8 -9.8 -11.2 -7.4 -5.6 -4.8 -4.5
Source: Eurostat, Hellenic Statistical Authority (EL. STAT)
<http://ec.europa.eu/eurostat/tgm/table.do?tab=table&init=1&language=en&pcode=tec00127&plugin=1;> (re-trieved on August 14, 2015)
<http://www.statistics.gr/portal/page/portal/ESYE/PAGE-themes?p_param=A0701&r_param=SEL03&y_param=2009_00&mytabs=0> (retrieved on August 20, 2015)
The third approach bases its explanation upon societal factors. According to the third approach, the EU bailout was dominated by bureaucrats from both sides and suffered lack of societal participation failed to satisfy people’s needs. However, Eurobarometers made it clear that more than 60% Europeans agreed that bailout should be in hands of EU institutions, gov-ernments of member states and IMF. When asked if any new actors should be included, a ma-jority of Europeans chose G20 rather than any societal sectors or NGOs.29
Besides, EU bailouts to Debt 4 followed the same process, which was initiated and ne-gotiated by Member State government, European Commission, European Central Bank and IMF. The proposed package was then submitted to EU Ecofin Council and afterwards endorsed
435 EALR, V. 7, nº 2, p. 417-442, Jul-Dez, 2016
by European Council. The whole process was dominated by political leaders and bureaucrats, which perhaps might explain why general support to the EU slightly declined throughout the bailout process;30 however, it cannot illustrate why the same bailout has resulted in different developments in Debt 4 countries.
The above mentioned analysis has made it clear that EU bailout to Greece failed to achieve the similar results to that in other three countries of the Debt 4 countries because Greece had suffered excessive debt and deficit ratio at the very beginning. It needed more time and capital to overcome this crisis. Moreover, with the help of the EU bailout, Greece did improve its export, which however did not produce any important trade surpluses. Similarly, the fact that the EU insisted upon structural reforms throughout bailout process did improve efficiency of the Greek governance. Nonetheless, this improvement was not evident enough to strengthen Greek governance to manage its already very weak economic structure.
3.3. In particular comparison to Portugal
This weak economic structure and political governance prevented Greek government from working with EU throughout the bailout process to manage its politico-economic crisis, a point particularly highlighted in particular comparison to Portugal as Greece and Portugal share a lot of similarities in terms of GDP, population, democratization process and origin of crises.31 (Table 27)
Table 27 - Ireland, Portugal and Greece in terms of GDP and population
Ireland Portugal Greece
GDP 2014 (US$ billion) 246.4 230.0 284.3
Population 2014 4,892,305 10,825,309 10,775,643
Source: The World Factbook, <https://www.cia.gov/library/publications/the-world-factbook> (retrieved on Oc-tober 2, 2015)
It might involve differences between Greece and Portugal in term of political structure and culture. Compared to Greece, Portugal was more influenced by British tradition rather than by French culture. On the one hand, reform has prevailed over revolution as the mainstream political development in Portugal. Even the democratization revolution in 1974 was very peace-ful without any casualties. On the other hand, extremism has never been dominant in Portuguese democracy. No extreme right force ever existed in Portugal while the extreme left was negligi-ble.32 Absence of extreme forces has permitted the Portuguese government enough room to reform throughout the bailout process. For example, in response to the demand upon austerity of the EU bailout and scaling down the public sector, Lisbon government adopted the policy
30 European Commission, Standard Eurobarometer 83, spring 2015.
31 Jerome L. Stein, “Diversity of Debt Crises in Europe”, Cato Journal, Vol. 31, No. 2, spring/summer 2011, pp.
201 & 214.
32 The author, interview, Ivone Moreira, Researcher at Portuguese Institute of International Studies, Portuguese
EALR, V. 7, nº 2, p. 417-482, Jul-Dez, 2016 436
based upon ‘no layoff of a single functionary with general reduction of salary of all’, success-fully leading to reduction of 20-30% salary in public sector.33 On the contrary, in Greece, the similar reforms reduced the average salary and sacked off thousands of functionaries, leading to general strike and demonstrations one after another. In Greece the mainstream political par-ties were severely weakened, giving rise to extremist forces that provoked anti-Europe popu-lism.
Portuguese government has also adopted the export-driven policy to increase income from the very beginning. Export represented 29% of Portuguese GDP in 2010 but rapidly in-creased to 40% in 2014, impressively reducing its deficit and debt ratios.
In the immediate aftermath of debt crisis, the Portuguese government adopted this ex-port promotion strategy as a flagship plan as well as an integral part of resolution. A monthly meeting was established in the cabinet, presided over by the deputy prime minister, which aimed at facilitating all relating to trade, export and investment. All the ministers involved in trade and leading entrepreneurs were invited. In parallel, Portuguese government targeted Latin America as the next market of Portuguese export and selected Mexico and Colombia as two privileged partners. According to Lisbon, Mexico could develop into a new base for Portuguese products to penetrate into the NAFTA markets. Regarding Colombia, it would be a test market for promotion of Portuguese export in those more open markets in Latin America because Bra-zil was deemed too protectionist even for Portuguese products. Those already important pres-ence of Portuguese enterprises in Brazil could constitute the bridgehead to penetrate into the more or less Brazilian-styled Colombia.
Accordingly, Portugal and Mexico created the Joint Commission for promotion of busi-ness as early as 2010, which is convened every month and co-presided over by Portuguese deputy prime minister and Mexican first minister. At the monthly meeting of Joint Commission, all the proposals aimed at facilitating bilateral trade and investment were put into the agenda. Once adopted, they were brought back to both capitals and immediately implemented under supervision of the deputy prime minister and first minister. Portugal simultaneously started ne-gotiations on FTA with Colombia, which entered into force in November 2014.34
In parallel with its export promotion, Portuguese government was making efforts to at-tract more FDI. Based upon its solid infrastructure, enjoyable living environment and English-speaking environment, Portuguese government ceaselessly contacted transnational enterprises one by one, persuading them to move one or several sectors of the headquarters to Portugal.
33 The author, interview, Paulo Gorjao, Director of Portuguese Institute of International Relations, Portuguese
Institute of International Relations (Lisbon), September 1, 2015.
34 The author, interviews, Pedro Ortigao Correi, Administrator of AICEP Portugal Global, Maria Jose Alvarega,
Adjoint Director of AICEP Portugal Global, Leonilde Ventura, Senior Officier of Portoguese Ministry of Econ-omy, and Maria Oliveira Fernades, Head of Unit of Portuguese Ministry of EconEcon-omy, and Daniel Traca, Dean of NOVA School of Business and Economics, Lisbon, August 31 – September 2, 2015.
437 EALR, V. 7, nº 2, p. 417-442, Jul-Dez, 2016
Though targeting particularly the R&D sector, Portugal welcomed such sectors as after service, financial, training and stock and offered them immunities and privileges.35
As the political culture and electorate preferred reforms to revolutionary actions, suc-cessive Portuguese governments then worked hard to promote export, exploit new markets, improve environment for investment and attract foreign capital. As economic and financial con-ditions improved in Portugal, EU announced the end of bailout to Portugal in May 2014.
4. Conclusion
Greece formally deposited its demand for bailout in April 2010, signaling the sovereign debt crisis in EU and Eurozone. Within two years, Ireland, Portugal and Spain were obliged to demand bailouts from the EU and IMF, leading to the infamous PIIGS in international media. However, between December 2013 and May 2014, EU announced the end of bailout to Ireland, Spain and Portugal successively. Former president of European Commission, Manuel Barrosso even predicted that the Euro crisis could be terminated before the end of year 2014. Contrary to this optimism and different from other three countries, the rumors of Greek default were always present in the international market and Greece was forced to demand the second and third bailout respectively in July 2011 and July 2015. The Eurosceptic and anti-EU populism was simultaneously expanding in Greece to the extent that mainstream political parties were marginalized and the extreme left came into power. The success of EU bailout to Ireland, Spain and Portugal contradicted with its failure to Greece, provoking fierce debate in academia.
This article therefore aimed at comparing EU bailouts to Greece and other three coun-tries of Debt 4 with help of different approaches in order to find out the most appropriate ex-planation for the EU’s failure in Greece. It has falsified the third approach based upon societal participation and clarified the first and second approaches.
The first approach focuses upon economic and financial factors, condemning those bailouts with inappropriate offer of capital and wrong timing, which could deprive the receiver of its leverages to stimulate economy. Following this approach, this research has found out that consistent trade deficit in spite of increasing export, low investment from domestic as well as from abroad and the excessive debt ratio at the very beginning could be the real reasons for EU’s failure in Greek bailout.
The second approach focuses upon governing capacities, the lack of which could pre-vent the receiving country from well managing the bailout capital to restructure and stimulate its economy. Based upon this thesis, tax fraud and a disproportionately large public sector were among the most important reasons for the EU’s failure in the Greek bailout. However, compared to three other countries of Debt 4, Greek taxation capacities were not weaker while its public sector was not bigger either, falsifying these two theses. But, in world rankings on corruption and competitiveness, Greece always lagged behind Portugal, Spain and Ireland, being placed
35 The author, interviews, Pedro Ortigao Correi, Administrator of AICEP Portugal Global, Maria Jose Alvarega,
Adjoint Director of AICEP Portugal Global, Leonilde Ventura, Senior Officier of Portoguese Ministry of Econ-omy, and Maria Oliveira Fernades, Head of Unit of Portuguese Ministry of EconEcon-omy, and Daniel Traca, Dean of NOVA School of Business and Economics, Lisbon, August 31 – September 2, 2015.
EALR, V. 7, nº 2, p. 417-482, Jul-Dez, 2016 438
among those Latin American and African countries. Its rank in competitiveness even fell from 67 in 2010 to 91 in 2013-2014. In term of governance and competitiveness, Greece lagged behind from the very beginning, indicating its weak political structure and governing capacities. In particularly compared to Portugal, Greece lacked solid political culture that prevailed reforms over revolutionary actions, which marginalized mainstream parties and strengthened populism. Constraint by such political culture and development, the Greek government and political leaders failed to adopt such general strategies and concrete plans as Portugal to exploit new markets for its export, produce trade surplus, upgrade governing capacities and promote national competitiveness. Different from its rescues to Portugal, EU bailout to Greece failed to restructure the latter’s political structure and stimulate its economy. Accordingly EU can only continue its bailouts to Greece to avoid the worst scenario, preventing the Greek debt crisis from developing into a euro crisis again.
5. References
Books
ARESTIS, P. 2012. The Euro Crisis. Houndmills and New York: Palgrave Macmillan.
BEBLAVY, M. & Cobham, D. & Odor, L. 2011. The Euro Area and the Financial Crisis. Cambridge and New York: Cambridge University Press.
BROWN, Gordon. 2010. Beyond the crash: overcoming the first crisis of globalization. New York and London: Free Press.
A chapter in books
BELADIA, Hamid. & Oladib, Reza. 2006. “Chapter 4 Does Foreign Aid Impede Foreign In-vestment?” In Theory and Practice of Foreign Aid, ed. Hamid Beladi & E. Kwan Choi. Emerald Group Publishing Limited, 55-63.
DER-CHIN HORNG, “ECB’s Responses to the Financial Crisis”, in Catherine Li ed., The
New Economic and Financial Policies of the EU under the Shadow of European Debt Crisis (in Chinese), Taipei: NTU Press, 2013, pp. 75-114.
CATHERINE LI, “EU Economic Governance and Fiscal Compact Treaty”, in Catherine Li
ed., The New Economic and Financial Policies of the EU under the Shadow of European Debt Crisis (in Chinese), Taipei: NTU Press, 2013, pp. 75-114.
HSIEN-FENG LEE, “The European Sovereign Debt Crisis and the Role of Credit Rating
Agencies – Butcher’s Role or Scapegoats?” in Catherine Li ed., The New Economic and
Fi-nancial Policies of the EU under the Shadow of European Debt Crisis (in Chinese), Taipei: NTU Press, 2013, pp. 75-114.
439 EALR, V. 7, nº 2, p. 417-442, Jul-Dez, 2016
MUNEMO, Jonathan & Basistha, Arabinda. 2007. “Chapter 21 Foreign Aid and Export Per-formance: A Panel Data Analysis of Developing Countries.” In Sajal Lahiri ed., Theory and Practice of Foreign Aid, Amsterdam; Oxford: Elselvier, pp. 421-433.
KUO-CHUN YEH, “The Bail-out Debate and International Policy Coordination in the Euro
Area”, in Catherine Li ed., The New Economic and Financial Policies of the EU under the
Shadow of European Debt Crisis (in Chinese), Taipei: NTU Press, 2013, pp. 75-114.
Journal articles
ABUZEID, Farah. 2009. “Foreign Aid and ‘Big Push’ Theory: Lessons from Sub-Saharan Af-rica.” Standford Journal of International Relations, Vol. 11, No. 1, pp. 16-23.
DELLAS, Harris; Tavlas, George S. “Gold Standard, the Euro, and the Origins of the Greek Sovereign Debt Crisis”, Cato Journal, 33 (3), Fall 2013: 491-520.
GUTIERREZ, M. 2013. “Flying too close to the Sun: How an EMU expulsion provision will prevent the European Sovereign Debt Crisis from Becoming a Modern Greek Tragedy?” Hou-ston Journal of International Law, Vol. 35, No. 2, pp. 431-464.
HARTMUT; Neaman, Elliot; Sharma, Shalendra, “Why the Greek Meltdown Became a Euro-Zone Crisis”, Whitehead Journal of Diplomacy and International Relations, Vol. 12, No. 2, summer/fall 2011, pp. 43-56.
HOLLIS, Grant Hollis. “Sovereignty Debt Crisis”, North East Law Review, Vol. 2, No. 1, Jan-uary 2014, pp. 1-36.
MALLORY, Michael P. 2012. “Negotiating in a Ditch: Institutional Implications of the Sover-eign Debt Crisis”, Connecticut Journal of International Law, Vol. 28, No. 1, fall, pp. 1-20. STEIN, Jerome L. 2011. “Diversity of Debt Crises in Europe”, Cato Journal, Vol. 31, No. 2, spring/summer, pp. 199-216.
HUNGDAH SU, “Crisis and Opportunities in the EU Governance: Can Franco-German Coop-eration Resolve the European Debt Crisis?”, Public Governance Quarterly (in Chinese), Vol. 1, No. 4, Dec. 2013, pp. 34-49.
TSOUKALA, Philomila. 2013.“Euro Zone Crisis Management and the New Social Europe”, Columbia Journal of European Law, Vol. 20, No. 1, fall, pp. 31-76.
WILLIAM, Chislett. 2015. “Is Spain Different? The Political, Economic and Social Conse-quences of Its Euro Crisis,” International Journal of Iberian Studies Vol. 28, No. 2-3, pp. 257-266.
WILLIAMSON, Claudia. 2009. “Exploring the Failure of Foreign Aid: The Role of Incentives and Information.” Review of Austrian Economy, pp. 17-33.
EALR, V. 7, nº 2, p. 417-482, Jul-Dez, 2016 440
BANK OF GREECE. 2010. “Government benchmark bond prices and yields.”
<http://www.bankofgreece.gr/Pages/en/Statistics/rates_markets/titloieldimosiou/titloieldimo-siou.aspx?Year=2010.> Retrieved August 14, 2015.
EUROPEAN COMMISSION. Standard Eurobarometer 83. EUROPEAN COMMISSION. 2011. Standard Eurobarometer 75.
EUROPEAN COMMISSION. 2015a. Eurostat, “Real GDP Growth Rate.” in <http://ec.eu-ropa.eu/eurostat/tgm/table.do?tab=table&init=1&language=en&pcode=tec00115&plugin=1. > Retrieved August 14, 2015.
EUROPEAN COMMISSION. 2015b. Eurostat. <http://appsso.eurostat.ec.europa.eu/nui/sub-mitViewTableAction.do.> Retrieved August 14, 2015.
EUROPEAN COMMISSION. 2015c. Eurostat. “General government gross debt.”
<http://ec.europa.eu/eurostat/tgm/table.do?tab=table&init=1&lan-guage=en&pcode=tsdde410&plugin=1>. Retrieved August 14, 2015.
EUROPEAN COMMISSION. 2015 d. Eurostat. File:Maastricht debt as a percentage of GDP, 2013–2014.png. <http://ec.europa.eu/eurostat/statistics-explained/index.php/File:Maas-tricht_debt_as_a_percentage_of_GDP,_2013%E2%80%932014.png.> Retrieved August 14, 2015.
EUROPEAN COMMISSION. 2015e. Eurostat. <http://ec.europa.eu/eurostat/statistics-ex-
plained/images/b/b1/Public_balance_and_general_govern-ment_debt%2C_2011%E2%80%9314_%28%C2%B9%29_%28%25_of_GDP%29_YB15_II. png.> Retrieved August 14, 2015.
EUROPEAN COMMISSION. 2016. Financial Assistance to EU Member States. <http://ec.eu-ropa.eu/economy_finance/assistance_eu_ms/index_en.htm> Retrieved January 29, 2016. EUROPEAN COMMISSION. 2015f. Eurostat. “Inward FDI stocks in % of GDP.”
<http://ec.europa.eu/eurostat/tgm/table.do?tab=table&init=1&lan-guage=en&pcode=tec00105&plugin=1.> Retrieved October 14, 2015.
EUROPEAN COMMISSION. 2015g. Eurostat. “Labour productivity and unit labour costs.” <http://appsso.eurostat.ec.europa.eu/nui/show.do?dataset=nama_10_lp_ulc&lang=en.> Re-trieved October 14, 2015.
EUROPEAN COMMISSION. 2015h. Eurostat. “Taxes on production and imports.”
441 EALR, V. 7, nº 2, p. 417-442, Jul-Dez, 2016
EUROPEAN COMMISSION. 2015i. Eurostat. “Current taxes on income, wealth, etc..” in
<http://ec.europa.eu/eurostat/tgm/table.do?tab=table&init=1&lan-guage=en&pcode=tec00018&plugin=1.> Retrieved October 14, 2015.
EUROPEAN COMMISSION. 2015j. Eurostat. “Total general government revenue.” in
<http://ec.europa.eu/eurostat/tgm/table.do?tab=table&init=1&lan-guage=en&pcode=tec00021&plugin=1.> Retrieved October 14, 2015.
EUROPEAN COMMISSION. 2015k. Eurostat. “General government deficit/surplus.”
<http://ec.europa.eu/eurostat/tgm/table.do?tab=table&init=1&lan-guage=en&pcode=tec00127&plugin=1.> RetrievedOctober 14, 2015.
France DIPLOMATIE. 2012. “Qu’est-ce que le G20 ?”
<http://www.diplomatie.gouv.fr/fr/politique-etrangere-de-la-france/diplomatie-economique- et-commerce-exterieur/peser-sur-le-cadre-de-regulation-europeen-et-international-dans-le-
sens-de-nos/faire-de-la-regulation-internationale-un-atout-pour-l-economie-francaise/article/qu-est-ce-que-le-g20.> Retrieved October 2, 2015.
HELLENIC STATISCAL AUTHORITY (EL. STAT) 2015. <http://www.statistics.gr/por-
tal/page/portal/ESYE/PAGE-themes?p_param=A0701&r_param=SEL03&y_param=2009_00&mytabs=0.> Retrieved Oc-tober 2, 2015.
OECD. “Definition of ODA.” <http://www.oecd.org/dac/stats/officialdevelopmentassis-tancedefinitionandcoverage.htm> Retrieved October 2, 2015.
TRASPARENCY INTERNATIONAL. 2015. “Corruption Perception Indexes 2009-2014.” <http://www.transparency.org/research/cpi>. Retrieved October 2, 2015.
WORLD ECONOMIC FORUM. 2013. “Global Competitiveness Reports 2013-2014”
<http://www.weforum.org/reports?filter[type]=Competitiveness&page=2> Retrieved October 2, 2015.
WORLD ECONOMIC FORUM. 2014. Global Competitiveness Reports 2014-2015” <http://www.weforum.org/reports?filter[type]=Competitiveness&page=2> Retrieved October 2, 2015.
THE WORLD FACTBOOK. <https://www.cia.gov/library/publications/the-world-factbook> Retrieved October 2, 2015.
EALR, V. 7, nº 2, p. 417-482, Jul-Dez, 2016 442
2015/8/15 (accessed) IndexMundi. 2015a. “Unemployment rate.” <http://www.In-dexMundi.com/g/g.aspx?v=74&c=ei&l=en>.
2015/8/15 (accessed) IndexMundi. 2015b. “GDP - real growth rate.” <http://www.In-dexMundi.com/g/g.aspx?c=ei&v=66 .Retrieved>.
2015/8/15 (accessed) IndexMundi. 2015c. “Investment (gross fixed).” <http://www.In-dexMundi.com/g/g.aspx?v=142&c=ei&l=en>.
2015/8/15 (accessed) Kelly, Morgan. 2009. “The Irish Credit Bubble.” UCD Centre for
Eco-nomic Research Working Paper Series 2009, WP 09/32.
<https://www.ucd.ie/t4cms/wp09.32.pdf>.
2015/8/15 (accessed) Pavletich, Hugh. 2009. “International House Prices Comparison 1970-2006. <http://finfacts.ie/irishfinancenews/article_1012464.shtml>.
Interviews
The author, 1/9/2015. Ivone Moreira, Portuguese Institute of International Studies (Lisbon). The author, 1/9/2015. Paulo Gorjao, Portuguese Institute of International Relations (Lisbon). The author, 2/9/2015. Pedro Ortigao Correi, AICEP Portugal Global (Lisbon).
The author, 2/9/2015. Maria Jose Alvarega, AICEP Portugal Global (Lisbon).
The author, 1/9/2015. Leonil de Ventura, Portuguese Ministry of Economy (Lisbon). The author, 1/9/2015. Maria Oliveira Fernades, Portuguese Ministry of Economy (Lisbon). The author, 1/9/2015. Daniel Traca, NOVA School of Business and Economics (Lisbon).